Kingfa Science and Technology Bullish on the BreakoutKingfa Science and Technology (KINGFA) is a leading manufacturer of medical devices in India. it is showing signs of a breakout. This is a good opportunity to buy the stock and ride the upside potential.
Kingfa Science and Technology (KINGFA) is a leading manufacturer of medical devices in India. The company has a strong track record of growth, and it is well-positioned to benefit from the growing demand for medical devices in India
The stock has been consolidating in a range for the past few
Bullish Patterns
KOLTEPATIL Stock Analysis: Is it a Buy?Kolte Patil Developers (KOLTEPATIL) is a leading real estate company in India. The stock is currently trading above its 50-day moving average and 200-day moving average, which is a bullish signal. The relative strength index (RSI) is also in the overbought territory, which suggests that the stock may be due for a correction.
Technical indicators:
Moving averages: The stock is currently trading above its 50-day moving average (MA) and 200-day MA, which is a bullish signal. The MAs are sloping
Sun Tv Super Bullish There's a strong support around Rs 440 and from there SunTv tried to push it in up direction following uptrend. And the nearest Target visible is RS 681, and in long run it may try to break the high of RS 1080.
HAPPY INVESTING
Comment your thoughts and let me know of your ideas.
Thank you. ^_^
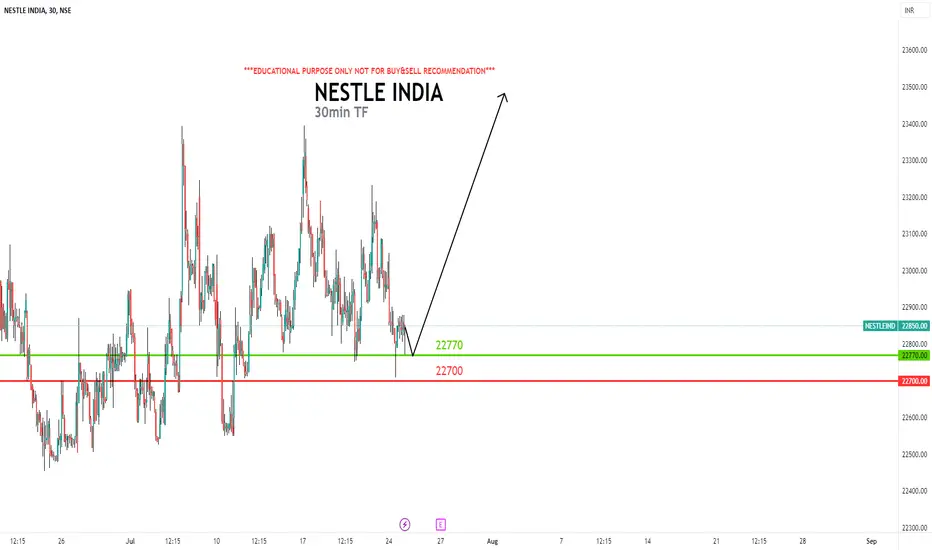
NESTLE INDIAHi, in this chart i found a good demand level for long in NESTLE INDIA stock...please Observe this levels and Analysis your own... Don't Take any orders Based on this Chart because this is just Observation purpose only i am posting...
I Observed these Levels based on price action and Demand & Supply which is My Own Concept Called "PENDAM ZONES" ... Don't Take any trades based on this chart/Post...because this chart is for educational purpose only not for Buy or Sell Recommendation.. Thank Q
KPIL Hourly looking bullishKPIL Hourly looking bullish, it has trendline breakout with 200 ema support on daily candle.
Good to buy at 574 with sl below 566 for target of 601.
This is purely for training and educational purposes. We shall not be responsible for your profit or loss.
The stocks discussed or recommended here, may not be suitable for all investors. Investors must make their own investment decisions based on their specific investment objectives and financial position.
Triveni Daily looking bullishTriveni Daily looking bullish. It has trendline breakout, with 200 ema support on daily candle. Good to buy at 320 for target of 374 with sl below 284
*This is purely for training and educational purposes. We shall not be responsible for your profit or loss.
*The stocks discussed or recommended here, may not be suitable for all investors. Investors must make their own investment decisions based on their specific investment objectives and financial position.
Why am I buying Angel One ?Company overview.
Angel One Ltd is a Diversified Financial Services Company with market share of 21.5%(As per previous year data). Company Offers wide range of services like Broking, Research, Advisory, Loans, and More.
Fundamentals of the company.
>>Positive Points about the Company:
*Reduced Debt.
*Consistent Profit Growth of 52.2% CAGR in the Last 5 Years.
*Good Track Record of Return on Equity (ROE): 44.1% over 3 Years.
*Healthy Dividend Payout: 36.2%.
*Improved Debtor Days from 66.7 to
$NSE:NIFTY MOVEMENT in the coming week (24th July 2023)NSE:NIFTY fell by 234 points on 21st July 2023 and is now at 19745. It is shy of 255 points to reach the 20K summit. I feel in the coming week due to the positive inflow of funds from Foreign Portfolio Investors(FPI's) and no negative news bothering the Indian economy, NSE:NIFTY will surpass the 20000 mark by 28th July 2023.
Even if NSE:NIFTY were to fall on Monday 24th July 2023, it will find support at 19700 level and may move sideways for a few days before it makes a second attempt to s
MAZDOCK chart gives hints about a future bull runNSE:MAZDOCK has been on the rise since June. It has broken past the resistance level of 1000 INR in June. During the first week of July, it has breached the 1300 mark and has found support at that level (marked in MAROON LINE). In the second week of July, it has crossed the 1600 line and has found support at 1600 (marked in PINK LINE). It is now on course to go over the 2000 mark, which it will in the coming few days. You could buy NSE:MAZDOCK at current levels and hold on till 2200+.
The
BankNifty - 19 July 2023I have clearly explained in my YT video about today's rangebound market and tomorrow's prediction.
Please do watch my old videos in Daily Analysis Playlist to understand the Entry and Exit criteria.
Do follow and subscribe if you like the analysis .
I've Bullish sentiment for tomorrow. Everything depends on tomorrow's market opening.
Trade or invest according to your analysis. This is just my view.
<----- 3MRT Trading ----->
Nifty 50 - 19 July 2023I have clearly explained in my YT video about today's rangebound market and tomorrow's prediction.
Please do watch my old videos in Daily Analysis Playlist to understand the Entry and Exit criteria.
Do follow and subscribe if you like the analysis .
I've Bullish sentiment for tomorrow. Everything depends on tomorrow's market opening.
Trade or invest according to your analysis. This is just my view.
<----- 3MRT Trading ----->
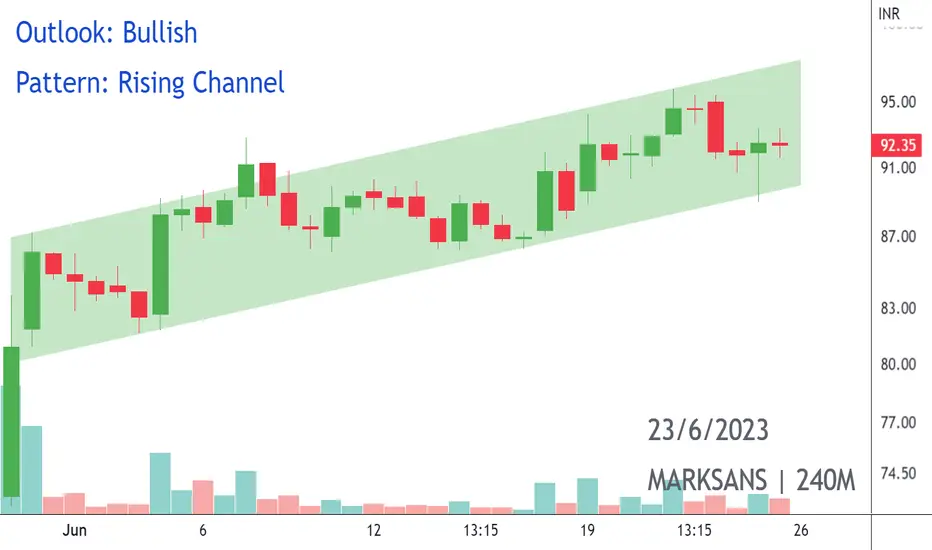
📈 Exciting Bullish Pattern Alert! 🐂📊 Pattern: Rising Channel
📌 Symbol/Asset: MARKSANS PHARMA LIMITED
🔍 Description:
Stock In Rising Channel, Buy On Dips
👉 Remember: Technical patterns are just one piece of the puzzle. Consider conducting further research, consulting with a financial advisor, and managing your risks appropriately.
Cup and Handle chart patternThis chart pattern is shaped like and resembles like a cup and handle that's why its named the same as cup and handle chart pattern.
Shape:
A “U” shaped bottom is preferred over a “V” shaped bottom as it indicates more consolidation. Ideally, the highs on either side of the cup should be equal.
Duration of formation:
The cup can take anywhere from 1 to 6 months to form, while the handle should take 1-4 weeks.
Confirmation:
The pattern is confirmed as bullish when the price breaks abo