INFOSYSNSE:INFY is a very strong fundamental IT company.
recently it is underperforming since last 10 months, but on the daily chart frame it has created a beautiful inverse head and shoulder pattern, which is looking very promising.
one can make position in this stock for the targets of 1960 in next 3 to 6 months.
Bullish Patterns
Pound Pushing PThe GBP/USD pair builds on Friday's solid recovery from a six-week low and gains strong follow-through traction for the second successive day. The momentum lifts spot prices to a two-and-half-week high, around the 1.2170 area during the first half of the European session and is sponsored by the prevalent US Dollar selling bias. From a technical perspective the break above the December 28 highs at 1.2125, the last key lower high in the corrective move down from the December 14 peak, marks an impo
FINNIFTY Bullish view till 19000* All the information shared in this chart is provided for strictly educational purposes only.
* This chart is sharing information are based on the theory of technical analysis .
* This is not an offer to buy or sell stocks, futures , options, commodity, forex, interests or any other trading security.
* Back test yourself before jump into live market consult your financial adviser and use proper risk management.
------------------------------------------
FINNIFTY Level's
---------------------
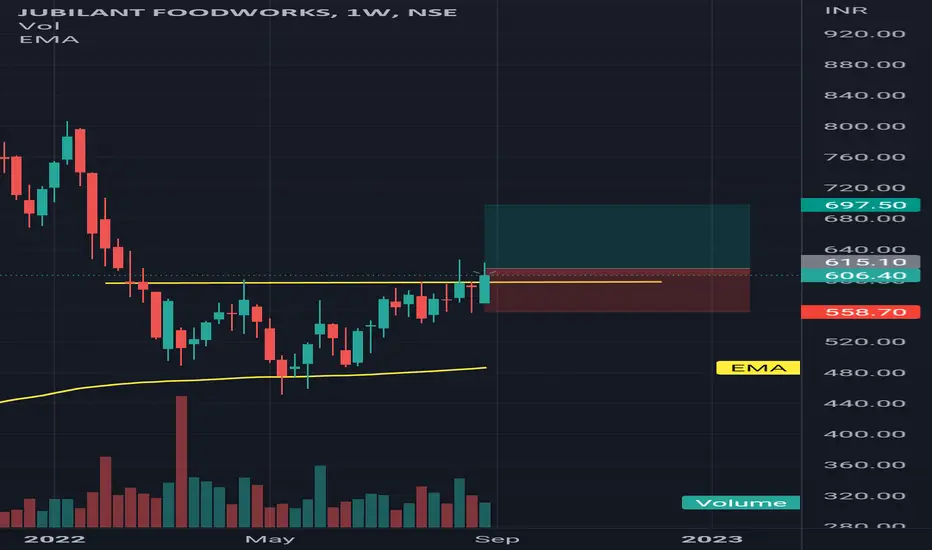
JUBLFOOD - Weekly bullish.. LongJUBLFOOD - Weekly bullish.. Long
This week its a bullish engulf, last week ite a hammer and prior week it triee to brk resistant line.. And this week its closed above resistance.. Looking good to take position... Target would be 630,640...
Note:: im not sebi registered. Kindly consider as educational post, plz do ur own analysis before taking position...
INFOSYS BREAKOUT SWING TRADE - INVERTED HEAD AND SHOULDERSGood day :)
NIFTY IT has given a range breakout with a strong Marubozu open candle.
Most of the IT stocks are performing really good and most of them are giving breakouts.
I have identified one of the most strongest stocks of the IT sector which holds a weightage of more than 7% in Nifty. The stock is INFOSYS.
This stock has been in a channel since May 2022. In the recent support at the base of channel , the stock has created a Inverted Head and Shoulder pattern which signals a bullish trend
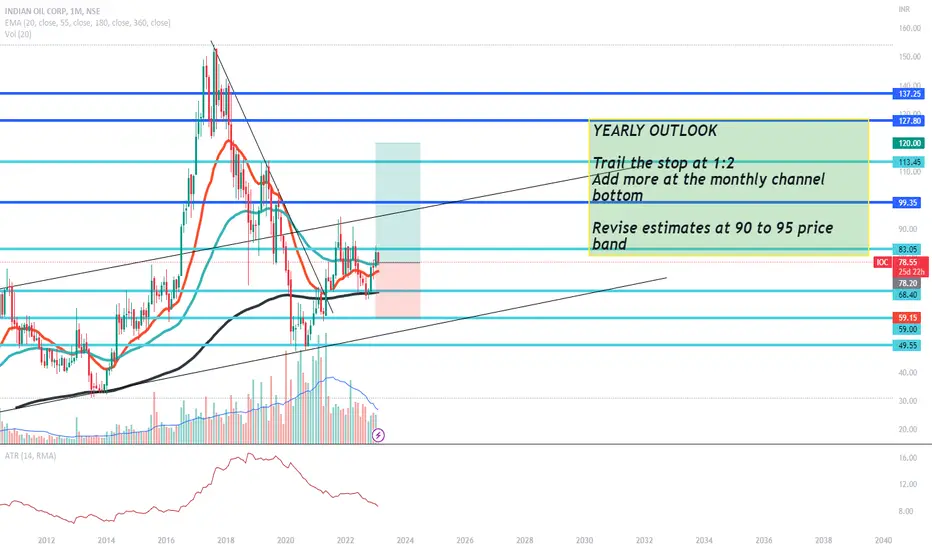
Yearly outlook - Long IOC
Resistance @ 99, 114
Support at 60
Revise targets in April, May and August 2023-25
Pros:
1)Reduction in GRM to increase the demand.
2)Green Initialtives to be housed in existing IOC franchises.
3)Stock is trading at 0.86 times its book value
4)Stock is providing a good dividend yield of 10.7%.
5)Company is expected to give good quarter
6)S/D Gap in EV value-chain
Cons:
1)Allocation of 30T Cr of funds to state-run OMC's to the requested 50T Cr.
2)Net Profit reduction of 87% QoQ
3)The comp
Gold is still bullishAs predicted earlier gold is on a bullish run which had a deep correction down to 1910. Price continues to trade above 1920 which will act as a pivot point for the current trading setup. sAME RISK MANAGEMENT HAS TO APPLY IN THIS SETUO AS WE TARGET A BULLISG=H TREND TOWARDS 1950 and 2000 Q1
TDPOWERSYSTEMS looking bullish, Good retest of trendlineTDPOWER SYSTEMS Daily had trendline breakout, now it has done good retest of trendline. Hammer formation. Good to buy at 134.50 for targets of 149,179 with sl below 125.
Good to add up to existing qty
TLong
Bullish Breakout in M&MM&M was traded within a range for long time and comfortably broke out the range today with huge volume .
Go Long for swing trade if opens and sustains for a 5min candle above 1380 or wait for retest to previous resistance 1367 price levels.
Target will be around 1420-1440
Happy Trading
DETAILED TECHNICAL ANALYSIS ON CAPLIN POINT LABORATORIES.Few pointers from my analysis on CAPLIN POINT LABORATORIES:
1. The stock has consolidated in the Triangular pattern and currently near its major support.
2. The major support trendline is near 0.382 Fibonacci level, thus has done healthy retracemet.
3. The Horizontal support is broken on the downside, however on lower volumes.
Conclusion:
The current setup is awaiting price confirmation by breakout of the resistance on Triangular pattern with high volumes and Breakout of RSI above 50. Overal
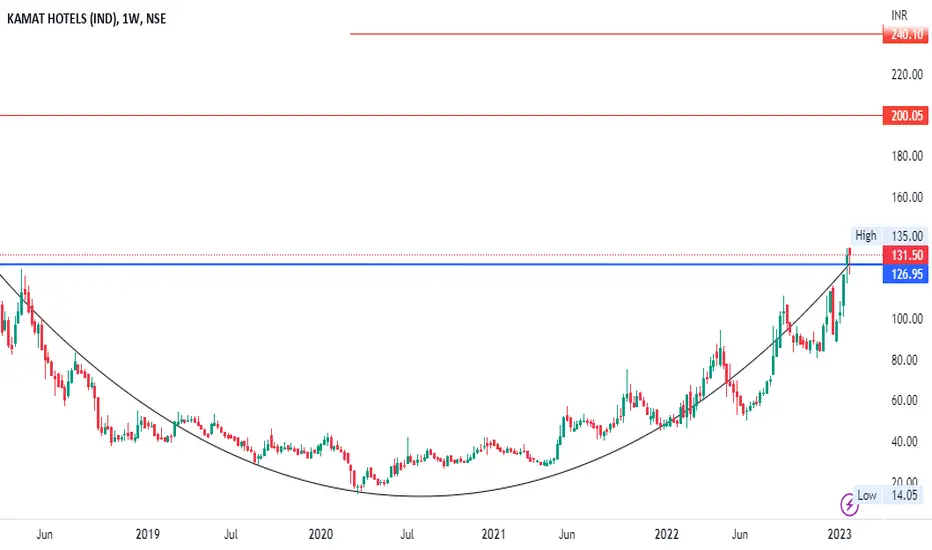
Kamat Hotels (I) Limited KAMATHOTEL:- Rounding bottom pattern has been formed, if the breakout sustains the upside, we may see upside movement.
Hello traders,
As always, simple and neat charts so everyone can understand and not make it too complicated.
rest details mentioned in the chart.
will be posting more such ideas like this. Until that, like share and follow :)
check my other ideas to get to know about all the successful trades based on price action.
Thanks,
Ajay.
keep learning and keep earning.
Chamanlal Setia Exports Ltd (CLSEL)Chamanlal Setia Exports Ltd (CLSEL)
Bullish on this stock. Even with so much of panic selling in the overall market Volume on the bearish candles are not so great.
Stock is in the uptrend.
Forming Hammer candle near 55 SMA level which is also 0.382% level of Fibonacci retracement which might be a sign of bounce back.
Target 1: 135
Target 2: 140
SL for a low-risk trader:- Just below the hammer candle i.e 124
SL for a risky trader:- Below the trend line i.e near 119
Disclaimer:- This is not
Shiba Inu-Double bottom retestingShiba Inu coin formed a double bottom pattern in 15m time frame.It is retesting now from the neckline(S1) and can give a upper breakout to R1.If the neckline breaks out with high volume candles,a long trade can be initiated.Support and resistances are marked on the chart.keep on eye on this trade.
Happy trading.
Possible Trend Breakout in SONACOMS???Stock has been consolidating from past one year after a giving a strong rally of more than 150%. On 25/01/23 stock has finally given breakout from its downtrend. Price level of 480-500 may act as immediate resistance for the stock. Major support lies between 400-410 in case price retraces in to previous channel. If price manages to close above this level, we can expect a decent rally in coming days. All the possible targets are marked on the chart. Maintain stop loss at 380.
About Fundamental
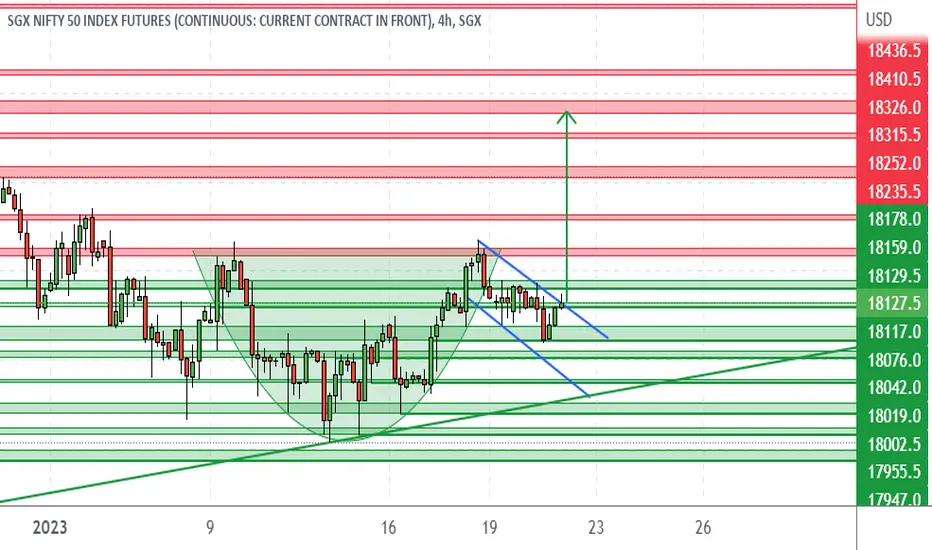
Singapore Nifty has Cup and Handle - 23-1-2023 Note: Always try to find a good #price action patterns or any #candle stick patterns in marked zones in smaller timeframe to take entry with small stop loss. Or can take entry based on one 5 min candle close below or above the zone with SL previous candles high or low (*try to avoid big candles) .
(Color code for #Support & Resistance zones: Red - Sell, Green - Buy, Price once cross above resistance it is obvious it will work as support, vis versa price cross below support zone ). Please unde