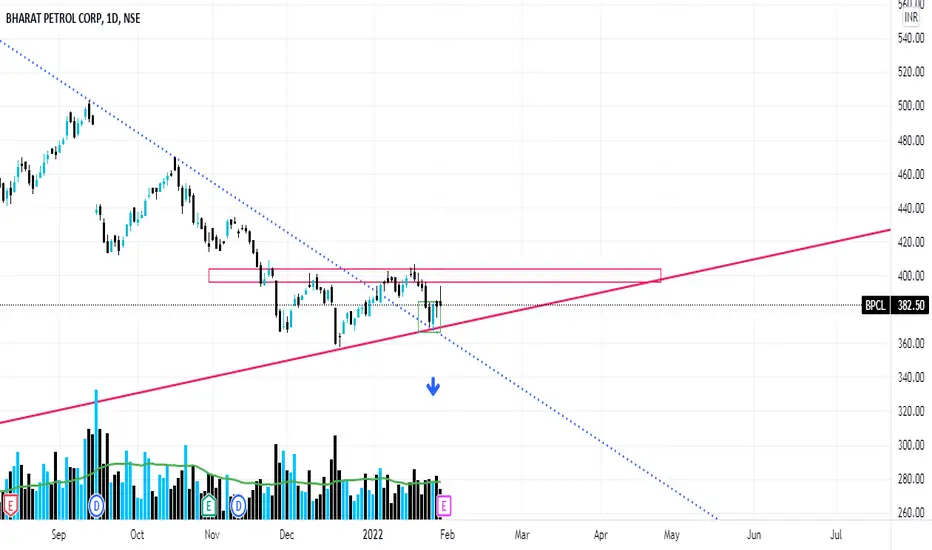
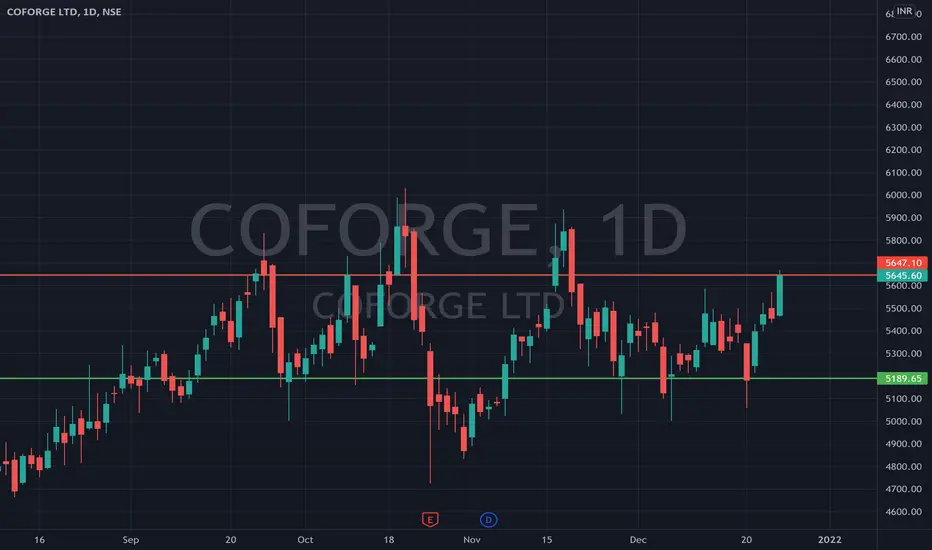
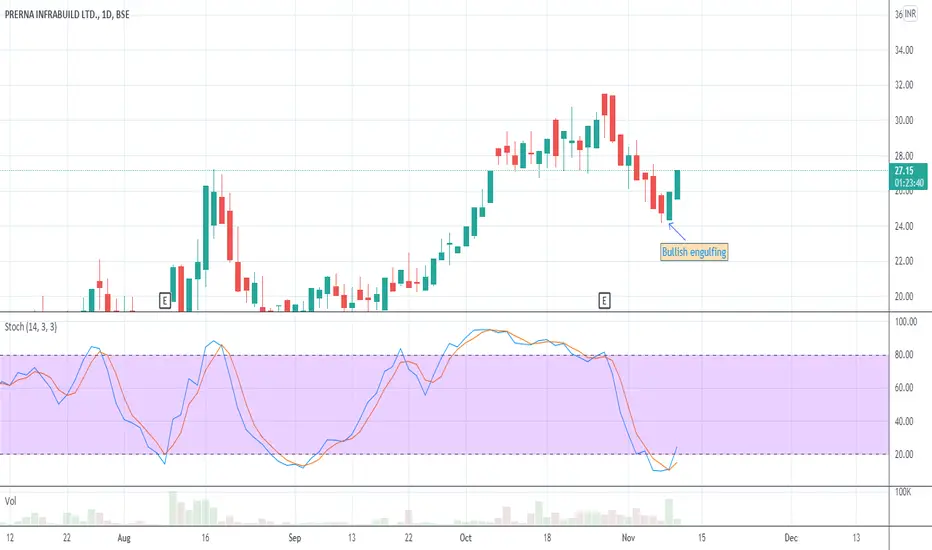
MOST RELIABLE CANDLESTICK PATTERN Pattern name: Bullish Engulfing
Pattern Type : Bullish Reversal
No. of Candles : 02
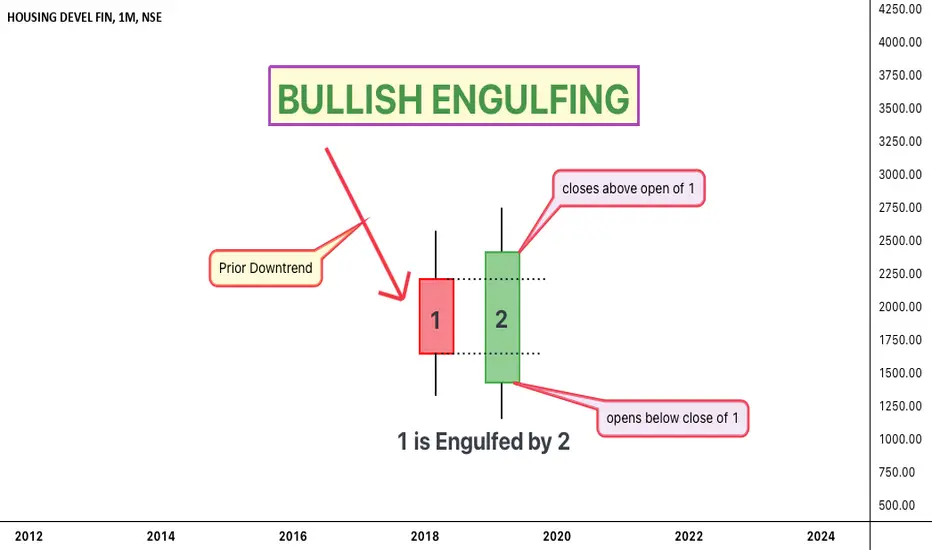
How to Identify it ?
1)There must be a preceding Downtrend.
2)A short Red candle followed by a long Green candle.
3)The Green candle should opens lower & closes higher than the Red candle.
4)The Red candle should be completely engulfed by the Green candle.
Psychology behind it :
1)The Bears lose momentum & the Bulls take charge and managed to close above the red candle.
2)It implies the bulls have fully ov
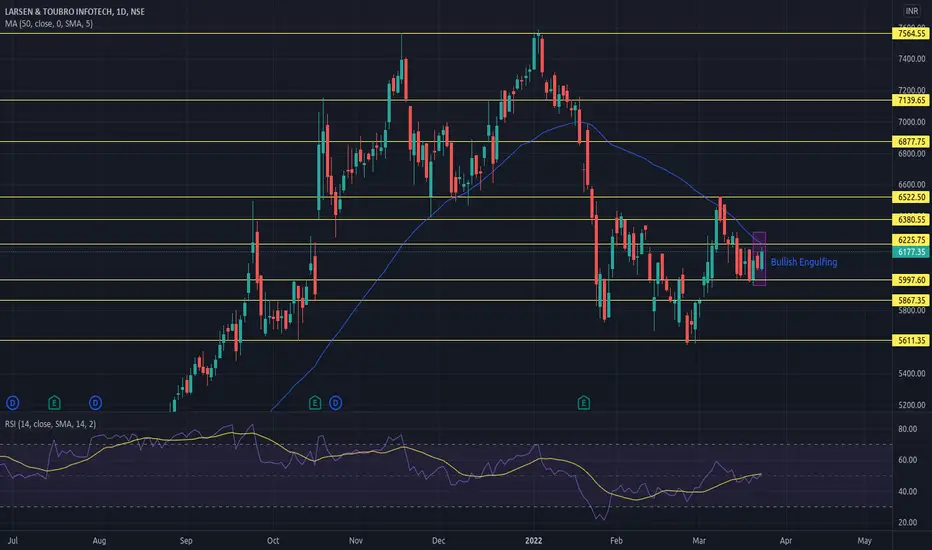
Bullish Engulfing
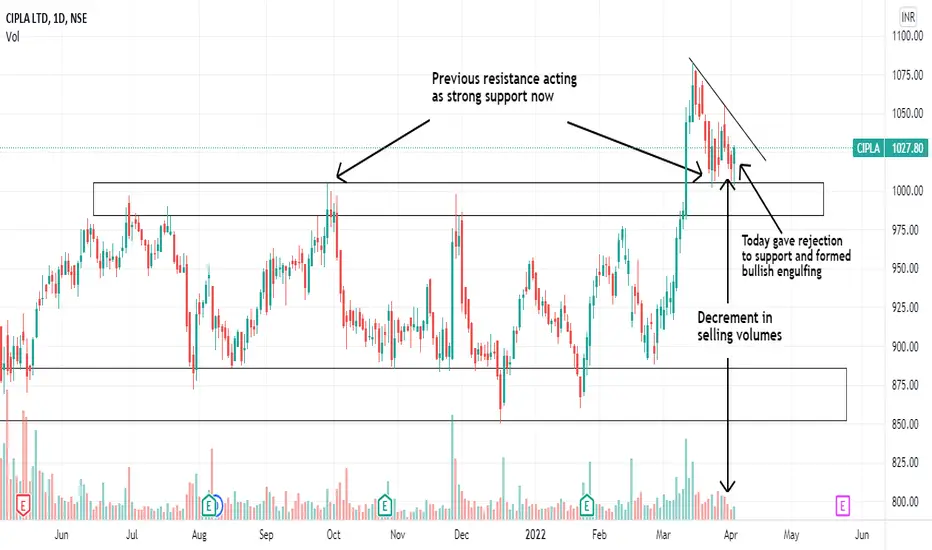
RANGE BREAKOUT DONE, READY TO MOVE ?This is daily timeframe.
Cipla was in consolidation in long range for 8+ months.
Finally it gave range breakout and retested its resistance zone,
which is acting as a strong support now.
Selling volume decreased in last three days of last week's.
Today it gave rejection to downtrend and had formed bullish engulfing.
May be now it will give a good upmove.
Let's keep close watch.
This post is for information purpose only.
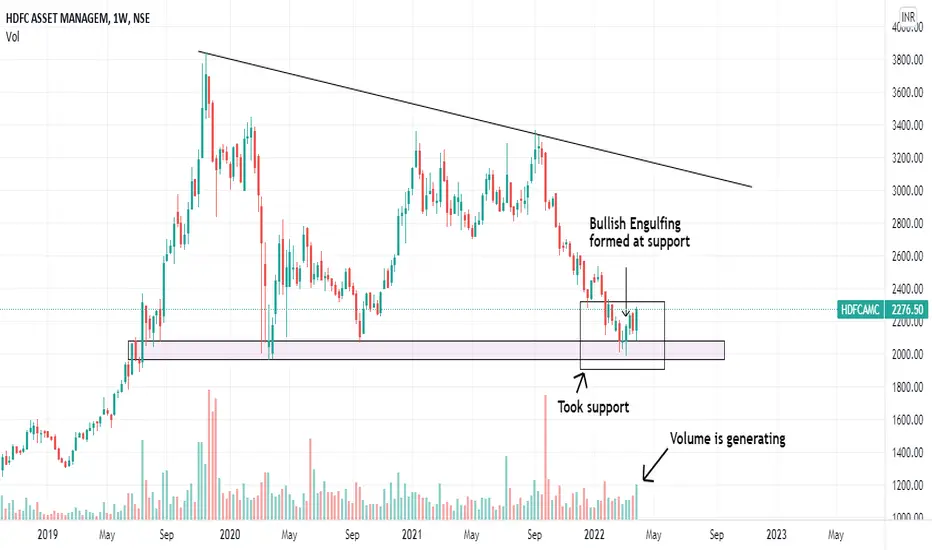
Trend Reversal ?HDFC AMC is showing signs of trend reveral on weekly timeframe.
Since 2019, it is taking support and had created a support zone of 1970-2080.
This may be the right time to enter for long term, but I'm not interested in it yet.
Till now company fundamentally good.
But my concern is that it has hammered multiple time to support zone. So my eyes are on upcoming financial results,
if results are good then it will be ok for me. It is looks good for short term swing trade.
It has also formed a bullish
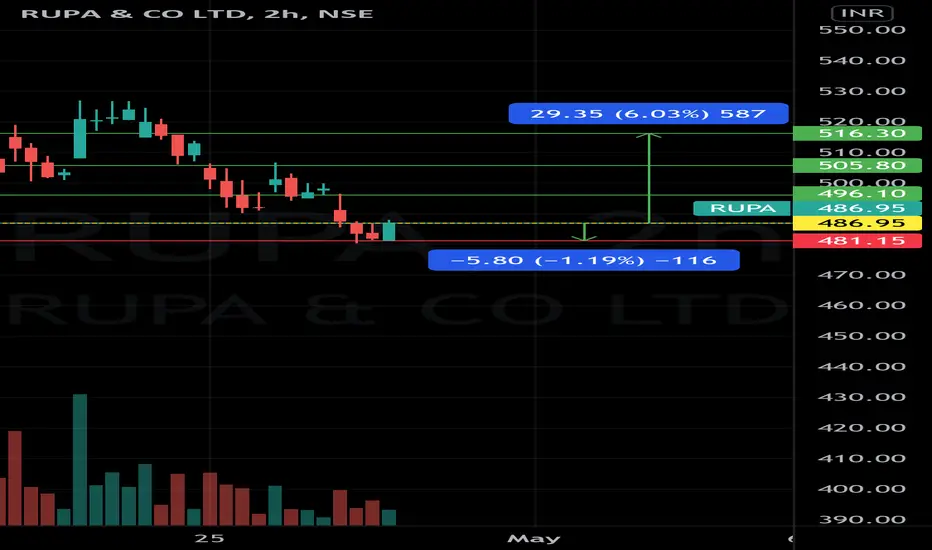
Expecting a Bullish Momentum in RUPAAs per the 2 Hour Chart of RUPA, we have witnessed the Formations of a “Bullish Engulfing” and a “Morning Star” Pattern on the downside levels.
Therefore, we are expecting to witness a bullish momentum in the stock in the upcoming trading sessions. Wherein, the stock is being expected to face a resistance initially at around the levels of 496.10, 505.80, and 516.30. Whereas, on the other hand, on the downside levels, the stock may face a support at the level of 481.15, on closing basis.
Closi
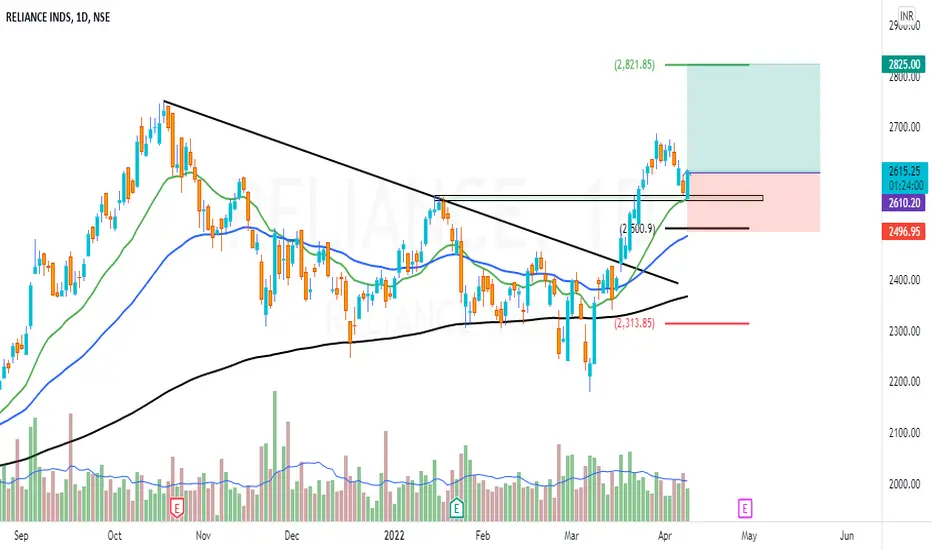
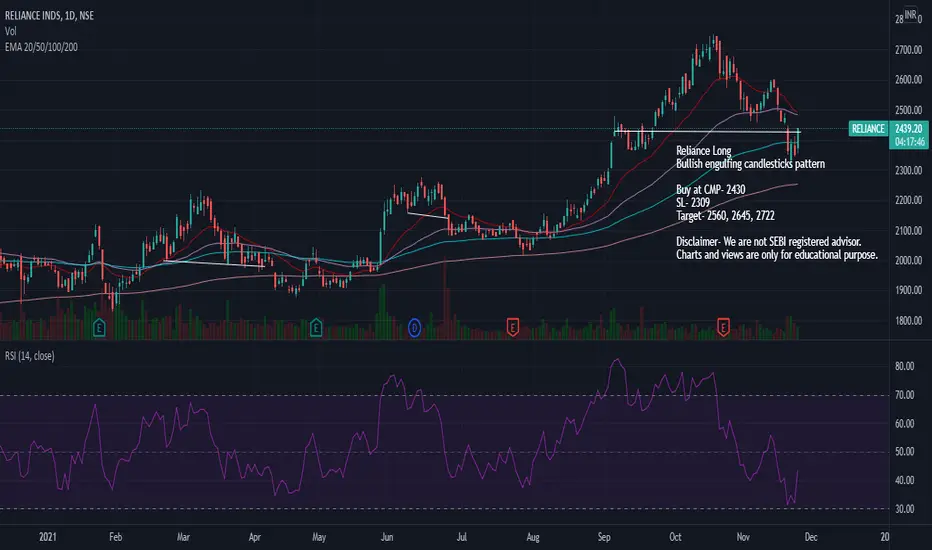
Swing Trade In Reliance.Reliance has been trending after the trendline breakout and now the price is taking support at previous high and 20 period EMA. Which is supported by a bullish engulfing candle. If the current candle closes above 2606 which is the high of previous candle, Entry can be done here and if it doesn't then wait for the closing above current day high. Stop loss should be below 2500 with a target of 2820.
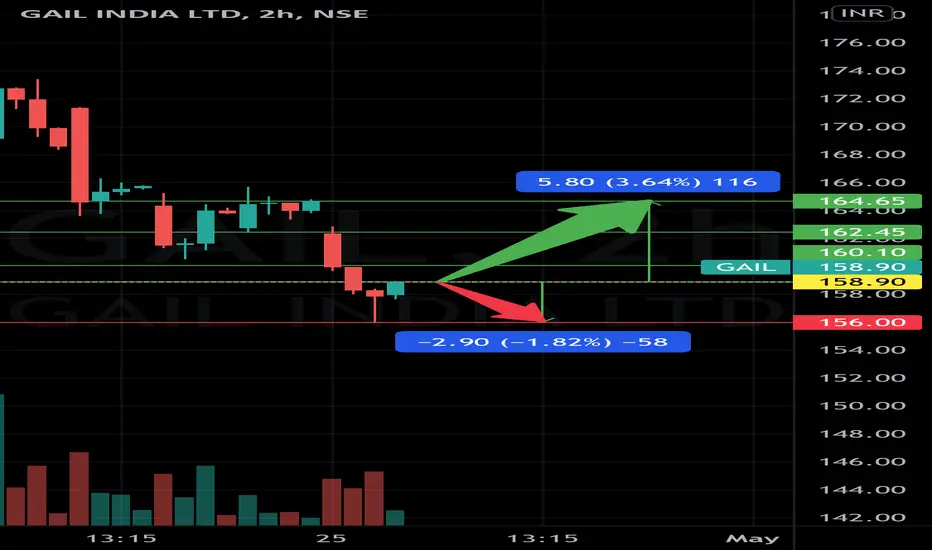
Expecting a Bullish Momentum in GAILAs per the 2 Hour Chart of GAIL, we have witnessed a Formation of a “Bullish Engulfing” Pattern on the downside levels.
Therefore, we are expecting to witness a bullish momentum in the stock in the upcoming trading sessions. Wherein, the stock is being expected to face a resistance initially at around the levels of 160.10, 162.45, and 164.65. Whereas, on the other hand, on the downside levels, the stock may face a support at the level of 156, on closing basis.
Closing Price (as on 25.04.22) :
Trend Change ?This is Monthly Timeframe.
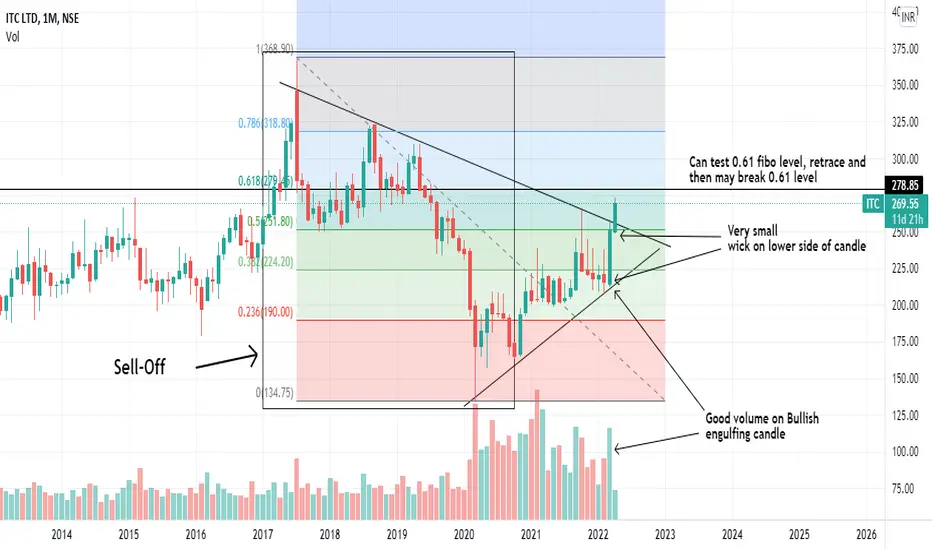
Finally ITC is showing some strength, sell-off started in July 2017 and
it fell more than 60% from it's all time high and made a bottom in March 2020.
And after that it started a retracement, but the retracement have crossed the 0.50 fibo level,
and now approaching the 0.60 fibo level,
that means it not a retracement anymore. It may be a trend change.
Last month it have formed a thick bullish engulfing candle with good volume.
It is showing strength in this month
LLong
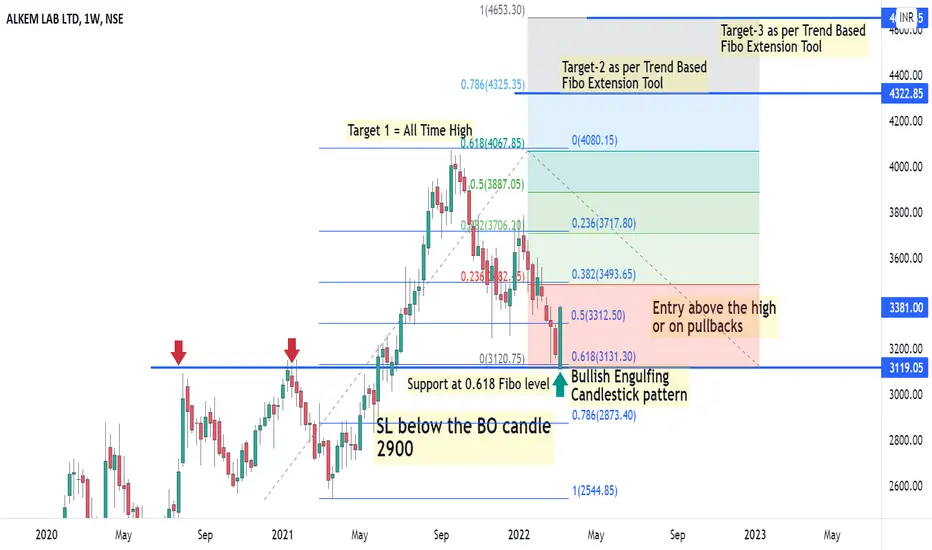
ALKEM - Retest & Reversal + Bullish Engulfing @Crucial level The analysis is done on weekly TF hence price may take few weeks to few months in order to reach the targets.
Trade setup is explained in image itself.
The above analysis is purely for educational purpose. Traders must do their own study & follow risk management before entering into any trade
Checkout my other ideas to understand how one can earn from stock markets with simple trade setups. Feel Free to comment below this or connect with me for any query or suggestion regarding this stock or P
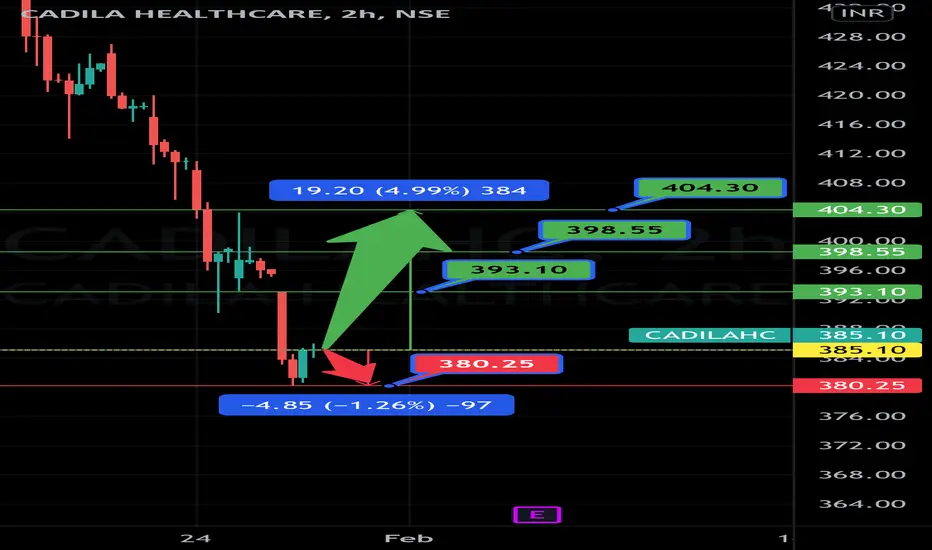
Expecting a Bullish Move in CADILAHCAs per the 2 Hour Chart of CADILAHC, we have witnessed the Formation of a “Bullish Engulfing” on the downside.
Therefore, we are expecting to witness a bullish momentum in the stock in the upcoming trading sessions. Wherein it is being expected to face a resistance initially at around the levels of 393.10, 398.55, and 404.30. Whereas, on the other hand, on the downside levels, the stock may face a support at the level of 380.25, on closing basis.
Closing Price (as on 27.01.22) : 385.10
Disc
CLong
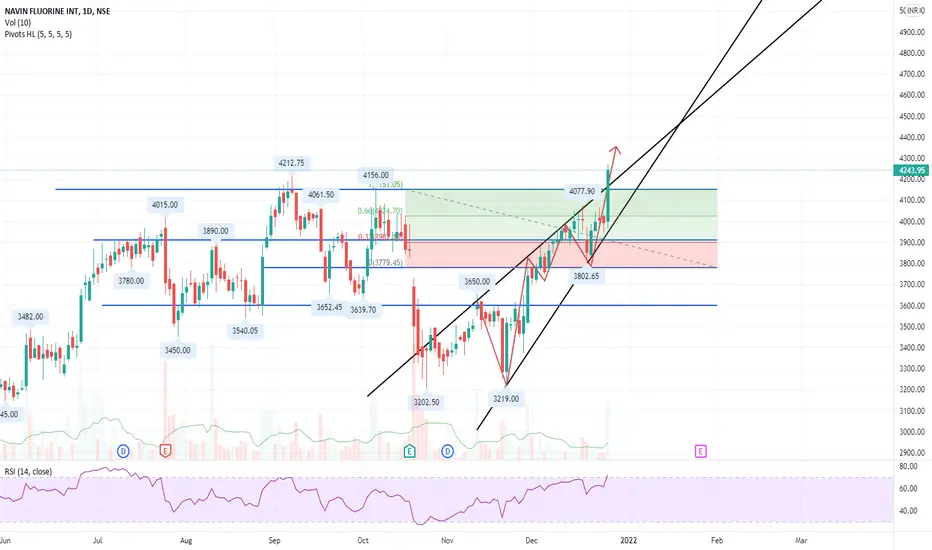
NAVINFLOUR - Strong Bullish Engulfingtoday in Navin Fluorine a strong bullish engulfing candle has formed.
tomorrow i.e. 12/27 there is a very high chances of the price to move upward.
also there seems like an ascending triangle formation which may help the price to move up.
-RSI crossing 70
-very high volume buying compared with 10 days average
-delivery remains low of 18%
-good for intraday or weekly trade.
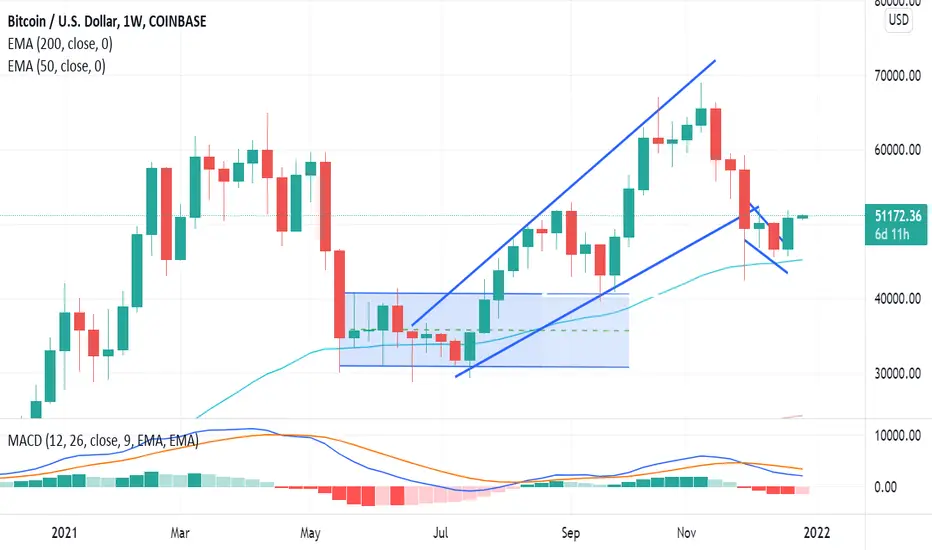
Weekly BTC-USD(27th December)After consolidating in the range of $46,000 to $50,000 from the last 15-20 days, BTC closed the last week on a positive note with ~8.81% gains. Other crypto assets also witnessed a positive week as the combined crypto market increased from $2.10 Tr to close the week at $2.395 Tr. BTC formed a strong weekly candle which slightly depicts further movement to the higher side that can be expected in the coming days.
As per the Daily TF, BTC is trading between its 200-DEMA and 50-DEMA for the last 4
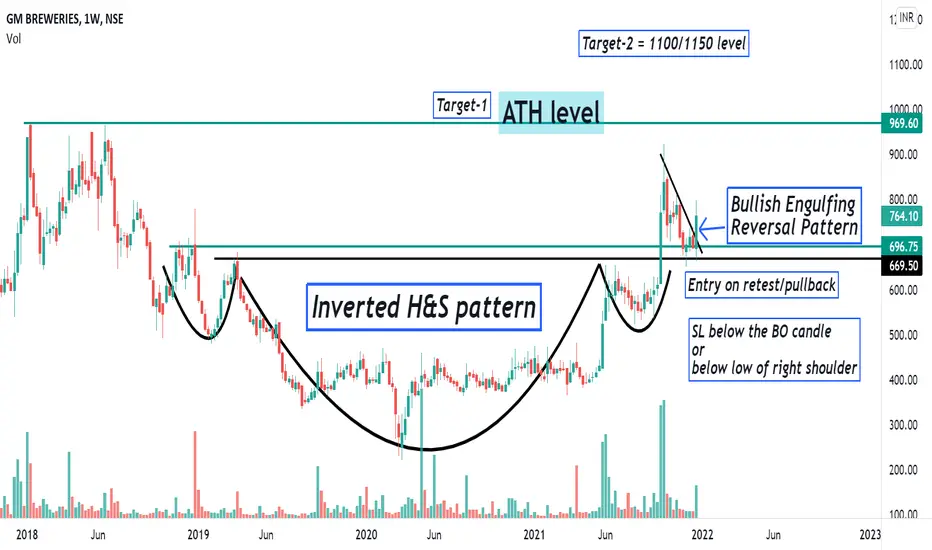
GMBREW - Bullish H&S + Bullish Engulfing pattern - Swing tradeThe analysis is done on weekly TF hence price may take few weeks to few months in order to reach the targets.
Trade setup is explained in image itself.
The above analysis is purely for educational purpose. Traders must do their own study & follow risk management before entering into any trade
Checkout my other ideas to understand how one can earn from stock markets with simple trade setups. Feel Free to comment below this or connect with me for any query or suggestion regarding this stock o
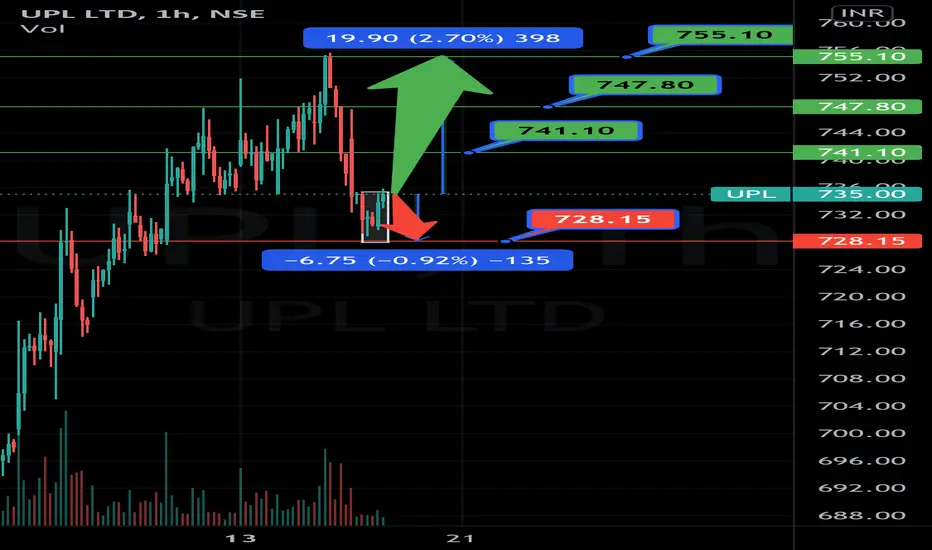
Expecting a Bullish Move in UPLOn the 1 Hour Chart of UPL LTD., we can witness a beautiful Formation of "Bullish Engulfing" on the downside levels. Therefore, we are expecting a bullish momentum in the stock in the upcoming trading sessions. Where the stock is being expected to face a resistance initially at around the levels of 741.10, 747.80, and 755.10. Whereas, on the other hand, on the downside levels, the stock may face a support at the level of 728.15, on closing basis. Closing Price (as on 16.12.21) : 735
Disclaimer
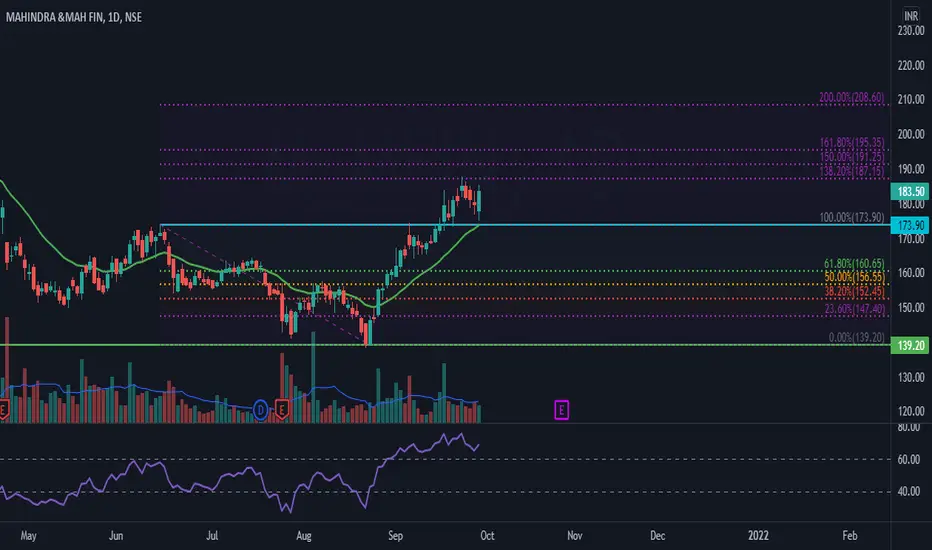
Pullback entry after breakout.After the breakout from a resistance of 170 zone, M&M FIn has entered to a new bullish territory, and is testing its previous resistance. Good signs are that a bullish engulfing candle has formed taking support of 20 EMA and RSI is also in bullish zone. Entry can be done from current levels till 173 with a SL of low of the breakout candle i.e. 171, hoping for an up move upto 200. targets can also be seen as per fibonacci levels. Any move below 165 will end its trend.
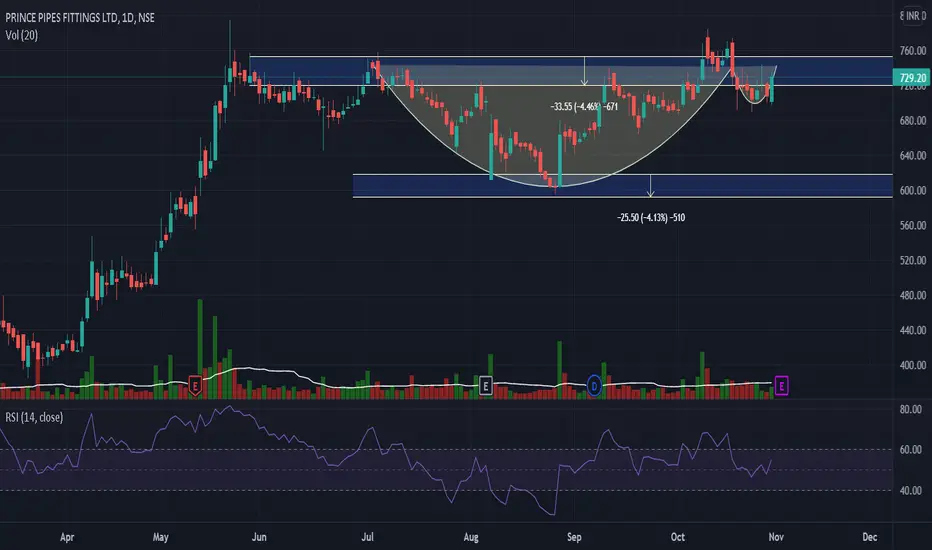
PrincePipe -- LongPrincepipe - Chart has formed congestion in the monthly timeframe, Cup & Handle in the daily timeframe, a bullish engulfing candle on 29th Oct Friday Closing, All this has formed with the Earnings Ahead. It' a good buy Crossing the current resistance range 741-754 with good volume .
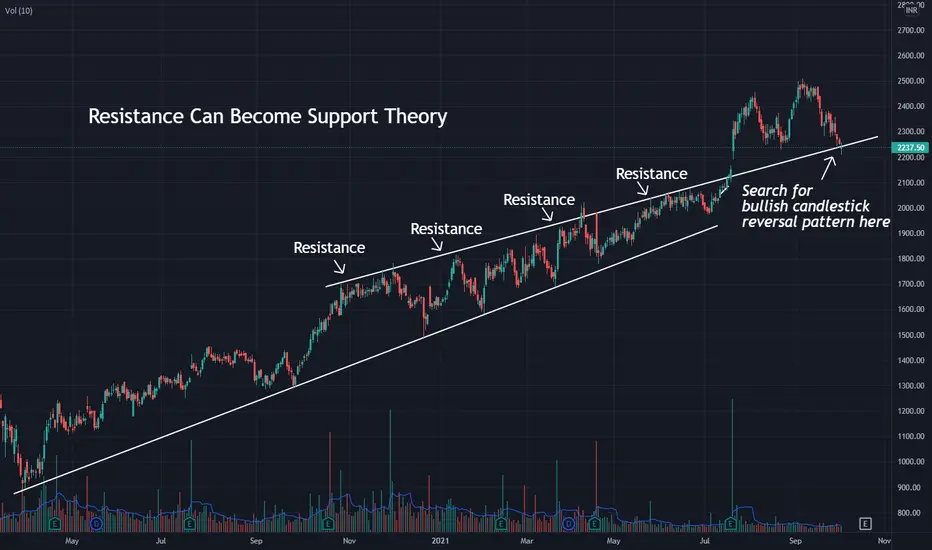
RESISTANCE CAN BECOME SUPPORT TOO !It is old theory of support and resistance that support can become resistance and vice versa. So if we apply that theory here on ACC , it can be a good entry as stock is near the resistance line.
All we need to do is look for a bullish reversal candlestick pattern.
Some of bullish reversal candlestick patterns are Morning star, Bullish engulfing , Hammer , Bullish Harami etc.
These type of entries are best because it provides us good Risk to Reward.
Target can be around 2428 levels , Which is go