 Long
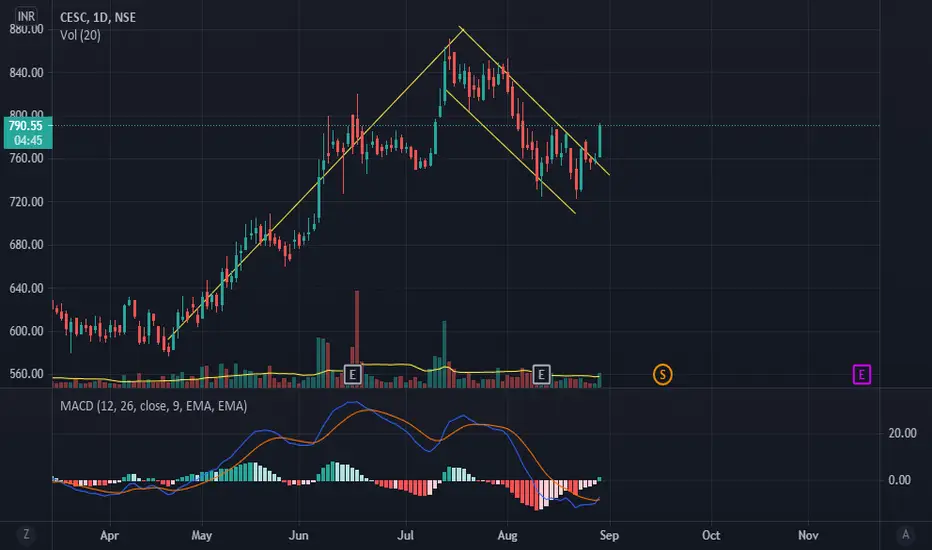
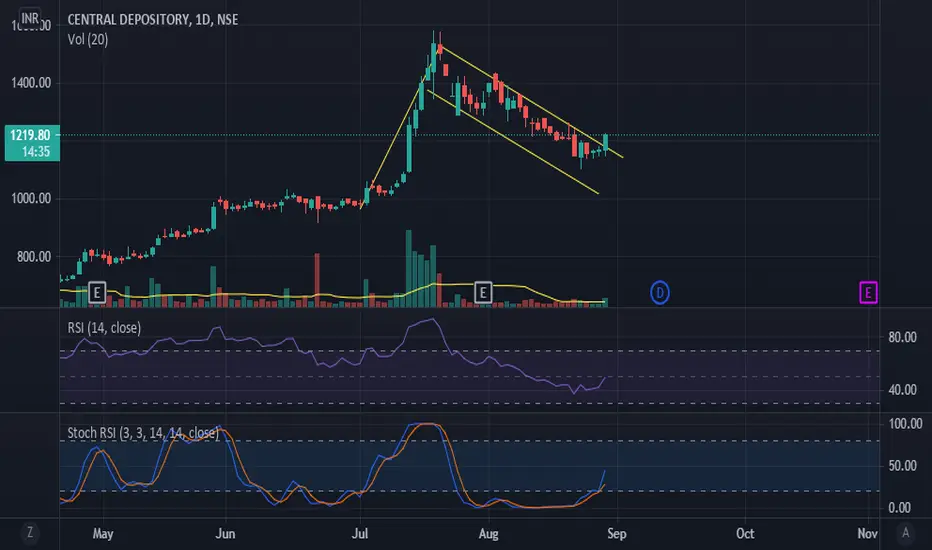
Bullish Flag
Long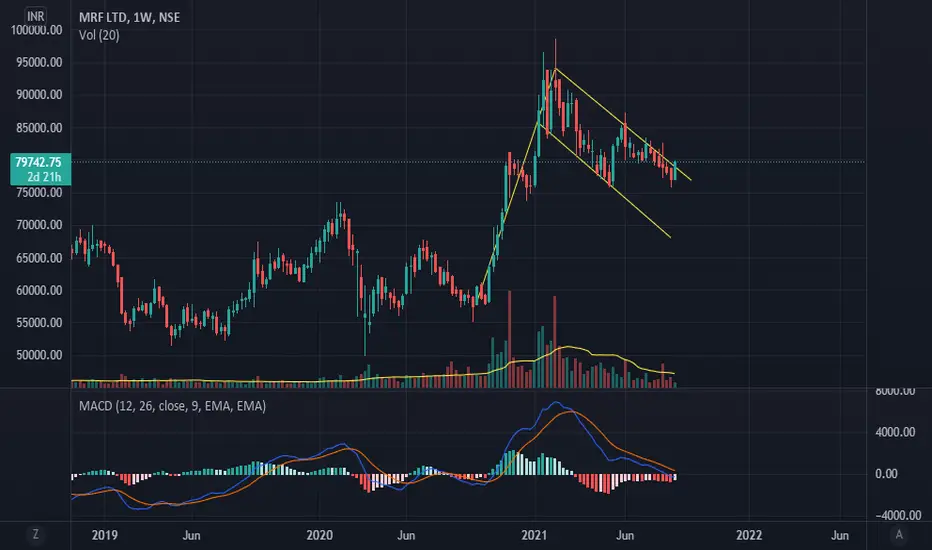
MLong

ALong

 Long

JLong

 Long
 Long
Apollo Hosp - Probable Swing Trade OpportunityIf the price breaks out above this bullish flag pattern, entry will be triggered.
Entry around 4870 (AFTER BREAKOUT)
SL of 4700/4600 zone (day close)
Targets of 5240, 5500+
PROBABILISTIC TRADE PLAN
Risk of 4%
Reward of 13%+
 Long

 Long
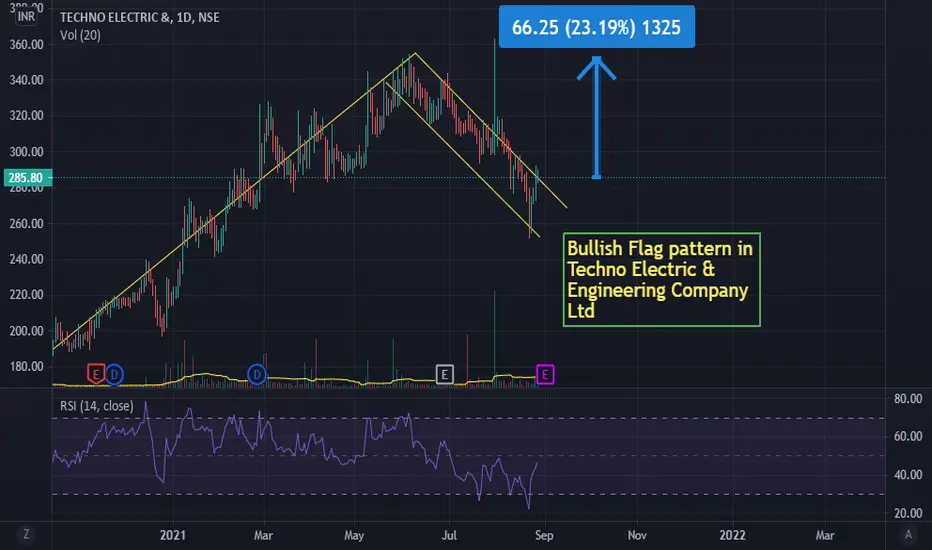
MAZDA LTD. Bullish flag breakout in MAZDA Ltd with high volume. Very good gain in short term possible.
 Long

Dixon Technologies Ltd.Bullish Flag pattern in Dixon Technologies Ltd. Good time to take long position for short term.
 Long

Venky's (india) LimitedBullish flag breakout in Venkey's (INDIA) Ltd. Good opportunity for short term gain.
 Long

 Long

 Long

 Long
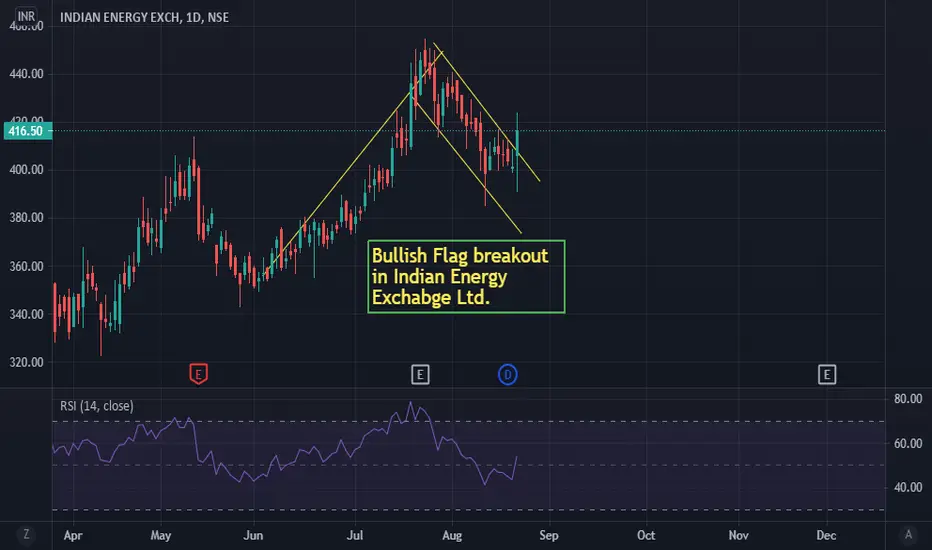
 Long

Adani Port Bullish Flag Pattern In this Idea, I talk about the Bullish flag pattern. Adani port consolidation on 30m time frem. we can take a good position and go for the long-term. keep patience wait for breakout and retest.


 Long
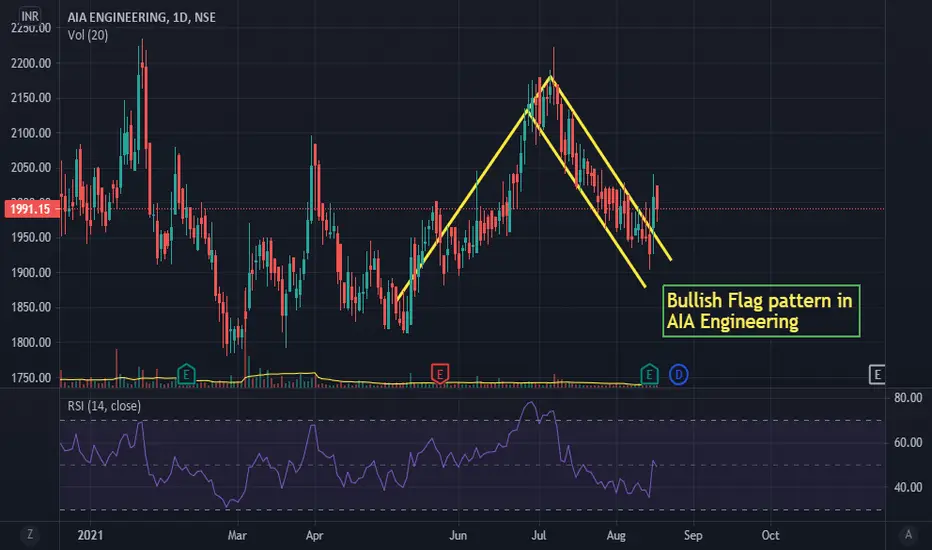
#TWT/USDT Chart Very Bullish!!!Hello guys if you want you can accumulate TWT under $0.70-$0.68, and after perfect retest of trendline we can expect very good bounce then our first target would be $0.767 and after that $0.9.


Bullish Flag pattern in NELCOWatch for flag breakout in NELCO. Monthly trendline resistance at the top.
 Long

Target Update on Tata Steel BSLWhat seemed as a Bullish Pennant at first has now formed a proper bull flag pattern. Refer to previous analysis(Link given):
Target Update
Entry = Rs 96+
T1 = Rs 110
T2 = Rs 121
T3 = Rs 138
T4 = Rs 150+
NSE:TATASTLBSL
BSE:TATASTLBSL
TLong

Bullish trade in NBCCOn week candle chart NBCC making Cup and handle pattern and on daily candle chart it is making buliish pennat pattern wait for breakout. NSE:NBCC
 Long

Bullish Flag PatternFlag Pattern is one of the most popular chart patterns, formed by price action, which is contained within a small rectangle or a channel in the shape of a flag. Flags are short-term continuation patterns that mark a small consolidation before the previous move resumes.
A flag chart pattern is formed when the market consolidates in a narrow range after a sharp move. Usually a breakout from the flag is in the form of continuation of the prior trend. Flags give very relatively small risk and high
 Education
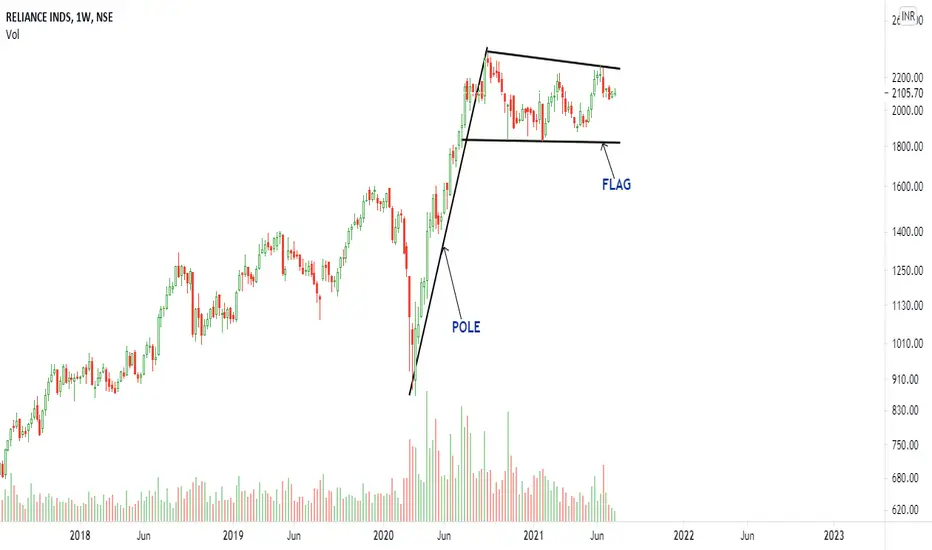
BULLISH FLAG PATTERN EXPLAINED.Bullish flags are a continuation pattern found in stocks with a strong uptrend. As can be observed, the pattern resembles a flag
on a pole. The vertical rise forms the pole and the following period of consolidation forms the flag. The flag can be a horizontal rectangle
but mostly angles down from the pole. The focus should be more on the underlying psychology of the pattern than the shape. Despite the
strong vertical rally, the stock refuses to drop much because the bulls are buying as many
GEducation
