ALong
Bullish Flag
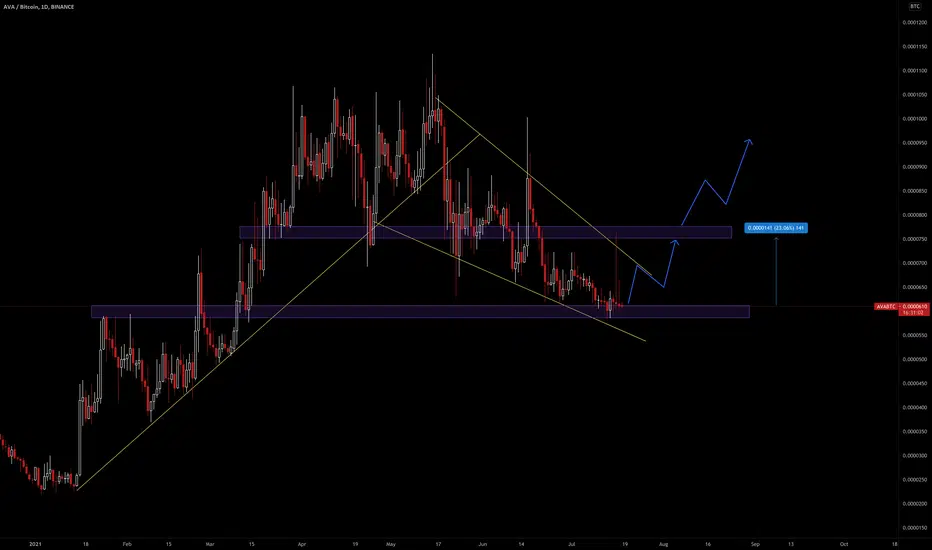
#PRAJIND keep on Radar, stock is making Bullish Flag Pattern.Strong bullish pattern, Proxy stock for ethanol blending
 Long

Trend Continuation PatternBullish Flag Chart Pattern: Tata Chemicals
Description:
The flag represents a brief pause in a dynamic market move & one of the requirements for a flag pattern is that it should proceed by a sharp and almost straight-line move.
It represents situations where a step advance or decline has gotten ahead of itself, and where the market pauses briefly to "catch its breath " before running off again in the same direction.
Construction of Flag & Pole pattern:
The flag resembles a parallelogram
 Education

Want 30% mover then watch this 10min video - Analysis made easy👑 Drop a follow here: @Averoy_Apoorv_Analysis 👑 ----------------------- 🔥🔥 Target: 2000 Followers 🔥🔥
👑 ITs a very good analysis video as I will try to trade this in realtime with you guys of course risk is diff for diff people but trading quality matters, not quantity :)
Good luck keep it in your watch now
⌛ Motivational and psychological area ⌛
✣Trade only if you are in the right mindset, if you have been emotionally weak for some time, take your time and don't trade, trade with a happy an
SLong

Granules has Broken out of Bullish Flag Pattern on Daily ChartGranules had been moving in a Downward Sloping Channel from December 2020
.It had a strong support at around 299-305 range and started to gain momentum the past few days and today it has broken above the upper trend line smartly with huge volumes and is near to another resistance zone at around 367-377.
It has to cross this zone to reach the following targets.
T1-ATH of 437
T2-475
 Long

Grab 5% in AUROPHARMA with your setup and my logic 👑 Drop a follow here: @Averoy_Apoorv_Analysis 👑 ----------------------- 🔥🔥 Target: 1000 Followers 🔥🔥
📌 Strategy: Beautiful and long consolidations like this are not only amazing but also tells the story of a mover in making.
🗝 Pattern here is a bullish flag pattern that too above an important level
🗝 The chart here is of the Daily time frame and breakout done at 1hr
🗝 Breakout gave on 1hr possible entry :)
🗝 The risk would be candles low ( daily candles low) - 951 and Target number one sh
 Long

 Long

NLC India - Flag pattern, Bullish formationNLC India is in a flag pattern with a consolidation zone, so give an entry with appropriate Stop loss after the breakout from the zone
🔴DISCLAIMER
***** It's just for an educational purpose and so you must also follow your own technical analysis before taking up the trade ******
Aggressive traders enter at the breakout and conservative traders may give entry after retracement (Retracement is optional, we cannot expect every stock to take a retest after the breakout, it may also continue to ha
 Long

Flag Pattern : Quess CorpBeing in Strong momentum for a long time Quess corp has given out a fresh continuous pattern of FLAG. Hopefully, this strong bullish trend will continue. Have a watch for break out from Flag pattern with high volume and RSI above 50 which shows buying interest.
 Long

Jindalsteel @ Fibonacci 61.8% support with flag pattern Jindal steel taking support near 61.8% fib level after rally
also forming a flag and pole pattern
if breaks upper range with volume then it will be a good buy
 Long

Tata steel on Flag breakoutTata steel forming flag & pole pattern & ready to breakout
also volumes are increasing, overall metal sector has given a
big rally and consolidated as well tata steel was leader that time
Long
Century Enka Bullish flag Seems like tried to break Resistance with good volume if price close above 427 We can go Long with good confirmation.
->> Always Enter With good confirmation & Maintain proper Risk Reward.
******* Knowledge Purpose only ********
->> Visit my Ideas Page for Daily Stock Analysis and check my previous stock analysis performance. I usually prefer Swing & Intraday Trades with Good Breakout confirmations and Best Risk Reward Stocks.
 Long

TCS ViewTCS has given a bullish candle with above average volume.
Breaking the inclined trend line will give good bullish targets
Long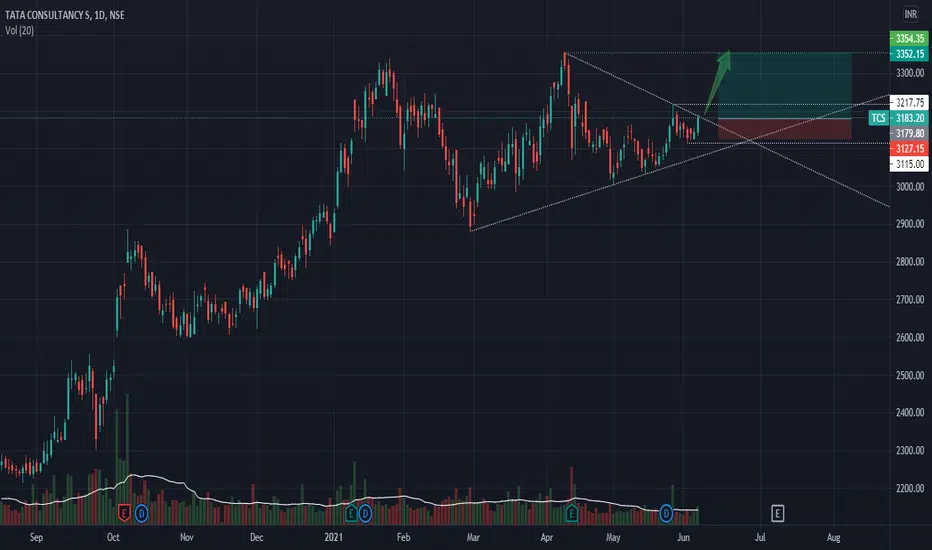
Dabur making Bullish Flag ?If 582 level will Break with Good Volume Confirmation and candle Close Above this Resistance Then We can buy for Swing Trade.
-> Always Enter With good confirmation & Maintain proper Risk Reward.
*******Knowledge Purpose only********
--->> Visit my Ideas Page for Daily Stock Analysis and check my previous stock analysis performance. I usually prefer Swing & Intraday Trades with Good Breakout confirmations and Best Risk Reward Stocks.
 Long

Can Reliance follow through after the flag breakout?NSE:RELIANCE has broken out of the flag pattern with above average volumes, but faces some weakness in crossing the 2220-2250 level, as is evident by the price action recently. With the AGM tomorrow, could RIL sustainably follow through after the flag breakout?
We've seen at least one flag breakout in the recent past (not pictured here) after which the broader rally resumed in full-swing. Could this be the start of something similar to that?
And in the past, AGMs have shown us a breakout or


 Long

Trap or Opportunity / Reliance Power"Wait for a Decisive Breakout"
Inverted Head and Shoulder / Large TF
Cup and Handel / Medium TF
Bullish Flag / Short TF
On the larger time frame, we have Head and Shoulder
On the medium time frame, we have Cup and Handel
On the shorter time frame, we have Bullish Flag
With Good volume activity
This trade is High Risk but has a good reward of up to 200%
Plane your trade accordingly (manage position sizing)
Have a nice trading day.
All the best and take care.
 Long

 Long

BANKNIFTYNSE:BANKNIFTY
⚪Buy between (34400-34800) or wait for the breakout to happen and buy after the breakout..
⚪SL below 33900
⚪Targets will be 36300 & 37500
🔴DISCLAIMER : This is just for educational purpose....
 Long

HEG VCP Trade. Pivot currently in progress.Disclaimer: This analysis is posted as my online journal for educational purposes only. This is not a buy call.
As you can see in HEG's chart above, it has risen 291% in 22 weeks and it has now experienced 3 tight contractions C1, C2, C3, with the C4 currently being in progress.
The C2 contraction was half of first, but the C3 was 18.5%. The last contraction C4 now ( the week just started today) seems to be forming in a less than 10% range. (Hopefully this tight range is maintained for the
 Long

JLong

 Long
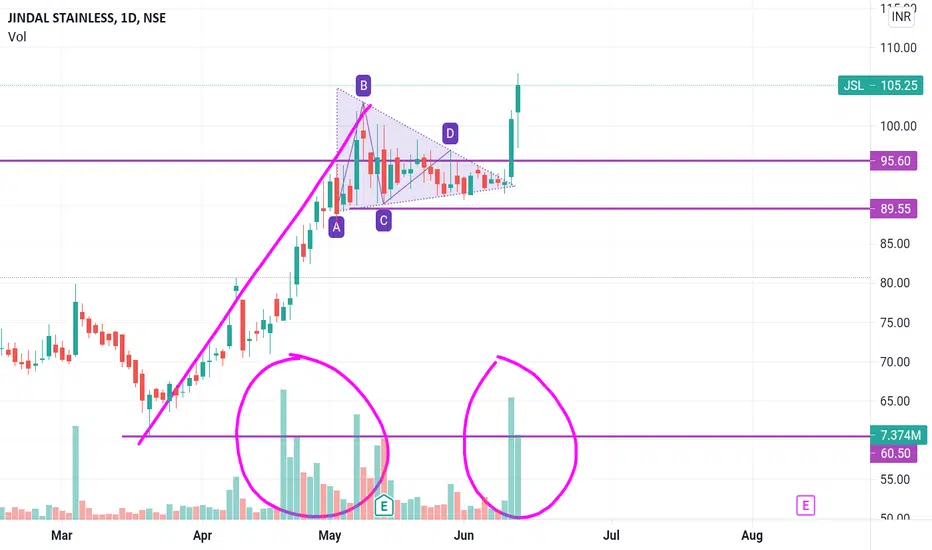
TATA COFFEE - Potential mover - Monthly viewPosted Days chart before this one :) go check if you want to see the clear pic :)
💲💲 FOLLOW me @Averoy_Apoorv_Analysis and get these free analysis :) 💲💲
🔰 {Some info}
➼My name is Apoorv and I am a 2nd year Engineering student, I want to pursue trading as my career, and thus whatsoever setups or trades I potentially see on my charting platform, I post it here and share them with you all.
➼I hope you will love my simple analysis style.
➼Feel free to suggest your view on this as learning is earnin
TLong

Will Orient Paper Target 39.50 ?Orient Paper NSE:ORIENTPPR has a good almost a text book like VCP in progress. ( who cares if its called by a Cup & handle name or any other ) the bias does seem highly biased to me on the upside.
Stock Shifting from Basing stage and likely to move to advancing stage. The past FIVE weeks price action is suggesting an upward bias. Average volumes are also higher indicating accumulation.
Overhead strong supply zones exist @ 30 to 31.20 above which the stock can have a good run. Remains to b
 Long
