Bullish Flag
NTPC | Bull FlagBullish Flag pattern spotted in NTPC . Pattern seems to be confirmed and hence the stock could move towards 148. Previous top at 137.5 can act as an intermediate resistance.
(Disclaimer: Our charts and contents are just for the purpose of analysis, learning and general discussion. Do not consider these as trading tips or investment ideas. Trading in Stocks, Futures and Options carry risk and is not suitable for every investor. Hence it is important to do your own analysis before making
Bullish Flag Brakout : Continuation PatternMRF TYRE Buy on Pull back at 57150 With SL Below 56900 For Target 61000
Or
Buy the 1st 30 Min Range Breakout On April Fool's Day. Keeping SL as 30 Min Low or as per your Risk Management.
Falling Wedge in Formation ? And if formed and Breakout, It's time to touch 200 SMA.
The 200 simple moving average ( SMA ) is considered a key indicator by traders and market analysts for determining the overall long-term trend. The price level in a market that coincides with the 200 SMA is recognized as
Titan Weekly Chart Bull Flag in PlayTitan Long TimeFrame Chart Shows Bull Flag. Stock is in Uptrend since Nov 2016 and Have formed a Bullish Flag pattern.
1000 Might be a tricky price zone which happens to be All time high(ATH). Once Broken with high volume, may lead to Price Discovery and New All time high.
Overall Titan looks bullish for long term.
Bullish Flag Breakout - Continuation Pattern - RR Ratio 1: 4.6Long sbin Above 288
stop-loss - 279.75
Target 324.70
Risk 2.78 % & Reward 12.84%
RR Ratio - 1: 4.62
Continuation Pattern
Bullish Flag
Bullish Flag chart pattern represents consolidation. This means that it occurs after a large movement in price. As such it’s also a continuation pattern, which means that the market is likely to continue in the same direction once the pattern gives a breakout.
Larsen & Toubro : Turbo Mode On !LT one of my favorite scrips, whether its intraday or positional this scrip performs really well (just my opinion,can be different exp for you ). Those who follow me for a while ( 6 months or so ) might be knowing about the Investment analysis we did on LT. We got it somewhere around 1100's I guess, now LT @ 1500's. Great Returns. Flashback over, back to reality...
Now we have bullish flag in LT, if we get proper breakout enter long positions with proper stops n target. If flag fails don't ente
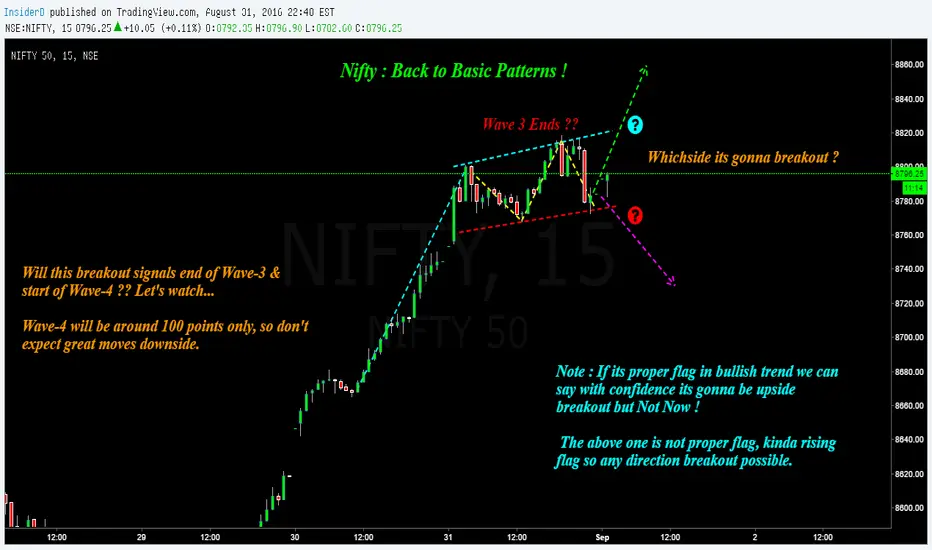
Nifty : Counting August Chickens after Hatching !Hi Friends, Let's Welcome September by counting hatched chickens of August ?
(1) Bearish Cypher - 80 points ( trailed stops)
(2) Bullish Cypher - Lost 15 points ( Broke the pattern straightaway)
(3) Bullish Gartley - 240 points ( Trailed stops aggressively & We caught wave-3 perfectly )
So whooping 305 points in few days..Great for Nifty I believe. But before going into calc's of for 305pts/10 days , then how much for month with patterns n all... Please realize the fact Nifty was kind enough t
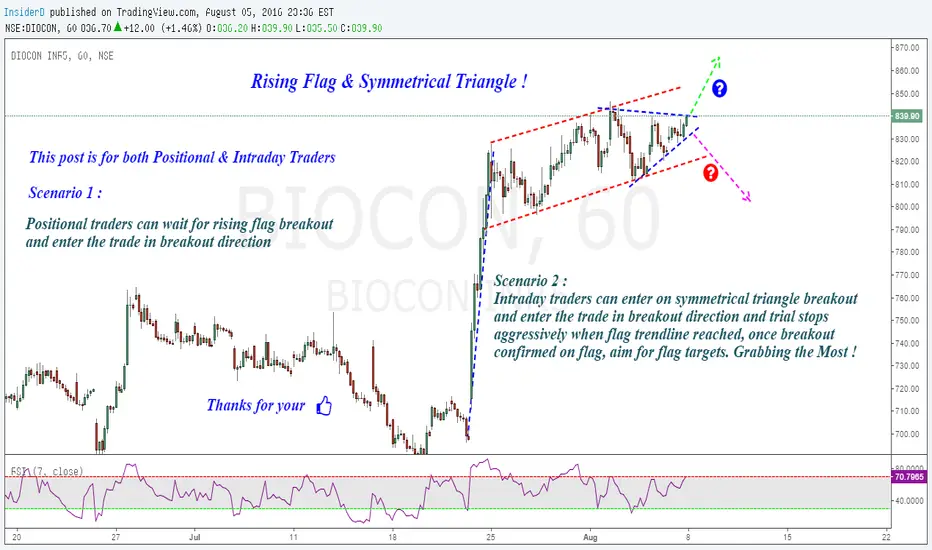
Biocon : Rising Flag & Symmetrical triangle Pattern within a pattern - yes it is ! So Biocon will be very good trade opportunity on Monday for both intraday and positional traders. Probably, positional traders have to wait for sometime as there is bit of distance between trendline and current price of Biocon. Its breakout patterns everywhere around the market, so choose and trade wisely.Lets expect next week to be as good as this week we had with Nifty,Ambuja cements& few others.
Hit Like button to keep me motivated to post more ide