Shiba Inu: Double Bottom at PCZ of Bullish GartleyWe have tow bottoms at the .786 retrace PCZ of this Bullish Gartley with the addition of Bullish Divergence and if it plays out Shiba Inu could go absolutely insane as it has historically except this time there would be a tremendous technical argument as to why it does rather than it just being for the memes.
Bullish Gartley
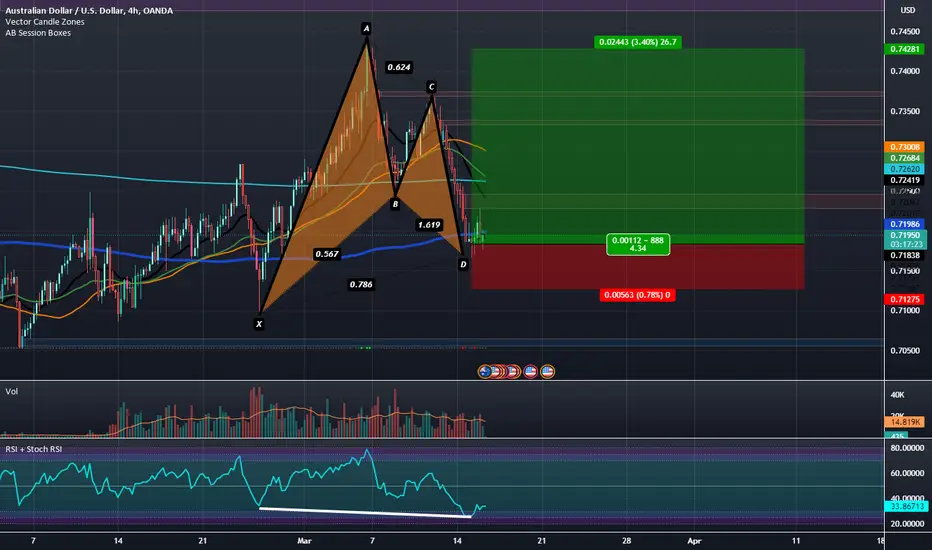
Potential Bullish Gartley on the NZDUSD 240Check out this potential bullish Gartley pattern on the NZDUSD 4H chart...
X to A impulse leg detected
A to B retraces beyond the 618 XA retracement but does not touch the 718
B to C leg extends beyond the 382 retracement of the A to B leg
Now just waiting for price to trigger us in at the 1272 extension of the A to B leg
Stop Loss is the 113 extension of the A to X leg
Take profit is at the 618 retracement from A to entry price
Thoughts?
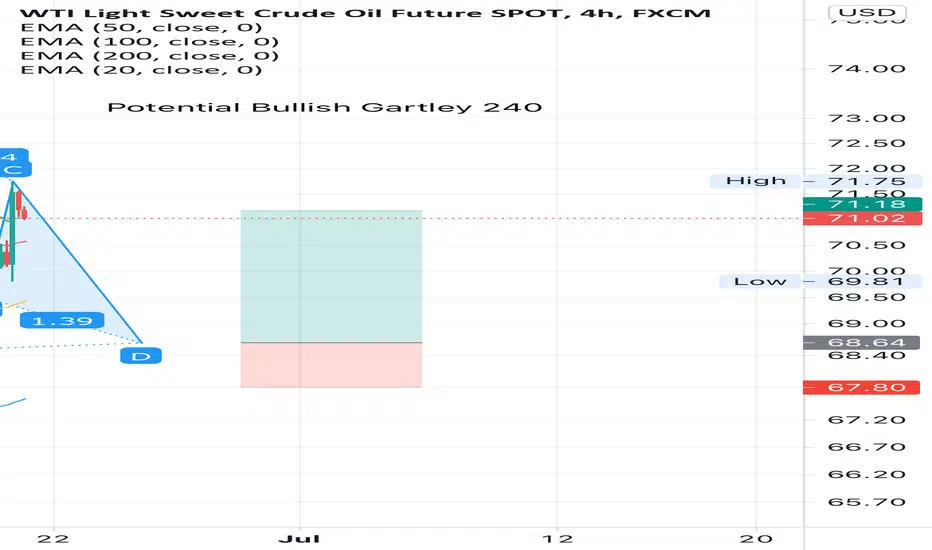
Potential Bullish Gartley on USOILSPOT 4HWhat does everyone think of this potential bullish Gartley?
WTI has been on a tear recently and seems to be entering a period of consolidation.
I don’t use fundamentals to trade but with the OPEC monthly meeting coming up I predict we’ll stay in consolidation until then, which could be good for this consolidation trade.
What are your thoughts?
Bullish Convergence on MACD and Hidden Bullish Divergence on RSIFTT has reacted to the PCZ of a Bullish Gartley on the Weekly and has since begun to develop Weekly Hidden Bullish Divergence on the RSI and tail end Weekly Bullish Convergence on the MACD that could take it up to the levels of $94-$100
Bullish Hartley in bank nifty IndiaA bullish gartley pattern formed in daily chart which makes the market to reverse from its direction, if we analysed using wave patterns a correction leads to the down trend; the reversal happened after the correction gets completed. The market will directed towards upward movement in coming days.
BLong
Bullish Gartley patternBullish Gartley Pattern:
It starts with a bullish XA move. AB is then bearish. BC is bullish, and CD is bearish again.
XA: This can be any price activity on the chart. There is no specific price movement in Gartley chart formation.
AB: The AB move should be approximately 61.8 % Fibonacci of XA and should not cross the starting point X. If it crosses X then the pattern becomes invalid.
BC: The BC move should finish between 38.2% and 88.6% Fibonacci of XA and should no cross point A. If it c
SEducation
The $SPY is Potentially Setting up for Another Short-term BounceToday on the 4HR Timeframe we went down Below the Demand Line of a Falling Wedge Channel but ultimately closed back within the Channel then Bullishly Engulfed at the PCZ of a Bullish Gartley on the close of the next candle. We also showed slight hints of Bullish Divergence on the MACD whilst this was going on. This looks to be pretty good for any Market Bulls out there in the short to midterm but i we aren't completely out of the woods yet as the Macro is still Bearish. I will be looking for a M
USDJPY-Weekly Market Analysis-Feb22,Wk4If you have read the previous post(the article is within the link to the related idea within TradingView), the Bearish Butterfly has already brought you 167pips(approx. 1,670USD/lot traded) of profit.
Should the market continue to fall and reach 114.58, it will be a Bullish Gartley Pattern for trend traders to hop on the trade for a buying opportunity.
However, if the market reverses from this point, you should be able to catch the Bearish Bat Pattern on the 1hourly chart.
EURUSD-Weekly Market Analysis-Feb22,Wk4If you had caught the Bullish Shark Pattern and Bearish 5-0Pattern congratulation to you. That's 100pips on each movement, which totals to 200pips(2,000USD/lot traded) if you traded both of them.
Some traders do trade Type2 Pattern, if that's you there will be 1 that is showing up, the Shark Pattern on the 4-hourly chart soon.
However, if that's not for you, there is a Bullish Gartley Pattern that is complete on the 1-hourly chart in the same region.
USDCAD - Bullish GartleyAs you can see there are 2 Harmonic Patterns that have the same potential of forming up. Although the Bearish Shark Pattern is about to complete, however, my trading bias is on the Bullish Gartley Pattern.
You may wonder, "Why the Gartley Pattern rather than the Shark Pattern that's going to complete?"
Well, the reason is simple, having the Bullish Gartley formed, it can create a trading combo on the 4-hourly Bullish Flag Pattern. Is that simple.
That gives me the lowest risk and highest retu
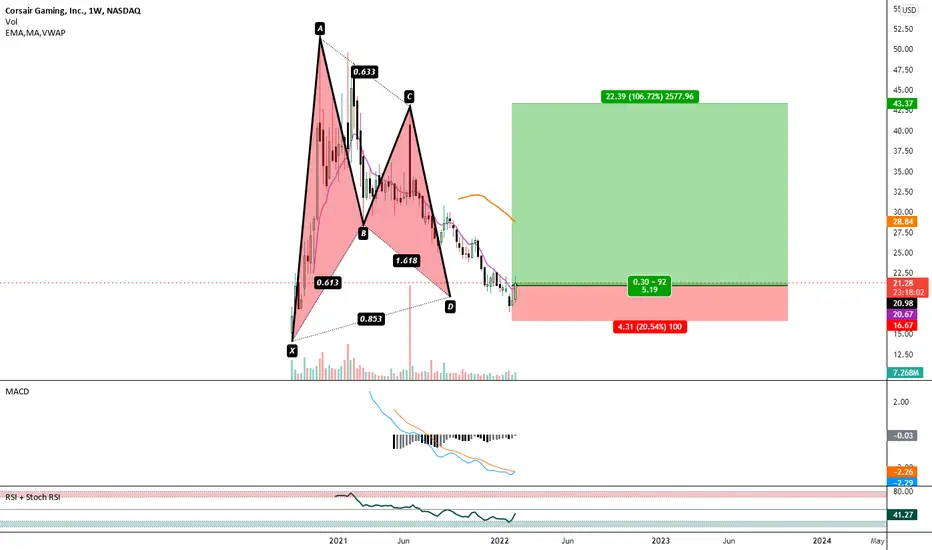
Morning Star at PCZ of Bullish Gartley Visible on WeeklyCorsair for it's entire life has shown nothing but Negative Momentum on the Weekly MACD but now only after hitting the PCZ of a Bullish Gartley has it decided to print a Bullish Candle Stick Pattern and show a Curling up in MACD Momentum; this may signal seller weakness and if this continues we will see the first bar of Positive MACD Momentum in the asset's Entire Lifetime, that may lead to a Climatic Rising in Price, perhaps all the way up to the $50s in the coming weeks.
USDJPY-Weekly Market Analysis-Feb22,Wk2USDJPY is at its consolidation phase. The overall setup tends to have a Bullish setup. On the 4-hourly chart, you can wait for a Bullish Gartley complete at 114.00.
If you are an intra-day trader, you can consider engaging the Bullish Flag trading opportunity within the 8 Range Bar chart.
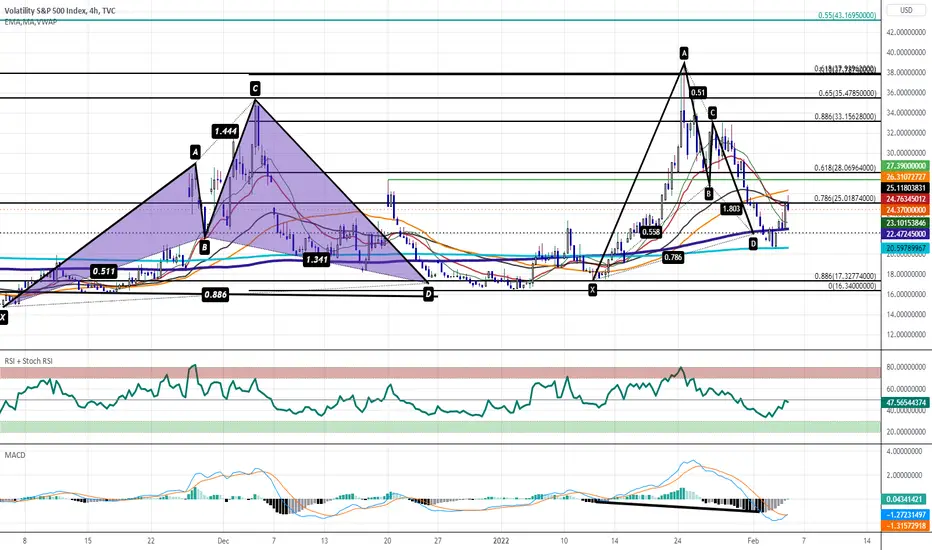
VIX Pump Part 3 Is Setting UpEver since breaking out of the falling wedge the VIX continues to put in higher lows at Harmonic Zones if the trendis to continue we should see the VIX run up to atleast $38 again as we have a Bullish Gartley with Hidden Bullish Divergence on the 4 Hour with the 200 and 800 MA holding us up here.
Monthly PCZ of Bullish Gartley Fastly ApproachesThis is an Update to a previous Idea i posted a couple weeks ago in which i expected GRT to give us a pullback from the top of a Parallel Channel as it was showing Hidden Bearish Divergence on the MACD and was near Deep Fibonacci Retracement levels. In that Idea i did hint towards a possible level that i felt GRT drop to and become Bullish at and now that GRT has gotten much closer to actually hitting the level i am posting the Bullish side of the trade.
For context of why i expected this pullb
Terra Luna: Bullish Gartley with Daily MACD Bullish DivergenceIt's a bit of a high flyer right now but it is nice that it's attempting to use old resistance as support, the 200 Day Moving Average is nearby, and that the MACD is beginning to Diverge.
I'd simply give it a shot here and cut my losses if i9t goes under the low of X.
LLong