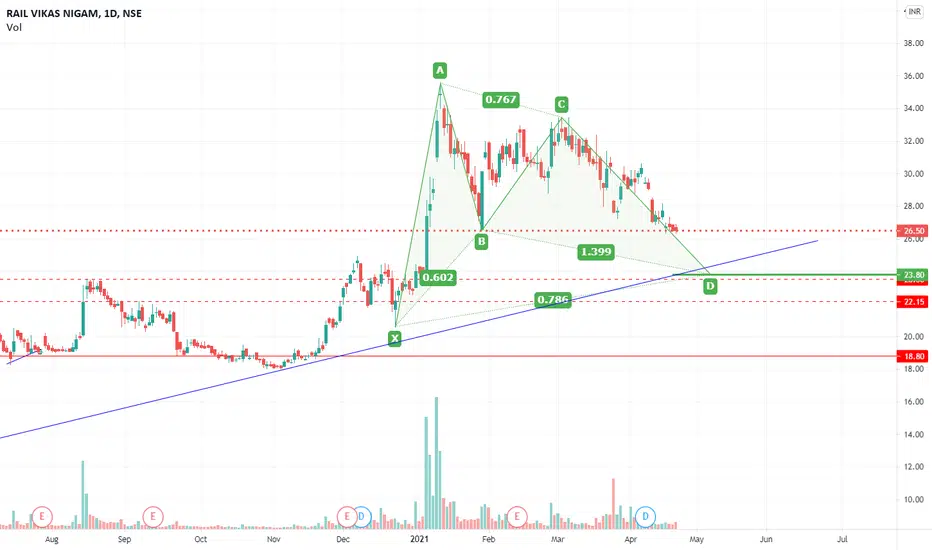
Bullish Gartley
NAVIN FLOURINEHello & welcome to this analysis
The H&S formation saw it complete its minimum breakdown of 1-1.27x Fibonacci extension.
Today in the daily time frame it completed the formation of a Bullish Harmonic Gartley suggesting a reversal from the current level (3900) for 4250 and 4400 as long as it does not go below 3800.
Happy Investing
BankNifty - Bullish Gartley from Bottoms at 38492Stoploss - 38531
Target
39000
39600
Bullish Gartley seems to be hiding in the price structure. If Index holds key level of 38531 & 38492 then we expect Index to push upside towards 39000 & 39600 in next few sessions.
Hope you did your due diligence at the tops of 41840's & enjoyed the tops from last idea. Check the related idea below.
Thank You
WaveTalks- Nifty: Bullish Gartley The fall from 18605 looks choppy & messy suggesting that the index could have finished a part of the corrective structure at 17799 lows @ 28th Oct2021 if holds above that level.
Bulls & Bears will be locking their horns between 18605 high & 17799 low – a range of Approx of 800 points.
---------------------------
Short Term Scenario
--------------------------
• Index can bounce upside. Reasons for bounce
• Harmonic Bullish Gartley PRZ (Potential Reversal Zone) 17799-17850
• Triangle B-D lin
HCL TechHCL Tech
Reasons/Traits :
• Bullish Gartley harmonic pattern is forming (gets confirmed if price goes and stays below 1254)
• Price below 13 EMA ready to touch 50 EMA
• Price is below 0.236 retracements levels
• RSI falling
What can happen next :
Scenario 1 : Price sustaining above 1265 levels can take it to 1285/1335/1365/1400 levels
Scenario 2 : Price break down below 1254 levels can take it down to 1227/1182/1135/1070/980 levels
Disclaimer : This analysis is only for educational purpose
WaveTalks- Nifty: Bullish Gartley PRZ 17450-17475 (Target-17740)H.M. Gartley's most trusted harmonic pattern - Bullish Gartley could be right there in the zone 17450-17475 which is assumed to be potential reversal zone.
-------------------------
Target
-------------------------
1st Target upside - 50 Period Moving Average = 17675
2nd Target upside- 17740 - where fall started on expiry day @ 30th Sep2021
------------------------------------------------
Stop Loss ( Avoid trading )
------------------------------------------------
As a trader you
WaveTalks - Nifty: Double Top at 17430 (7th Sep2021)Short Video connecting the path which unfolded for Index Nifty after Bullish Gartley at 17055 –last idea & upcoming moves to be expected with key & critical levels.
Thanks for watching the video
-------------------------------------------------------------------
Last Idea- 2nd Sep2021- Bullish Gartley at 17055
-------------------------------------------------------------------
Ashok Leyland At CmpBuy At cmp
Stop Loss 112.40(CLOSING BASIS)
HEY TRADERS,
THIS PREDICTION IS BASED ON A HARMONIC PATTERN AND THE HARMONIC PATTERN IS 100% ACCURATE AND10000% RISKY BECAUSE IT IS AGAINST THE TREND METHOD...
HOPE YOU ALL FIND SOME VALUE Here...SO, DON'T FORGET TO LIKE AND SHARE THIS POST. DON'T FORGET TO SUBSCRIBE.
COMMENTS WRITE DOWN BELOW OF THIS Chart...
THANK YOU...
~Disclaimer: "I Am Not Sebi Registered Advisor" All views and charts shared in
HDFCLIFEThis analysis is been done on 15 minutes TF. CMP 696 INR
A long position could be taken if 700 INR is crossed.
Once 700 INR is sustained the target is 710 / 721 INR, a resistance zone.
If the above resistance is taken out on upside then targets could be 729 / 734 / 744 INR
If the stock breaks down from the resistance zone, then it could take support at 714 INR or 726 INR
Please note that this analysis is based on my own study and experience in the market and it is strictly for educational pu
BORO ltd - low risk high reward🍁 boro ltd 🍁
buy @ 181
strict sl 178(risk 3 points)
trgt 195-205-218-254
jackpot (just risk 3 points may be get huge reward)✨✨
just study ,if u r ready to risk 3 points just enter.
lets wait
it's a multibagger one in my view(only my view)
💠forming descending triangle
💠180-79 range acting as a major support and if it fall below that level just exit okay,otherwise hold
💠superb q3 published.
maybe it hit my sl but no matter because i am ready to take that risk of 3 point
like🔰comment🔰s
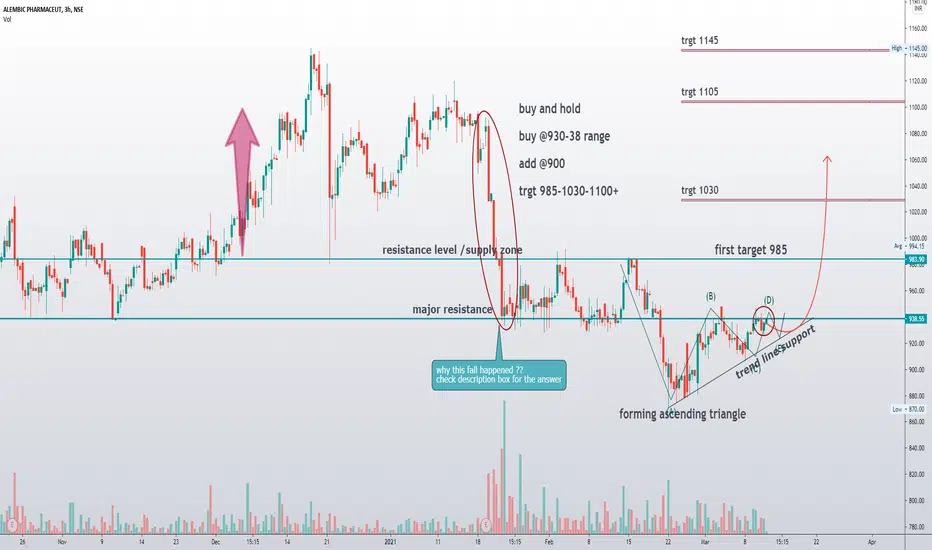
Alembic Pharmaceuticals ready for a launch✅buy and hold✅
buy @930-38 range
add @ 900
trgt 985-1030-1100+🎯🎯
(period 1-3 months)
why this fall happened ?
there are two major 2 reasons for this fall
first one
🔸profit booking in pharma sector
second one
🔸negative q3 result published.and it's advanced so its fell.
reasons for this buy
🔹anytime we can expect a ride in the stock
🔹chart looks promising
🔹forming ascending triangle
if u are interested in my charts
please 🙏
like🍁comment🍁support
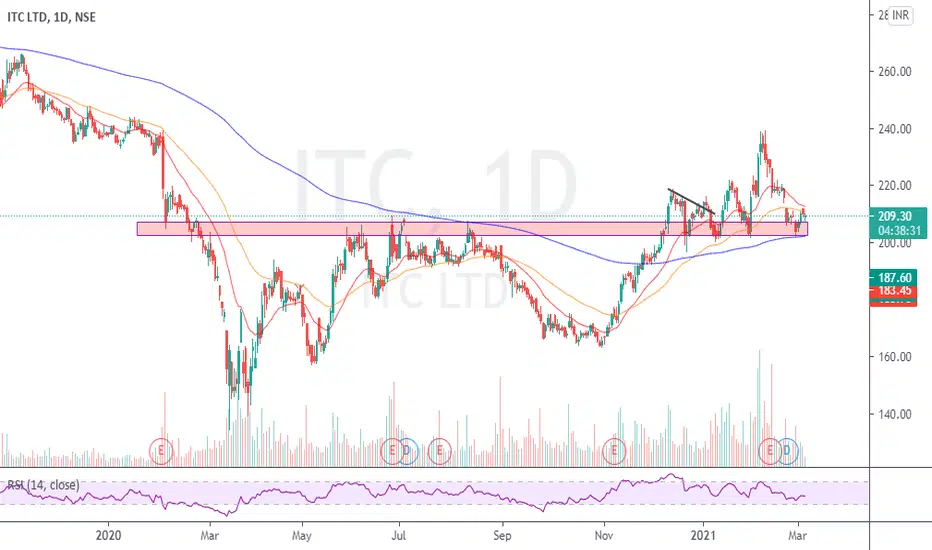
ITC: coming out to be potential long candidate with excellent RRITC is one among the controversial stock of 2020.
Everyone is seeing value in business & company prospects but same is missing in stock. There are many reasons and all are subjective to conclude it simply, its not retailers logic which move the stock and ITC case is best fit.
Technically ITC is sitting at excellent setup, MAY give good momentum as recent spikes are indicating there is buying force turning into ITC. My reason f posting this stock is excellent Risk to reward.
So CMP could be s