Alkyl Amines cmp 2052.70 Daily ChartAlkyl Amines cmp 2052.70 Daily Chart
- Support Zone 1700 to 1975 Price Band
- Resistance Zone 2100 to 2400 Price Band
- Volumes needed for fresh uptrend start out
- Falling Resistance Trendlines Breakout attempted
- Price is shouldering along Rising Support Trendline
- Cup & Handle followed by a small Rounding Bottom
Bullish Trend Line
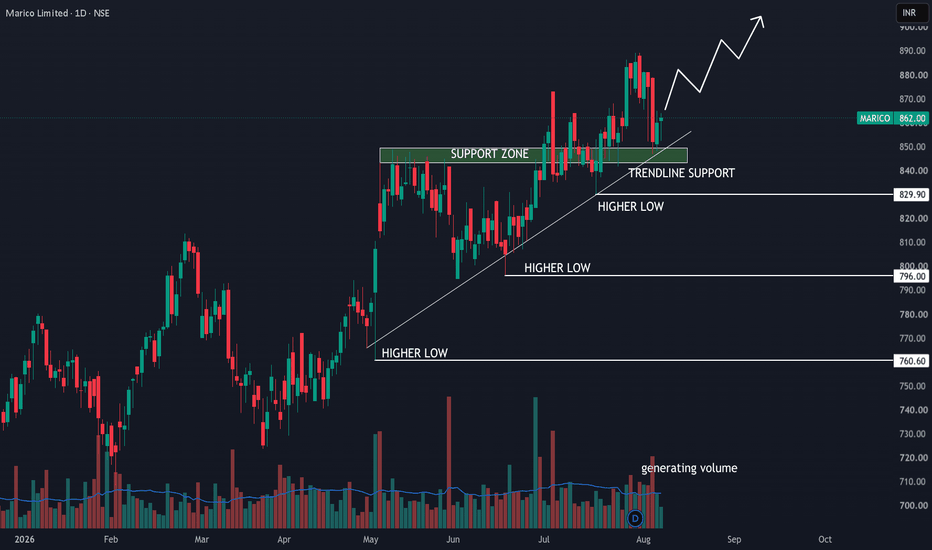
Marico - The silent bullish swingMarico Ltd. 1 Day chart
CMP: ₹862 : Bias: Bullish
Marico continues to maintain a strong bullish structure across higher time frames, supported by improving fundamentals, strong relative strength, and evidence of institutional accumulation.
Key Technical Setup
Daily & weekly structure remains bullish with higher highs and higher lows.
Price is consolidating around ₹858–₹868 after a strong upmove.
Immediate support zone: ₹850 - 840, followed by ₹820 - 830.
Immediate resistance: ₹875 followed by
IZMO: From ₹6 to ₹671 - What's Next? Chart of the MonthNSE:IZMO Why This ₹671 Unknown Indian AI Factory Stock Could Be the Next Multibagger in 2025? Let's analyze in the "Chart of the Month"
As per the Latest SEBI Mandate, this isn't a Trading/Investment RECOMMENDATION nor for Educational Purposes; it is just for Informational purposes only. The chart data used is 3 Months old, as Showing Live Chart Data is not allowed according to the New SEBI Mandate.
Disclaimer: "I am not a SEBI REGISTERED RESEARCH ANALYST AND INVESTMENT ADVISER."
This analys
Cupid Price ActionCupid Limited’s stock is trading around ₹158 as of early August 2025, having recently hit new record highs above ₹162. The share price surged over 45% in the past month and is up more than 100% year-to-date, significantly outperforming both its FMCG peers and the broader market. Volatility is high: daily moves of 5–6% are common, and intraday swings have reached as much as 8%. The stock is trading well above all major moving averages, reflecting strong buying momentum.
Long-term performance is
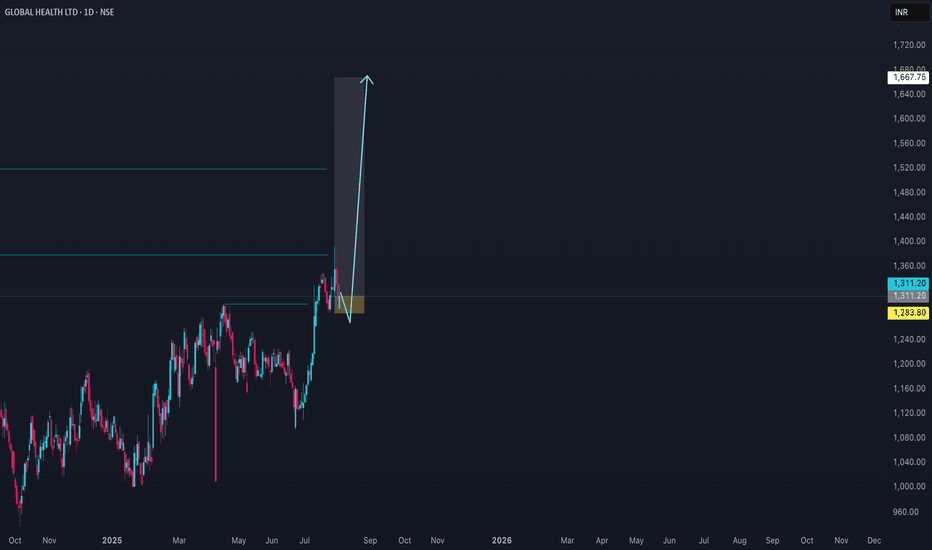
MEDANTA Price ActionMedanta (Global Health Ltd) is currently trading in the ₹1,300–₹1,335 range, having shown a notable run-up over the past six months, but with increased volatility in recent weeks. The stock reached a recent high near ₹1,393 and a low around ₹935 during the past year.
Fundamentally, Medanta continues to deliver robust revenue growth: annual revenues for FY25 rose to ₹3,692 crore, up approximately 13% from the previous year. Operating profitability remains strong, with margins in the 23% range an
Nifty 50 spot 25114 by Daily Chart view - Weekly UpdateNifty 50 spot 25114 by Daily Chart view - Weekly Update
- Rising Support Channel seems back in positive action mode
- Resistance Zone 24900 to 25150 of Nifty Index Breakout attempted
- Falling Resistance Trendline in place but Resistance Channel Breakout attempted
- Bearish Rounding Top pattern by the Resistance zone neckline to see breakout over the next week
- Bullish "W" with Double Bottom formed below Support Zone, seems instrumental for uptrend momentum
- Support Zone seen at 24450 to 2470
Bank Nifty spot 54809.30 by Daily Chart view - Weekly UpdateBank Nifty spot 54809.30 by Daily Chart view - Weekly Update
- Support Zone 53575 to 54175 for Bank Nifty Index
- Rising Support Channel seems back in positive action mode
- Resistance Zone 54975 to 55575 of Bank Nifty Index may act as a strong barrier to cross
- Minor Gap Down Opening of Tuesday would get closure soon, probably over the next week
- Earlier Resistance Zone now seems like getting in the Support Zone role by this weeks closure
JSW Infra cmp 312 by Weekly Chart view since listedJSW Infra cmp 312 by Weekly Chart view since listed
- Support Zone 285 to 300 Price Band
- Resistance Zone 318 to 333 Price Band
- Bullish Rounding Bottoms repeated under the Resistance Zone neckline
- Stock making Higher High Lower High pattern within up-trending price channel momentum
- Stock traversing within Rising Support + Price Channel and attempting Falling Resistance + Price Channel Breakout
Goldiam International cmp 396.60 as seen by the Daily Chart viewGoldiam International cmp 396.60 as seen by the Daily Chart view
- Support Zone 362 to 386 Price Band
- Resistance Zone 425 to 455 Price Band
- Bullish "W" with Double Bottom formed at 340 price level
- Breakout attempted from Curved Falling Resistance Trendline
- Price momentum has well respected the Rising Support Trendline
- Volumes spiking above avg traded quantity over the past few weeks
- Multiple Bullish Rounding Bottoms formed around Support Zone neckline
- Majority of common Technical
Balmer Lawrie cmp 224.11 by Daily Chart viewBalmer Lawrie cmp 224.11 by Daily Chart view
- Support Zone 203 to 215 Price Band
- Resistance Zone 203 to 215 Price Band
- Multiple Bullish Rounding Bottoms around Support Zone
- Both Falling Resistance Trendlines Breakout seems sustained
- Heavy Volumes surge on Friday post close sync with avg traded qty
- Upwards Price momentum has well respected the Rising Support Trendline
- [ b]*Inside Bar made on Friday closure, indicates observing caution either a Breakout or Breakdown*
Umiya Buildcon cmp 83.75 by Daily Chart view since listedUmiya Buildcon cmp 83.75 by Daily Chart view since listed
- Support Zone 79 to 81 Price Band
- Resistance Zone 85 to 87 then ATH 90.24
- Symmetrical Triangle Breakout is attempted
- Volumes are in close sync with average traded quantity
- Darvas Box setup Stock trading inside 77 to 84 price range
- Rising Support Price Channel well respected from ATL 56.81 price level
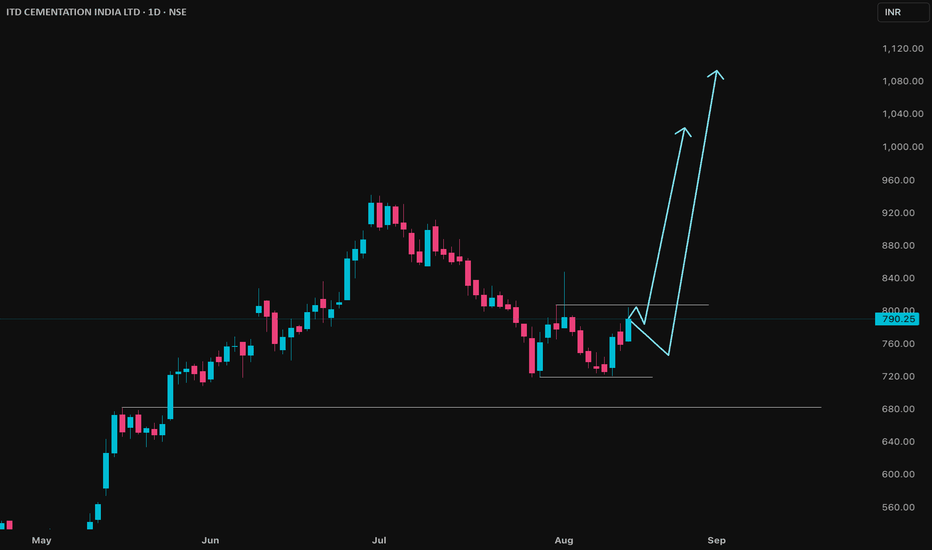
ITDCEM Price Action## ITD Cementation India Limited (ITDCEM) Price Analysis (August 2025)
### Price & Market Metrics
- **Current share price:** Around ₹793 (NSE, August 13, 2025).
- **Market capitalization:** Approximately ₹13,622 crore.
- **52-week range:** ₹467 (low) to ₹944 (high).
- **Day's trading range:** ₹762–₹804.
- **Recent price change:** Up about 4.5% on the day.
- **Average volumes:** About 762,000 shares traded daily in recent periods.
### Returns & Volatility
- The stock has seen a strong rebound f
Gopal Snacks Ltd Price ActionGopal Snacks Ltd’s share price is around ₹359.5 as of August 3, 2025. Over the past year, the stock has shown only a modest increase (up about 1%), with greater strength seen in the last six months (up 7%). The 52-week range is broad, with a high near ₹520 and a low around ₹253, indicating significant volatility. Average daily trade volumes have also risen, supporting liquidity.
The company’s financial performance for FY25 shows total revenue at approximately ₹1,474 crore, a slight rise over FY
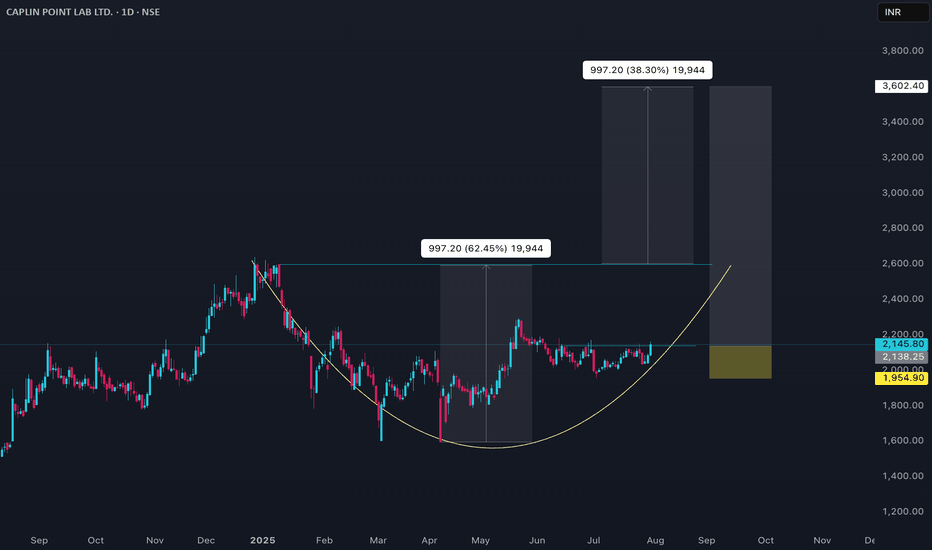
CAPLIPOINT Price ActionAs of July 31, 2025, Caplin Point Laboratories Ltd (CAPLIPOINT) is trading near ₹2,085, showing a mixed but steady performance with some recent price fluctuations around this level. The stock briefly touched intraday highs around ₹2,095 and lows near ₹2,030, maintaining support in the ₹2,030–₹2,055 range. Market capitalization stands broadly near ₹15,590 crore.
Caplin Point benefits from solid fundamentals in the pharmaceutical sector, supported by consistent revenue growth and operational effi
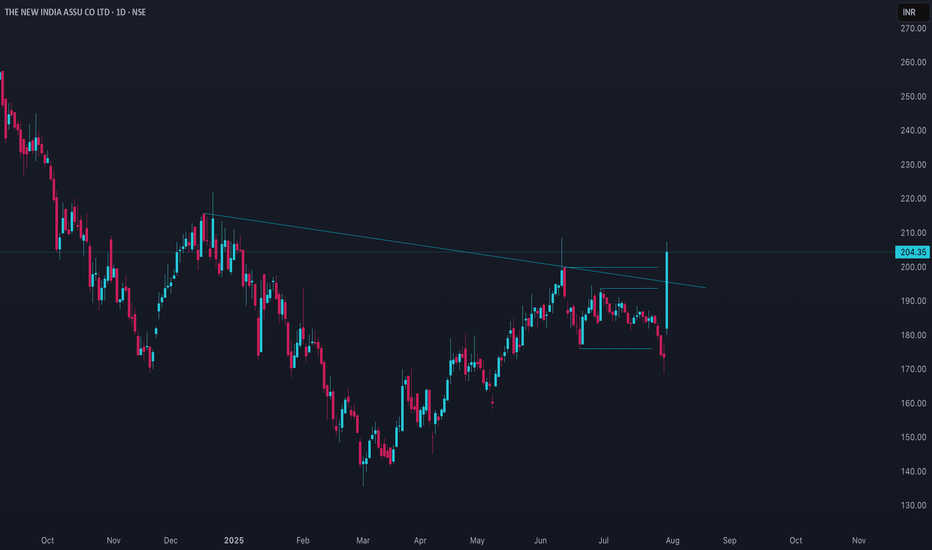
NIACL Price ActionAs of July 30, 2025, New India Assurance Company Ltd (NIACL) stock closed near ₹204, showing a strong recovery with a sharp rally of around 17% in a single day fueled by robust Q1 earnings and positive market sentiment. The stock bounced back from earlier volatility and support levels near ₹170, with technicals indicating bullish momentum supported by moving average crossovers.
NIACL’s recent financial performance has been impressive with an 80% surge in net profit year-on-year and a 13% growth
Paras Defence Price ActionParas Defence and Space Technologies is currently trading near ₹1,630, having delivered a substantial rally over the past year and outperformed many of its peers in the defence sector. The stock has risen more than 100% from its 52-week low and is trading close to its all-time high, reflecting strong investor confidence and robust momentum. Year-to-date, the stock is up over 60%, though it has shown some short-term volatility with a recent pullback of about 9% in just two days, suggesting a phas
Sudarshan Price ActionSudarshan Chemical Industries is currently trading around ₹1,256, having gained nearly 5% in the past week and over 6% in the last month. The stock has delivered a strong 10% return over six months and nearly 40% over the past year, reflecting robust momentum. Its 52-week high is ₹1,315, while the low stands at ₹796, placing the current price close to its yearly peak.
Valuation-wise, Sudarshan Chemical trades at a high price-to-earnings ratio above 80 and a price-to-book ratio above 8, signalin
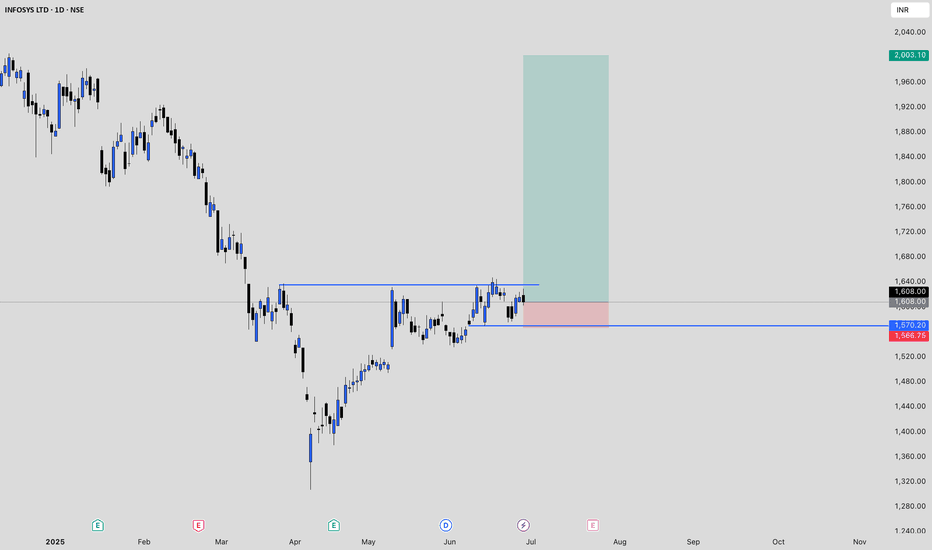
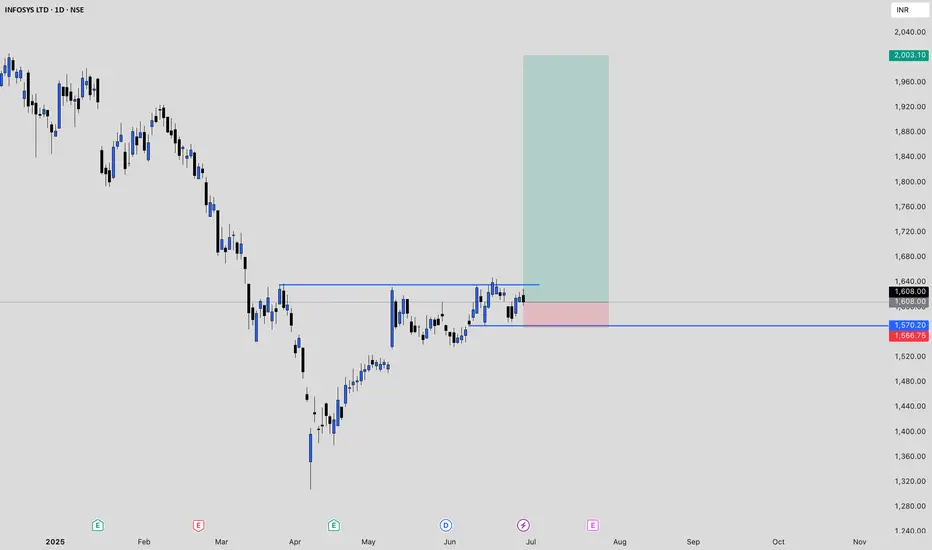
Infy Price actionInfosys (INFY) is currently trading around ₹1,608, with recent fluctuations between ₹1,606 and ₹1,629. Over the past year, the stock has delivered modest gains, slightly underperforming broader market indices and the IT sector. Financially, Infosys remains robust, maintaining strong revenues, healthy profit margins, and a debt-free balance sheet. The company continues to reward shareholders with consistent dividends, including a recent payout of ₹22 per share.
Looking ahead, growth expectations
OIL Price ActionOil India Limited is currently trading at ₹433.40 as of June 27, 2025. The stock has seen a notable decline over the past week, falling by nearly 7%. Over the last month, the price has remained relatively flat, with a slight gain of about 0.5%. Looking at a broader time frame, the stock is up 12% over the past three months and has gained just under 2% in the last six months.
The 52-week high for Oil India stands at ₹767.90, while the low is ₹325.00, indicating that the stock is trading well bel
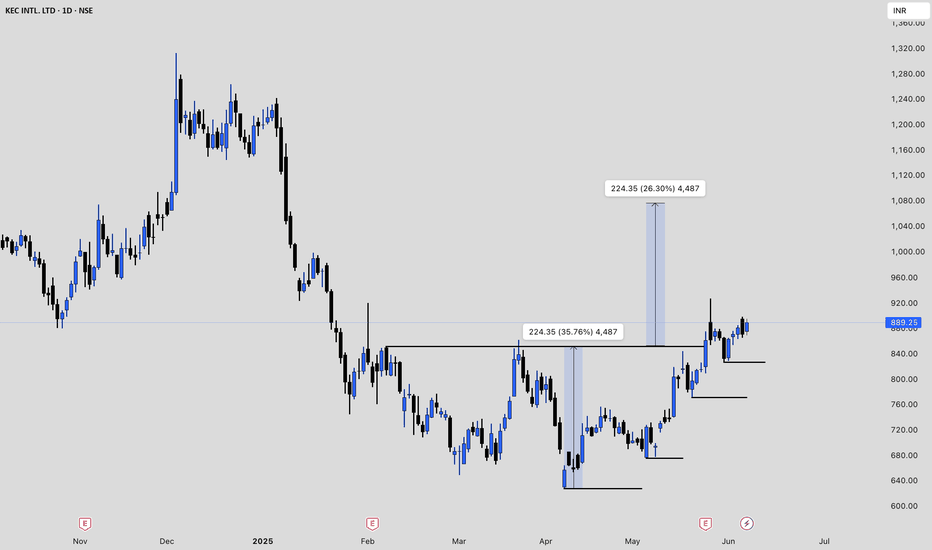
KEC Price ActionKEC International’s share price as of June 6, 2025, is around ₹889.25, reflecting a 2.16% increase from the previous close. Over the past month, the stock has surged by 28.8%, and it is up 6.83% in the last week, showing strong short-term momentum. However, over the last six months, the stock is down by 26.85%, indicating significant volatility in the medium term .
The company is currently trading at a price-to-earnings (P/E) ratio of 40.6 and a price-to-book (P/B) ratio of 4.33, both of which
Sobha Ltd's Price AnalysisSobha Ltd's share price as of late May 2025 is trading in the range of ₹1,349.60 to ₹1,386.10, with recent sessions showing minor fluctuations and a slight upward move from the previous close. Over the past year, the stock has declined by nearly 29%, though its longer-term performance remains strong, with a five-year return exceeding 600% .
From a valuation perspective, Sobha is trading at a high price-to-earnings (P/E) ratio of about 225–241, which is significantly above the industry average a
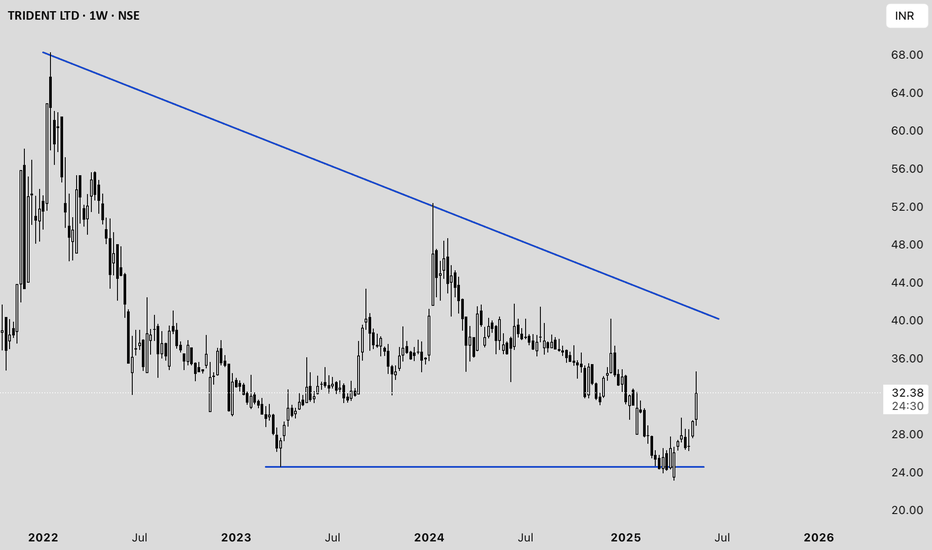
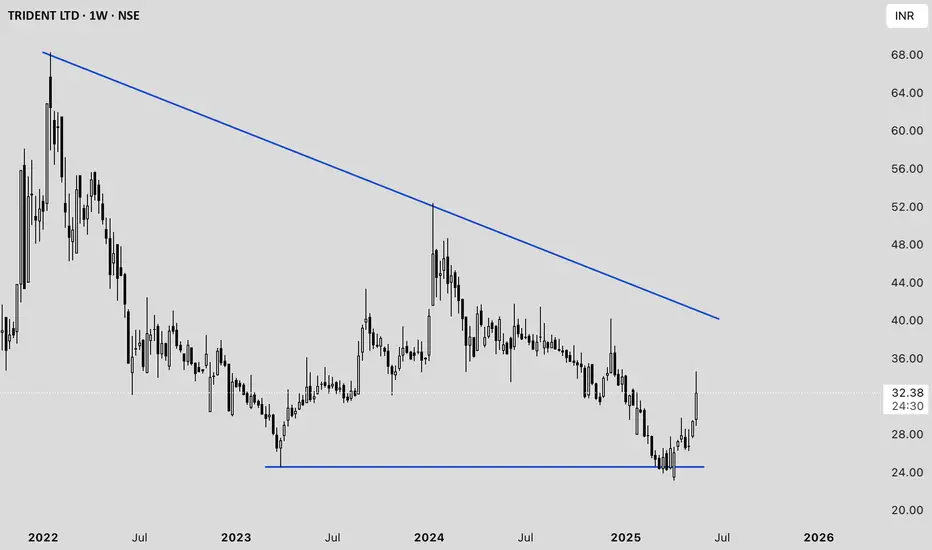
Trident Ltd. Price Analysis (as of May 23, 2025)#### **Current Price and Recent Movement**
- **Latest Price:** ₹32.11 (down 2.32% from the previous close) .
- **1-Week Return:** +9.29%
- **1-Month Return:** +9.11%
- **1-Year Return:** -15.39%
- **3-Year Return:** -32.89%
#### **Technical Analysis**
- **Buy Signal:** A 200-day moving average crossover occurred on May 21, 2025. Historically, this signal has led to an average gain of 6.61% within 30 days .
- **Momentum Indicators:**
- **RSI:** 62.17 (shows moderate bullish momentum)
- **M
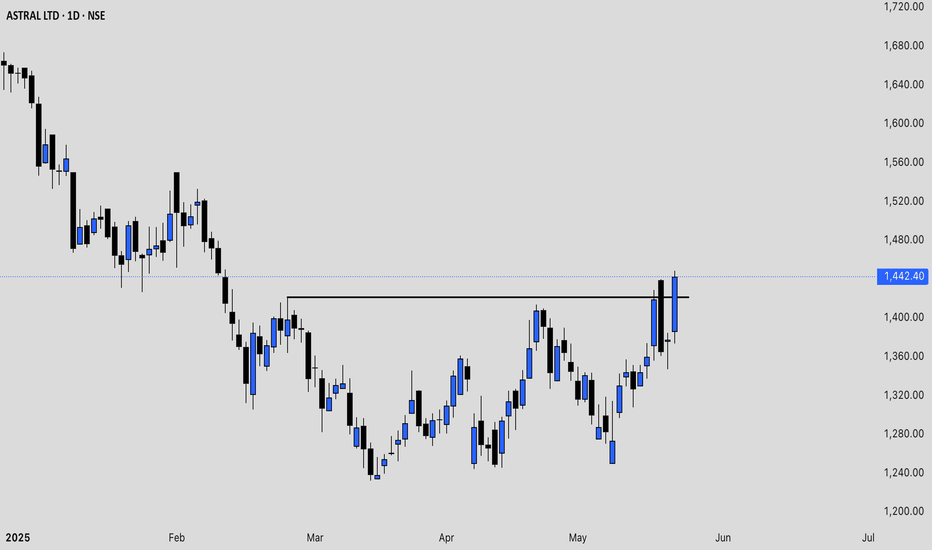
ASTRAL price action analysis Astral Ltd (ASTRAL) has shown a mix of volatility and recovery in May 2025. After a sharp decline earlier in the month, the stock rebounded, with recent prices moving from the ₹1,330–₹1,350 range up to ₹1,377.70 as of May 21, 2025. The trading volumes have remained strong, indicating active participation from both buyers and sellers.
Technically, Astral is trading above its short-term volume-weighted average price (VWAP) of around ₹1,362.9, which is a positive sign for near-term momentum . The
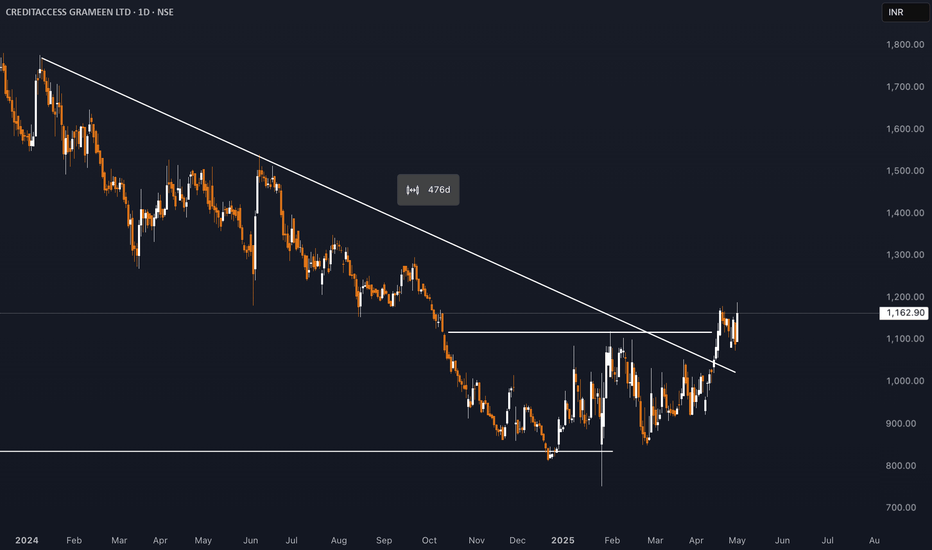
## CreditAccess Grameen (CREDITACC) Share Price Analysis- As of May 2, 2025, CreditAccess Grameen (CREDITACC) traded around ₹1,121–₹1,145, which is approximately 52% above its 52-week low of ₹750.20 (set in January 2025), but below its 52-week high of ₹1,551.95 (set in June 2024) .
- The stock has shown volatility over the past year, with a notable decline from its peak, reflecting both sector trends and company-specific events .
**Valuation and Financial Metrics**
- **P/E Ratio (TTM):** 20.3–21.2, indicating moderate valuation relative to earnings