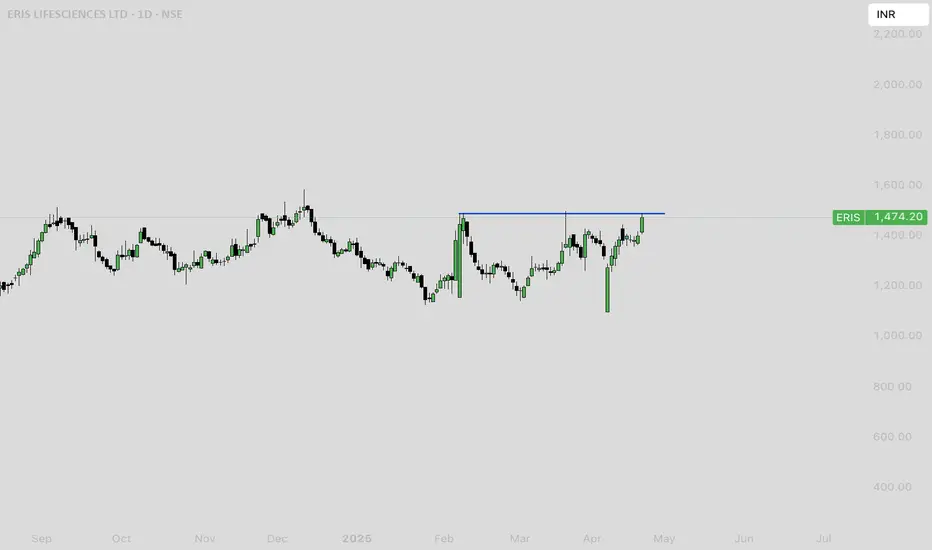
ERIS Lifesciences Share Price AnalysisEris Lifesciences is currently trading in the range of ₹1,371 to ₹1,474, with the latest reported price at ₹1,474.20 as of April 23, 2025. The stock has shown strong performance over the past year, delivering a return of approximately 57%. Over the last three months, the stock is up about 9%, though it has seen a slight dip of 0.57% in the past month.
**Valuation and Fundamentals**
Eris Lifesciences trades at a price-to-earnings (P/E) ratio of 57.13, which is high for the sector, and a price-
Bullish Trend Line
### Maharashtra Seamless Ltd (MAHSEAMLES) Price Analysis
#### **Current Price and Trends**
- **Latest Price:** ₹704.55–₹736.85 (varies by source, reflecting intraday fluctuations)
- **52-Week Range:** ₹562.65 – ₹964.35
- **Market Cap:** ₹9,143–₹9,149 crore
#### **Recent Performance**
- **Q3 FY25 Results:**
- Revenue increased 2% YoY, driven by higher seamless pipe dispatches.
- Profit declined due to lower treasury returns
- **Order Book Stability:** ₹1,500–2,000 crore, supported by demand in oil/gas and manufacturing sectors
#### **T
ASHOKLEY chart looking bullishASHOKLEY cup and handle pattern breakout at lifetime high. Taking support at trendline price action looking bullish. Sustaining above previous lifetime high levels. Looking good for good upside. Disclaimer:- Not any recommendation and shared just as educational purpose. Consult your financial advisor. No one will be responsible for any profit or loss
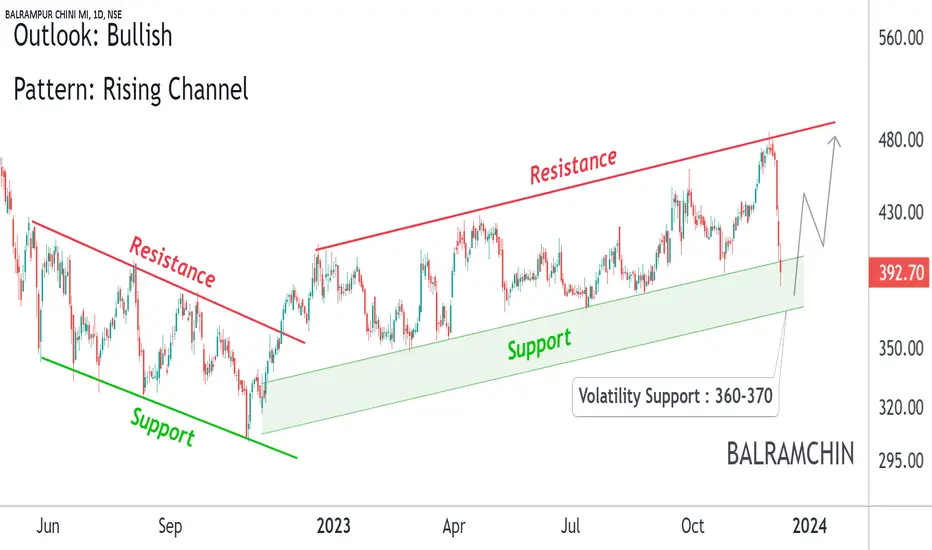
BALRAMCHIN : Exciting Bullish Pattern AlertExciting Bullish Pattern Alert!
📊 Pattern: Rising Channel
📌 Symbol/Asset: BALRAMCHIN
🔍 Description: Stock is around the support.
We can see huge momentum if support is intact.
👉 Disclosure: We are not SEBI registered analysts, this is not a buy or sell recommendation.
Sun Tv Super Bullish There's a strong support around Rs 440 and from there SunTv tried to push it in up direction following uptrend. And the nearest Target visible is RS 681, and in long run it may try to break the high of RS 1080.
HAPPY INVESTING
Comment your thoughts and let me know of your ideas.
Thank you. ^_^
Banknifty ( Next week contract )Banknifty ( Next week contract )
More probability is there for " 46000 "
.
For " long "
entry:45650 / 45400
target: 45750/ 45990 / 46200
stoploss: 45250
.
.
For " Short"
entry: 45250
target: 45050
stoploss: 45400
.
.
Enter only if market Breaks
"Yellow box" mentioned.
.
wait for proper reversal and conformation.
.
don't be aggressive.
.
refer old ideas attached below.
ABBOTINDIA : CUP & HANDLE PATTERNAs I mentioned earlier, Don't Miss to catch this fish. The stock is currently moving up , after completing CUP n HANDLE Patter and taking support @ 22345.00 . Those who missed this stock earlier, the stock is providing a good opportunity to them again. The stock is at support , and at CMP i.e. 22733 is right time to enter the trade. for primary target of 24717.00 and we may see a new high thereafter.
Currently this stock is with Low risk and high Reward and best stock to invest for the time be
ASIAN PAINT LTD : BOTH SHORT AND LONG TERM TRADEAsian Paints Ltd does not need any introduction. With Market Cap of 2,69,000 Cr and a legacy of pre -independence foundation in 1945, the stock is all time favorite for for both retail and Institutional buyers.
Currently the stock has just reversed from its downtrend and stands @ 2833.60.
The chart has already tested the support @ 2820.10 which is our stop loss for this trade.
One can enter this trade anytime now as it has crossed below the neck of reversed HEAD AND SHOULDER pattern .
O
Cup Handle Pattern breakout Jyothy LabsWe can go long in Jyothy Labs with so many confirmations.
Entry- If it Comes for Retest Enter @ 163 levels else enter above 170 levels with good confirmation.
Tgt1- 184
Tgt2- 200
Sl- 158
>> Always Enter With good confirmation & Maintain proper Risk Reward.
******* Knowledge Purpose only ******** This is my view about Stock/Indices Based on Technical analysis & Price Action .The market cannot be accurately predicted or completely controlled, no investment is risk-free.
>> Visit My Ideas Pag
Falling wedge pattern tata motor When this pattern is found in an uptrend, it is considered a bullish pattern, as the market range becomes narrower into the correction, indicating that the downward trend is losing strength and the resumption of the uptrend is in the making.
What is a falling wedge pattern? The falling wedge pattern is a continuation pattern formed when price bounces between two downward sloping, converging trendlines. It is considered a bullish chart formation but can indicate both reversal and continuation pat
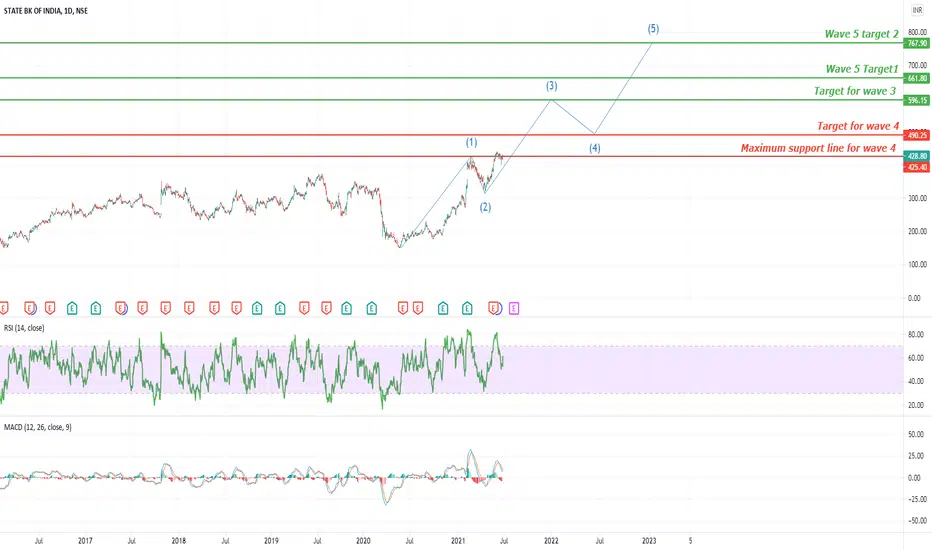
#SBIN Best rally to get in SBIN seems to be in Big Green rally
As it has completed wave 1 at 428
wave 2 be expected to be ongoing
wave 3 target would be around 596
Followed by wave can go below till 428 which is the main support for it or it can bounce back at 490
For a target of 767 if it crosses 661 and sustains NSE:SBIN
Hindustan Composites Making Higher Highs indicating BullishnessHindustan Composites Making Higher Highs in Daily Time frame, We Will go long if the Trendline will Break.
->> Always Enter With good confirmation & Maintain proper Risk Reward.
******* Knowledge Purpose only ********
->> Visit my Ideas Page for Daily Stock Analysis and check my previous stock analysis performance. I usually prefer Swing & Intraday Trades with Good Breakout confirmations and Best Risk Reward Stocks.
HUDCO. Risk:5% Returns:50%Hudco is forming a wonderful set-up,
It is taking solid support at Ascending TL as shown in the chart
and also it has given Triangle pattern BO which gives double confirmation to enter on the long side.
Risk is very simple 5 % below the Trend line and Returns would not be less than 50%.
Mantra:
> We will only enter a trade when there is low risk and high reward.
> We will only enter when we are 100 % confident.