NIFTY 50 : 24400 level again ??1] If tomorrow (i.e 14th May 2026) nifty open flat to positive, we can see nifty starting upside journey till 24400 levels again.
2] If Nifty opens gap-down, kindly ignore this view.
3] Follow Stop-loss very strictly. This view is only for equity segment and not for option buying or option selling.
4] This is high risky view as currently global economic conditions are not in favor of bullish market. Crude oil price are surging and rupee getting depreciated, hence this is view is highly risky.
Butterfly
Finolex Industries: A Potential Long-Term InvestmentFinolex Industries has recently formed a butterfly pattern in its stock chart and is currently positioned within a strong support zone around โน200. The stock has experienced a significant decline of approximately 40%, making it potentially attractive for long-term investors.
Fundamental Analysis of Finolex Industries
Performance Overview: In the fiscal year 2024, Finolex Industries reported a 2.3% increase in revenue and an impressive 89% increase in net income compared to the previous year. The
Technical Analysis: Butterfly Pattern and Support LevelJM Financial Ltd has recently formed a butterfly pattern in its stock chart and is currently trading 32% down from its recent highs. The stock is finding support around the โน114 level, which could present a potential buying opportunity for long-term investors.
Fundamental Performance Overview
Revenue Growth: In the last fiscal year, JM Financial reported a revenue increase of 10%, indicating steady growth despite market fluctuations.
Net Income: The company experienced a decline in net income, w
Whirlpool India Ltd: Evaluating Investment Potential Technical Analysis: Butterfly Pattern and Support Levels
Whirlpool India Ltd has formed a butterfly pattern in its stock chart, currently trading 32% lower than its recent highs. The stock is finding support around the โน1600 level, which may present a strategic entry point for long-term investors.
Fundamental Performance Overview
Revenue Growth: In the second quarter of FY24-25, Whirlpool India reported a 12.58% increase in revenue, reaching โน1,713 crore compared to โน1,521.56 crore in the same
GAIL India Ltd: Assessing Investment Potential Technical Analysis: Butterfly Pattern and Support Levels
GAIL India Ltd has formed a butterfly pattern in its stock chart, currently trading with a 30% decline from its recent highs. The stock is finding support around the โน170 level, which may present a strategic entry point for long-term investors.
Fundamental Performance Overview
Revenue Performance: In the last fiscal year, GAIL reported a 10% increase in revenue, driven by higher demand for natural gas and petrochemical products, despite f
Cummins India Ltd: Evaluating Investment Potential Technical Analysis: Butterfly Pattern and Support Levels
Cummins India Ltd has recently formed a butterfly pattern in its stock chart, currently trading with a 30% decline from its recent highs. The stock is finding support around the โน2900 level, which may present a strategic entry point for long-term investors.
Fundamental Performance Overview
Revenue Growth: For the fiscal year 2023-2024, Cummins India reported a 16% increase in revenue, amounting to approximately โน9,000.2 crore. This growth
3MIndia Accumulate Range - 24500 - 22000 - Target - 51000View is Long term and patience is the KEY.
3M India is bearish currently on Monthly chart and seems will be bearish till end of year. Currently making a harmonic pattern. Will turn bullish my start of 2026.
Accumulation Range - 21000 to 24500
Long term Final Target - 51000+
Intermediate targets marked on the chart.
ICICI **๐ข ICICI BANK Trade Setup - Key Levels to Watch! ๐**
๐ **Stock:** ICICI BANK (NSE)
๐ **Timeframe:** 1H Chart
๐ **Pattern:** Harmonic Pattern
๐น **Current Price:** **โน1,226.00**
๐น **Strong Accumulate Zone:** **โน1,233.75 - โน1,244.95** ๐ต
๐ฏ **Bullish Targets:**
โ
**โน1,264.15**
โ
**โน1,280.50**
๐ป **Bearish Breakdown Levels:**
๐จ **Selling Target 1:** **โน1,211.70**
๐จ **Selling Target 2:** **โน1,178.15**
๐ก **Key Insights:**
โ๏ธ **Breakout above โน1,244.95** can trigger a strong
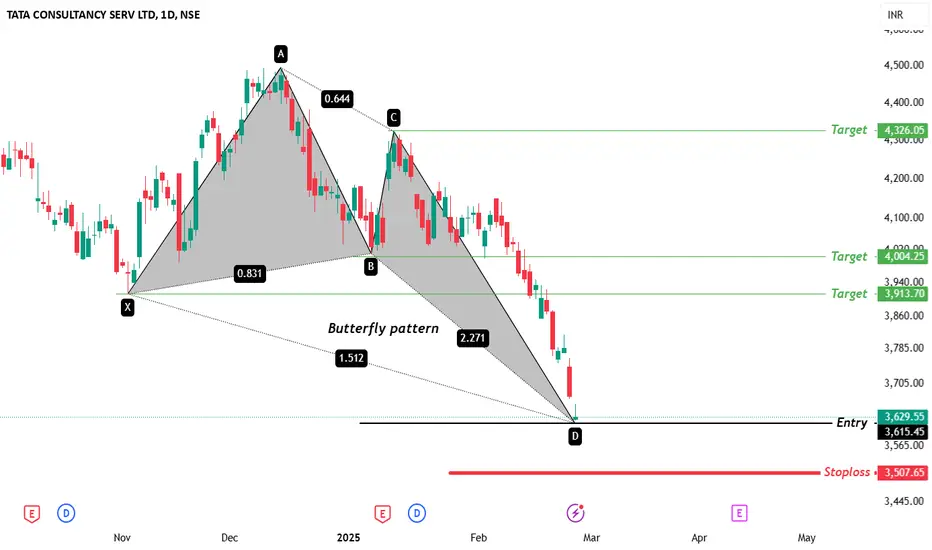
TCS Trade Setup### **๐ TCS Trade Setup (1D Chart) ๐**
๐น **Pattern:** Harmonic Bullish Pattern
๐น **Entry Zone:** **3,629.55**
๐น **Stoploss:** **3,507.65** ๐จ
๐น **Target Levels:**
โ
**3,913.70**
โ
**4,004.25**
โ
**4,326.05**
๐ก **Key Insights:**
โ
**D-Point Reached** โ Possible Bullish Reversal ๐ข
โ
Strong Demand Zone observed around **3,565 โ 3,629**
โ
**Risk-Reward Ratio** looks favorable ๐
๐ **Disclaimer:** This analysis is for **educational purposes only** and not financial a
Axis Bank Ltd (NSE)๐ข Axis Bank Ltd (NSE) โ Swing & Short-Term Trade Analysis ๐ข
๐ Profit from Market Swings with Strategic Trading! ๐
This analysis provides a structured entry-exit strategy based on the Butterfly Pattern and key support-resistance levels.
๐ Swing Trading (1 to 3 Months) โ Short-Term Profit Strategy
๐น Entry Zone โ Above โน995.70 (Confirmation Needed)
๐น Current Price โ โน1,008.95 ๐
๐น Target 1 โ โน1,094.55
๐น Target 2 โ โน1,193.15
๐น Short-Term Target โ โน1,340.40 ๐
๐น Stop-Loss (SL) โ Below โน933.55
๐น Risk-R
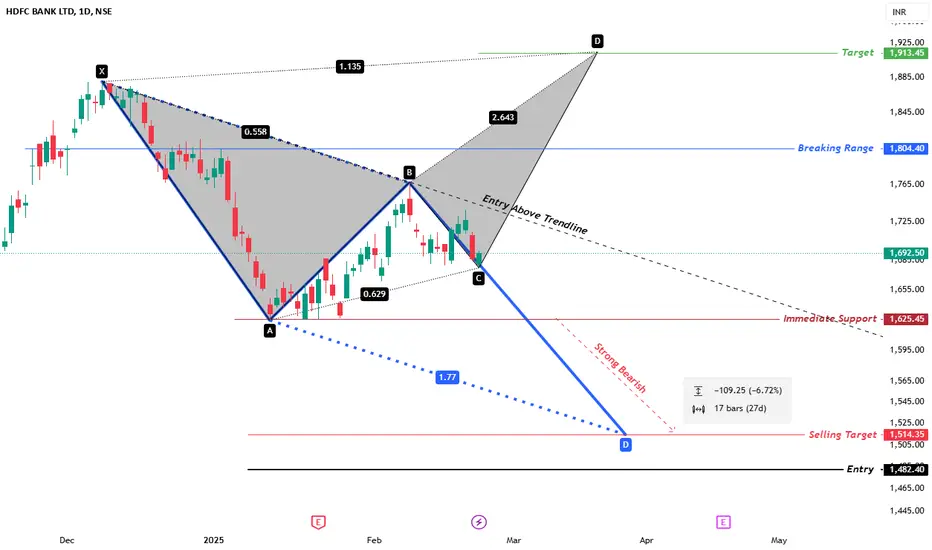
HDFC BANK LTD (NSE)๐ข Smart Trading Opportunity โ HDFC BANK LTD (NSE) ๐ข
๐ Maximize Profits with a Strategic Approach! ๐
Unlock potential trading opportunities with well-defined entry, target, and risk management strategies.
๐น Bullish Pattern & Entry Plan
๐น Entry Confirmation โ Above Trendline Break
๐น Target โ โน1,913.45 (Projected Upside)
๐น Breaking Range โ โน1,804.40 (Key Resistance)
๐น Risk-Reward Management โ Optimize with stop-loss adjustments
๐ป Bearish Scenario & Downside Plan
๐ป Immediate Support โ โน1,625.45
๐ป
Copper Next MoveSL 1Hr candle close only, Target Trigger Price
All detail for chat. good entry at mark price only. and must stoploss minimum risk and good profit. risk ratio 1:1 to manage modified SL. This is not call, Just my idea. Please understand your risk and take full responsibility of your actions
Escorts KubotaSL 1Hr candle close only, Target Trigger Price
All detail for chat. good entry at mark price only. and must stoploss minimum risk and good profit. risk ratio 1:1 to manage modified SL. This is not call, Just my idea. Please understand your risk and take full responsibility of your actions
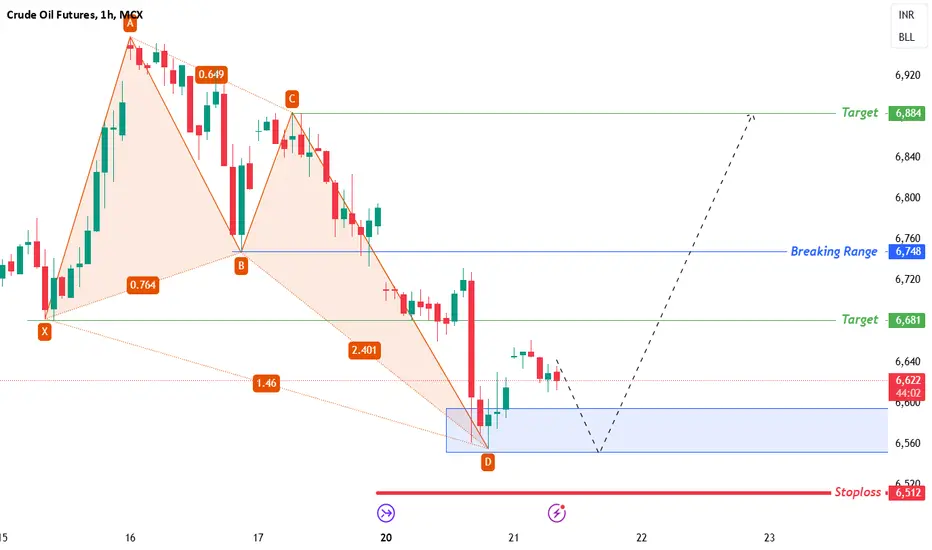
Crudeoil Next Move SL 1Hr candle close only, Target Trigger Price
All detail for chat. good entry at mark price only. and must stoploss minimum risk and good profit. risk ratio 1:1 to manage modified SL. This is not call, Just my idea. Please understand your risk and take full responsibility of your actions
Indian Bank SL day candle close only, Target Trigger Price
All detail for chat. good entry at mark price only. and must stoploss minimum risk and good profit. risk ratio 1:1 to manage modified SL. This is not call, Just my idea. Please understand your risk and take full responsibility of your actions