TATA POWER RELOADED..C point of butterfly validity check...
1. current C point is on a 20months trendline (0.5AB)
2. if breaks the next stop is on the median line of the pitchfork (0.618AB)
CD up leg validity check..
1.Bullish reverse divergence on RSI
2. probable cypher in formation
Potential reversal zone limit estimated at 1.27XA of the butterfly...
reversal pathway estimated in supports of 0.382AX and 0.618AX of the butterfly in conjunction with the pitchfork levels..
Disclaimer .... invested.. this is not a trading/ investing recommendation.. do your own analysis...
Butterfly
A Final Pump before the Bears KnockBITFINEX:BTCUSD COINBASE:BTCUSD BITSTAMP:BTCUSD 1.Bigger bearish cypher in formation
2.Smaller bearish butterfly/deepcrab in formation
3.Bullish reverse divergence in RSI
4.the current 382 green line in pitchfork will yield to the next blue line which has been a resistance before also on 12th march..
4. Ichimoku kumo cloud 4hrs, resistance band upper limit is the same region ....
Disclaimer... not an investing/trading advice...
3 harmonic possibilities, depending on the B point formationThe over all bearish trend still prevails...
The B point reversal will test the validity of the analysis, in breach of which will become invalid..
I am expecting the back outline Bullish Deep crab to take effect, as there is a support at that predicted B point...
The plan is to short as high as possible and keep averaging, to ride the CD down leg...
Discalaimer..this is an attempt to prediction of possible harmonic formation... not a trading/investing advice...
A Bullish Butterfly finally!BITFINEX:BTCUSD COINBASE:BTCUSD BITSTAMP:BTCUSD
Rationale for entry..
The reversal from the falling wedge on good volumes ,
The 5/13 dema cross on the uptrend,
The RSi in the oversold zone
And finally the Bryce Gilmore classic butterfly with an uncommon AB=CD pattern doing reversal from the PRZ on the back of good volumes...
In short, a feast!
Take profit is classed at 0.618AX level, as the extreme point (10778) and at 0.382AX level as a moderation (10704).... The space between these two level is the profit protection zone..
A bull to be feasted on- A butterfly in the ETC house!BITTREX:ETCBTC BINANCE:ETCBTC BITFINEX:ETCBTC POLONIEX:ETCBTC a bearish butterfly is caught in action...
A long now, to start cover from 0.886 retracement level and potential reversal form the PRZ , to short from the to take profit in the 0.382 to 0.618AX level...
Indiabull Housing - Harmonic Pattern.Can Test 1199/1129/1059. Resistance @ 1377.
Below 1199 Harmonic Pattern Butterfly Comes in Action.
Pattern Failed Above 1377.
Positional View.
Other Details Mentioned In Chart.
Please Consult Your Financial Advisor Before Taking Any Decission.
I am not SEBI Registered Financial Advisor.
IShort
CHENNPETRO: Reversal Opportunity.All mentioned & plotted on Chart.
Intraday UP levels: @ 379.2 - 380.90 - 383.85 - 385.90 - 387.10 (Used as TARGET)
Intraday DN levels: @ 373.55, 371.70, 368.85, 366.8, 365.60 (Used for Accumulation)
(Calculation Based on Last Closing Price: @ 376.35)
Trade as per Specified Levels.
My personal View. If matched, Like & Share
As i am not SEBI regd. analyst, take this study as educational purpose.
For taking trade decision Consult with financial Advisor.
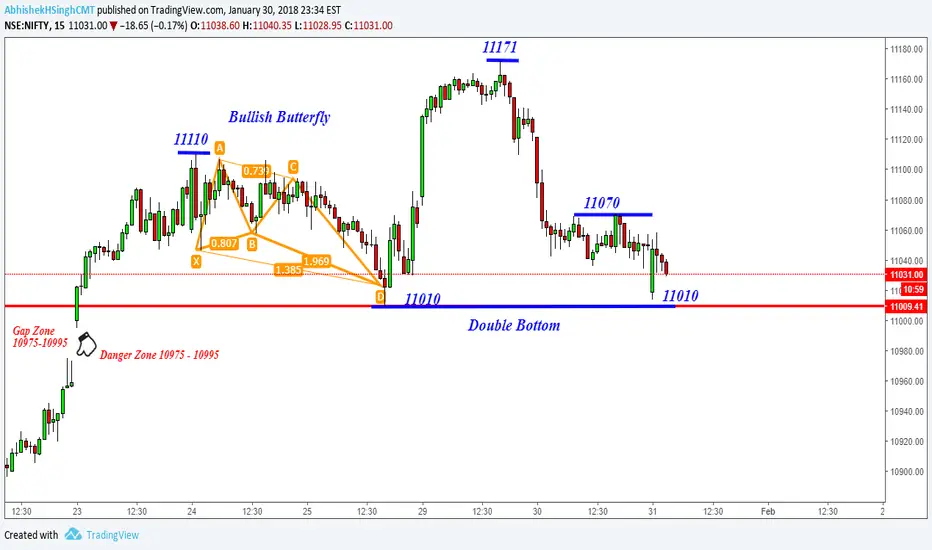
Nifty, TataMotors & Granuels -Short Term Buy From 10975- 11000Last Price@11030 - 31st Jan2018 -10:00 Hrs
Last Time It was bullish butterfly from 11010 for targets 11070 & above 11080 for 11105 - This time double bottom buy holding above 11000 for 11070 - 11105 Intraday.
Strict Stops below 10975 as critical support level level- Going below 10975 -Bears will be on streets
Nifty Strategy - Buy if holds 11000-11010 zone or Buy if 10975-10995 holds as support
Granuels India cracks from 141 to 131
Tata Motors cracks from 420 to 395
Nifty - Bearish Butterfly & Double Top@10500There is a bearish butterfly & double top@10500.
Trading Strategies
Strategy 1 - If Nifty Holds in 10400 -10425 then expect a bounce to 10460-10485 & we book profits & wait outside
Strategy 2 - If Nifty gets resistance between 10475-10500 after strategy 1 is done then look to sell on tops with minimum stops above 10500 - Target -10425 - 10390 - Below 10370 - 10135- 10000
Strategy 3 - Moving above bearish butterfly & double top ( crossing above 10500 ) - "D" level (Holding above D-level & crossing 10500) - Extreme Bullish Scenario - Take care once it crosses above 10500 -it should not dip below 10490 else be cautious.
Strategy 4 - Going below 10370 - Sell for target 10135 - 10000 or closer levels
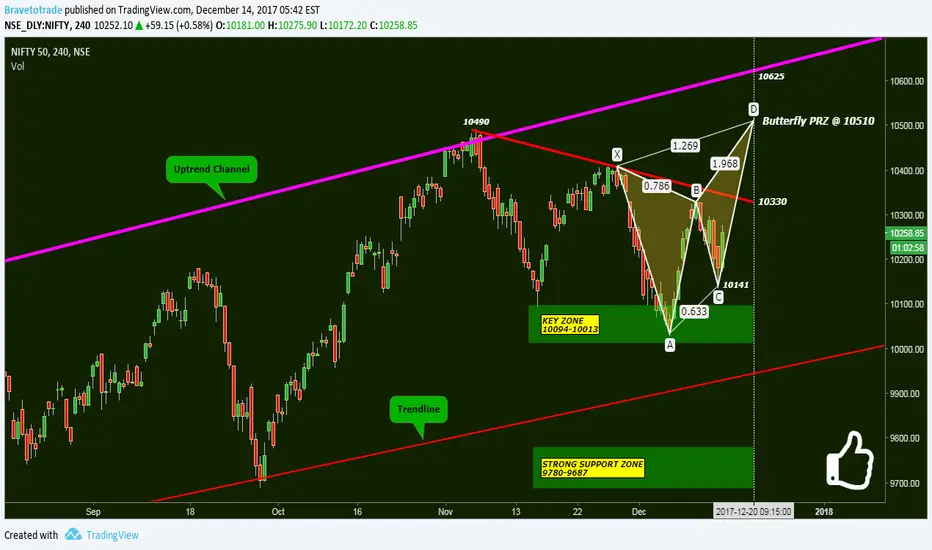
Nifty: Potential For The Rising ButterflyIts been a while since I wrote on the Index. In my last post I marked 10094-10013 as the key area.
Market tested that key area and bounced sharply. Although the Bat pattern could not complete as per expectations, market reacted near 1:1 level (10013) shown in the above post and the cautious approach on bearish side worked quite well in protecting us.
Current Scenario: Suppose the current move takes the market above 10330 level or above the red downtrend line. I that case, I would expect the market to retest previous highs (10490). If that happens, I would look for a Bearish butterfly pattern which completes near those highs @ 10510. So I would look for a double top scenario in this case ( Caution: the failed butterfly pattern may quickly take us to 10620-10650).
As the 25 days cycle (+/- few days) is approaching (see following post) I am excited to see the reaction near 20th December. Therefore, If market make a double top near that date I will be careful b'coz a sharp move might follow.
Bearish Scenario: Although we are in a bull market we might consolidate a bit more. What if market could not breach 10330 but breaks 10141 on the downside, I would expect 9950 level (right at the red uptrend line) and then look for a bounce.
Trade safe, stay healthy.
Do hit the like button.
Regards
Bravetotrade
Butterfly on the ChartButterfly on the hourly time frame, seems to have completed the last leg and waiting to see how it moves to hit T-1 and T-2
T
THE BEARISH BUTTERFLY: FLUTTERING NEAR RESISTANCEA bearish pattern in the formation..Also pattern PRZ confluence with the resistance trendline. Bearish reversal pattern in the zone triggers short.
See the chart for detailed view.
Don't forget to hit like and follow.
Trade safe, be healthy.
Regards
Bravetotrade
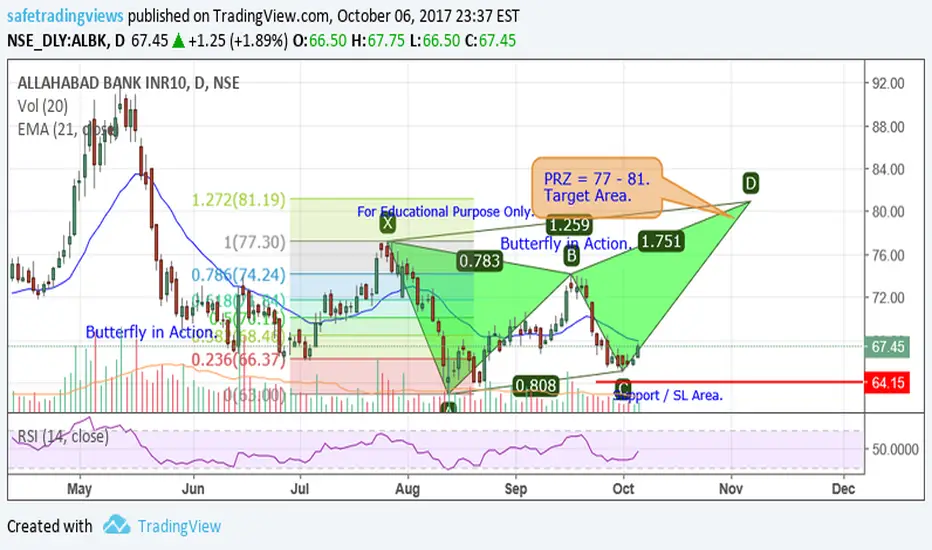
Alhabad Bank - Harmonic Pattern.Possible Harmonic Patterns in Action.
ABCD = PRZ 77.
Butterfly = PRZ 79 - 81.
Pattern Failed Below 64.15.
SL Area 63.
For Educational Purpose Only.
I am not a SEBI Registered Financial Advisor.
ALong
SREI Infra Bullish Bat/ButterflySREI Infra Bullish Bat/Butterfly
Lets wait for Entry
Long at 100 or below
T1 - 111.30
T2 - 116.40
T3 - 121.50
SL - 94
SLong