Long
Long
 Long
Long
HESTERBIO's Chart: Breakout, Retest, and Harmonic PatternsIn this analysis, we will explore HESTERBIO's weekly chart, focusing on the breakout, retest, and the potential completion of Bat and Butterfly Harmonic Patterns. We will evaluate the potential trading opportunity for HESTERBIO based on these technical signals. Let's dive into the analysis.
Chart Analysis:
The TradingView chart for HESTERBIO provides insightful technical insights that could influence the stock's price action.
Breakout and Retest of Falling Trendline:
HESTERBIO's weekly chart showcases a significant breakout of the falling trendline, followed by a retest of this breakout level. This pattern can signal a potential reversal of the downtrend, indicating a shift in market sentiment and the possibility of a bullish move.
Potential Bat and Butterfly Patterns:
The chart indicates the potential formation of both Bat and Butterfly Harmonic Patterns. These patterns are known for their potential reversal signals based on Fibonacci ratios. The completion levels for these patterns are projected around ₹2114 and ₹2117, respectively. If these patterns play out, they could suggest a potential bullish trend continuation.
Trading Opportunity and Target:
Considering the breakout, retest, and the potential Harmonic Patterns, an appealing trading opportunity may be emerging for HESTERBIO. Traders might contemplate initiating a long position at the current market price (CMP) of ₹1770. It's important to note that the suggested stop loss at ₹1622 is designed to manage potential risks.
The target for this trade is set at ₹2114, aligned with the potential completion of the Harmonic Patterns. This level could serve as a potential price target for traders.
Conclusion:
The technical analysis of HESTERBIO's weekly chart points toward a possibly bullish scenario for the stock. The breakout, retest, and the potential completion of Bat and Butterfly Harmonic Patterns suggest the potential for upward momentum. Traders may consider entering a long position at the CMP of ₹1770, with a stop loss set at ₹1622 and a target at ₹2114.
As with any investment decision, exercise caution, conduct thorough research, and consult a financial advisor before making trading decisions. Furthermore, closely monitoring the stock's price action and implementing effective risk management strategies is essential for trading success.
Tags: #StockMarketNews #TradingOpportunity #InvestingTips #BullishBreakout #ProfitPotential #MarketInsights  Long
Long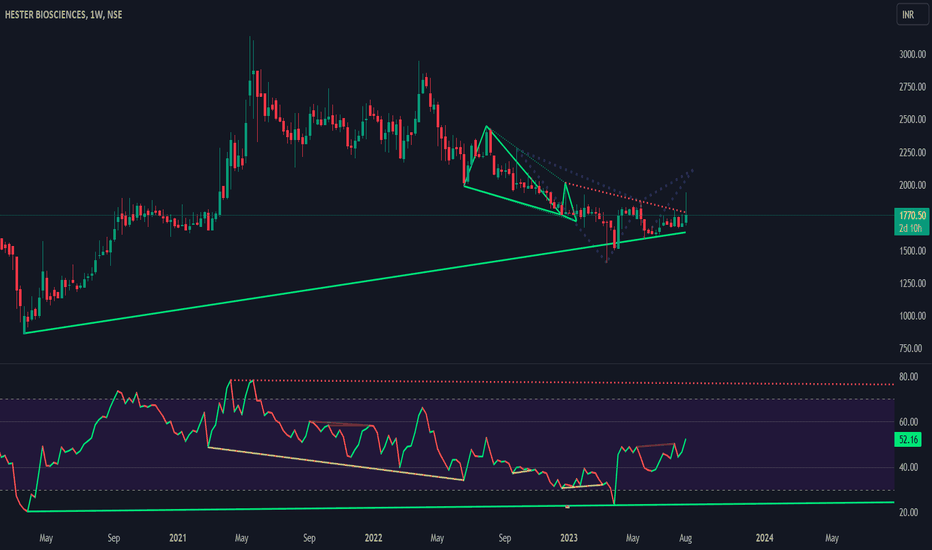
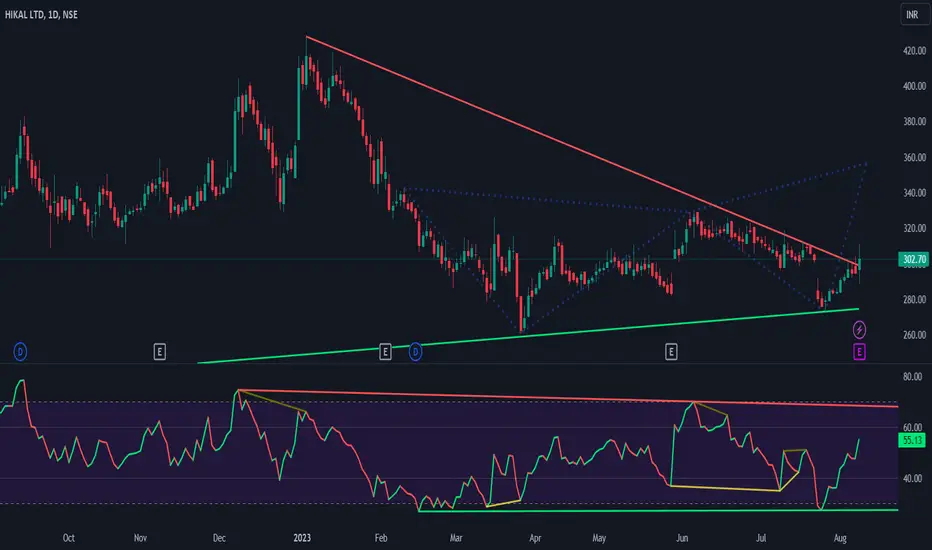
HIKAL's Chart: Breakout and Potential Butterfly PatternIn this analysis, we will delve into HIKAL's daily chart, focusing on the breakout of the falling trendline and the potential completion of a Butterfly Pattern. We will assess the potential trading opportunity for HIKAL based on these technical signals. Let's proceed with the analysis.
Chart Analysis:
The TradingView chart for HIKAL reveals significant technical factors that could impact the stock's price action.
Breakout of Falling Trendline:
HIKAL's daily chart displays a notable breakout of the falling trendline. This breakout suggests a potential reversal in the stock's downtrend, indicating increased buying interest and the possibility of an upward movement in the stock's price.
Potential Butterfly Pattern:
The chart indicates the potential formation of a Butterfly Pattern, a harmonic pattern known for signaling potential reversals. The projected completion of this pattern is around ₹356. If the pattern materializes, it could suggest the continuation of a bullish trend.
Trading Opportunity and Target:
Given the breakout of the falling trendline and the potential Butterfly Pattern, an attractive trading opportunity might be unfolding for HIKAL. Traders may consider initiating a long position at the current market price (CMP) of ₹302.7. It's essential to acknowledge that the suggested stop loss at ₹283 aims to manage potential risks.
The target for this trade is set at ₹356, in alignment with the anticipated completion of the Butterfly Pattern. This level could serve as a potential price target for traders.
Conclusion:
The technical analysis of HIKAL's daily chart indicates a potentially bullish scenario for the stock. The breakout of the falling trendline and the possible Butterfly Pattern completion suggest the potential for upward momentum. Traders could consider entering a long position at the CMP of ₹302.7, with a stop loss set at ₹283 and a target at ₹356.
As with any investment decision, it's recommended to exercise caution, conduct thorough research, and consult with a financial advisor before making trading choices. Additionally, closely monitoring the stock's price action and implementing suitable risk management strategies is crucial for trading success.  Long
Long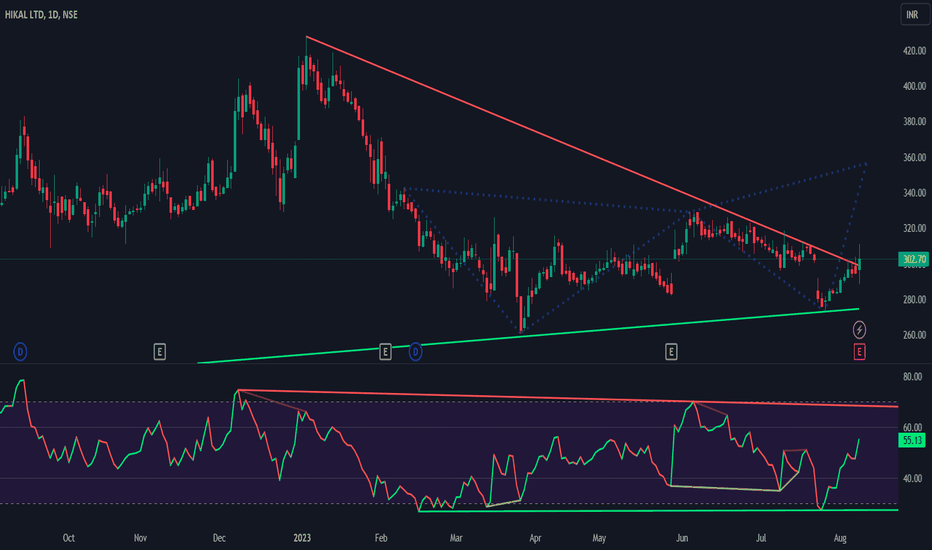
 Long
Long
 Short
Short
 Long
Long
 Long
Long
 Long
Long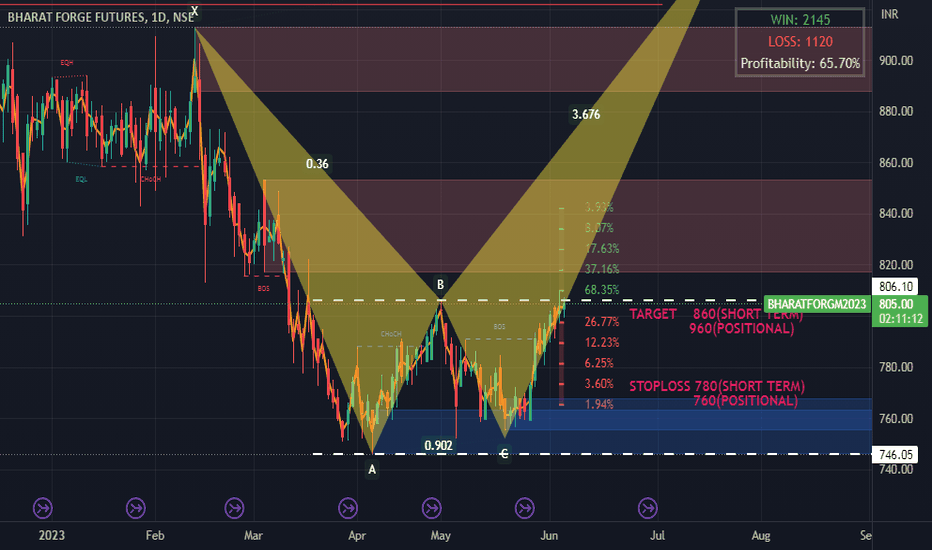
 Long
Long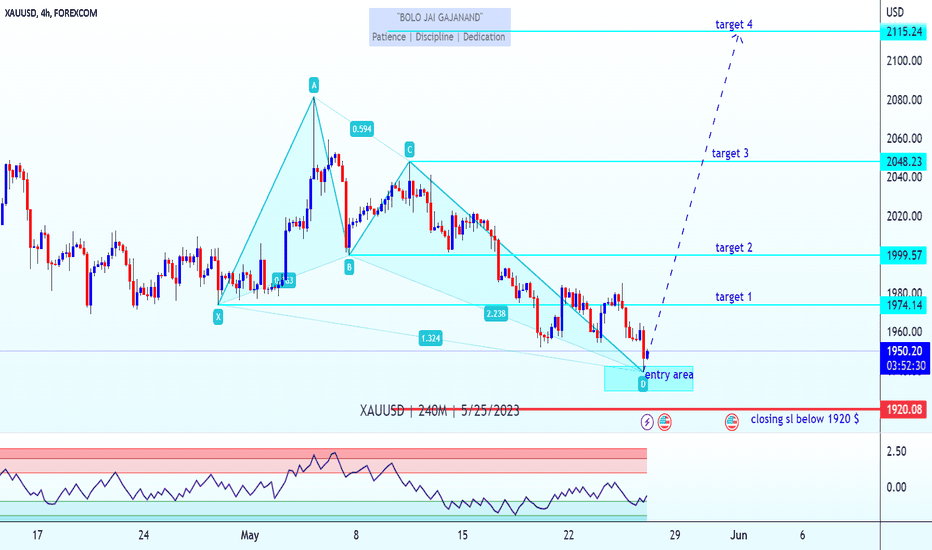
 Short
Short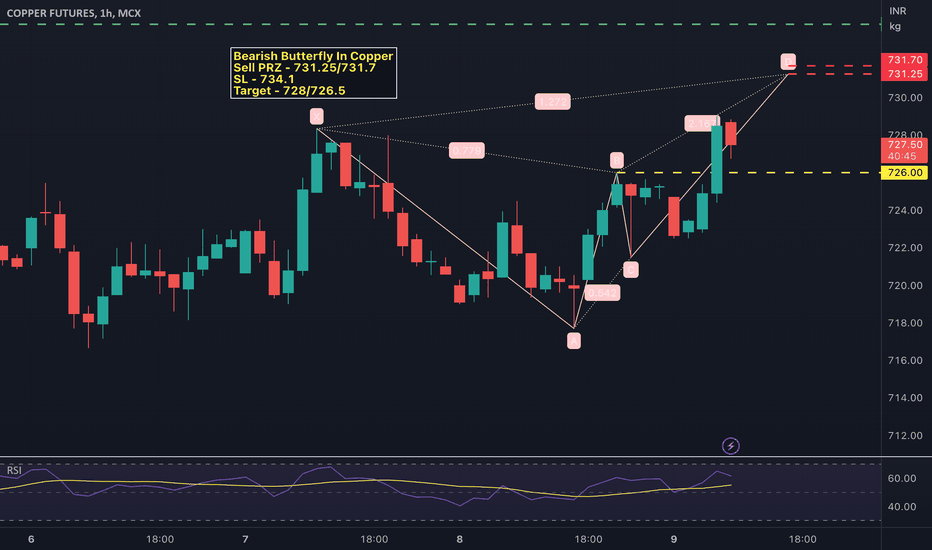
Short 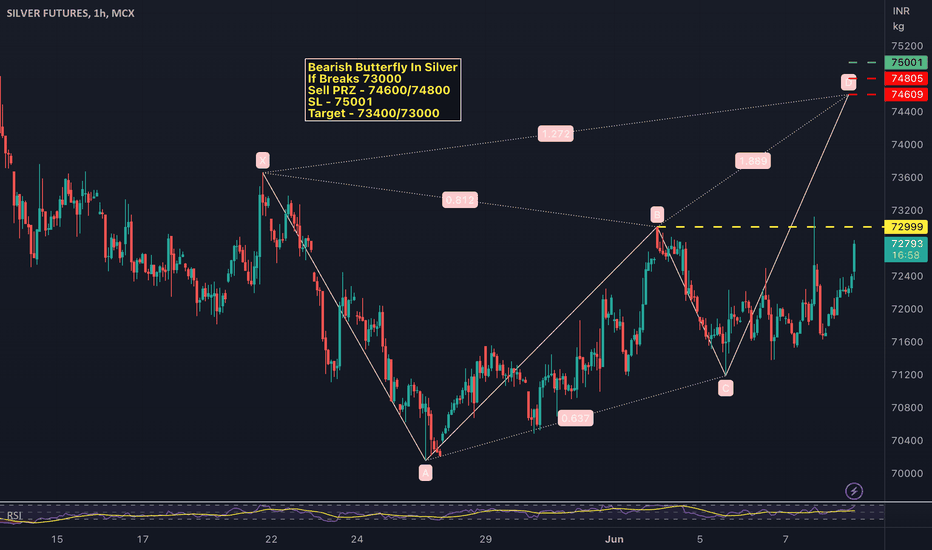
 Long
Long
 Short
Short
Long 
 Long
Long
 Long
Long
 Long
Long
 Long
Long
 Long
Long
 Long
Long
 Long
Long