RELIANCE — Falling Wedge at the Apex, Yearly L4 Reclaimed Eight months of grinding lower since that January top near 1,600, and the whole thing has drawn itself into a textbook falling wedge. The range has squeezed from roughly 290 points down to about 95. We are at the apex. Something has to give. ⏳
🎯 The pivot story just got better. With the full yearly CPR on the chart, price has been trading below the entire 2026 value area all year. TC sits at 1,496.3, P at 1,422.2, BC at 1,348.1. Below that, L4 at 1,313.9 broke in February and capped the stock
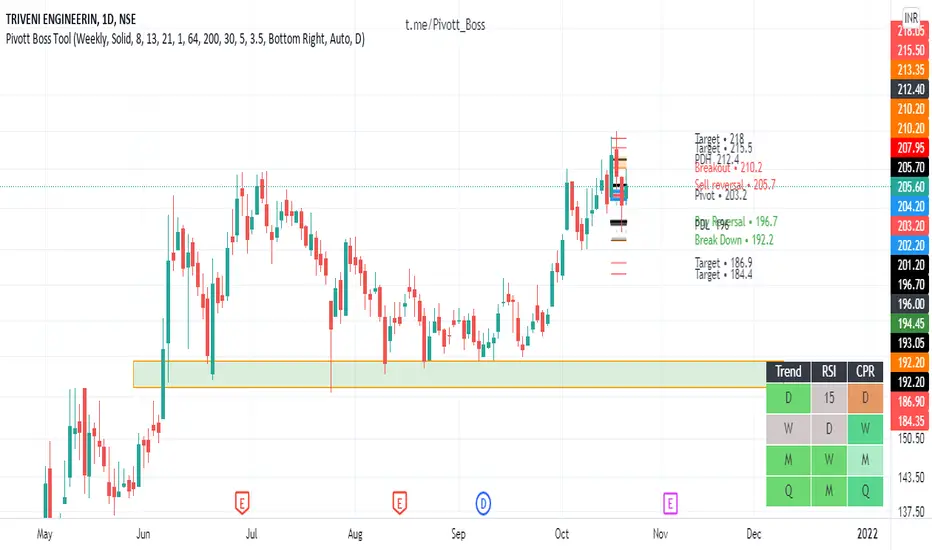
Camarilla Pivot Points
Nifty - View & Intraday Levels for 09 Sep 2022Nifty Levels for Tomorrow..
Expectation : BULLISH Continuation - Sideways/Volatile
Entry Levels are,
Gap up Open - Buy at PDH
Gap down Open - 17767 CPR level (Support Zone)
Flat Open - 17767 CPR level
If 17725 is compromised, we can see BEARISH move in Nifty
Refer the chart for detailed Intraday Support and Resistance levels.
Happy Trading!!
Intraday Price Action Indicator - Multi TimeframeHi,
Success in the stock Market without good Tool and Guidance is Challengeable.
Here is the Indicator which is very user friendly and effective for intraday Trading. Please checkout the Signature tab and Join the link if you need this.
Details of the Indicator:
Method of Trading – Intraday, Positional or Swing – Indices, Stocks and Commodity Markets
Golden Zones : When two or more indicator levels are confluences at one price point which will act as Strong Support and Resistance in the
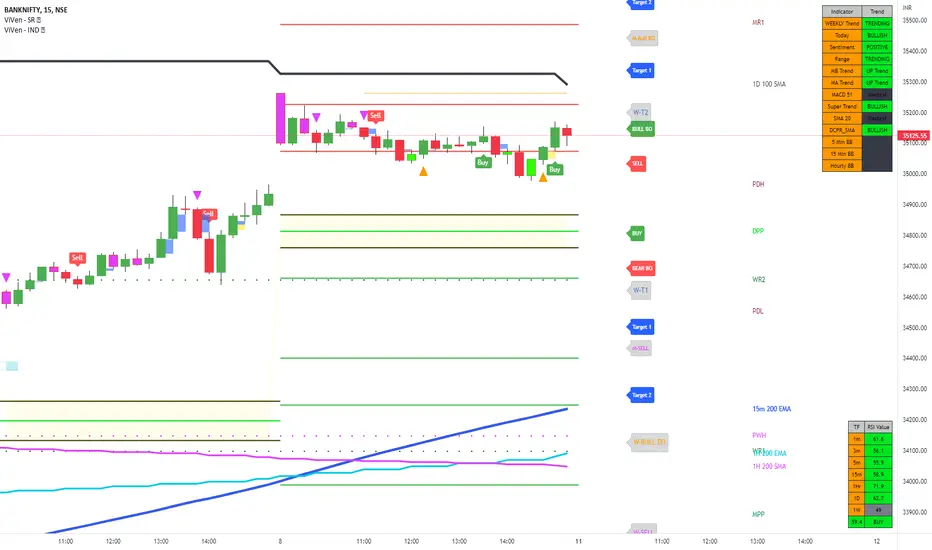
ViVen IND - Multi Time Frame Price Action Trading IndicatorHi Traders,
Trading is Simple, Make it Useful!!
Here the trading made easy with Signals...
Its a Combined Pivot Boss Price Action Strategy Indicator.
This indicator has been created based on Pivot Boss, RSI and Price Action Strategy.
BUY Signal - Go Long at middle price of the Signal Candle, SL low of the candle.
SELL Signal - Go Short at middle price of the Signal Candle, SL high of the candle.
ViVen - IND Indicator Details:
Daily CPR Levels
Pivot Points
Weekly CPR Levels
Next D
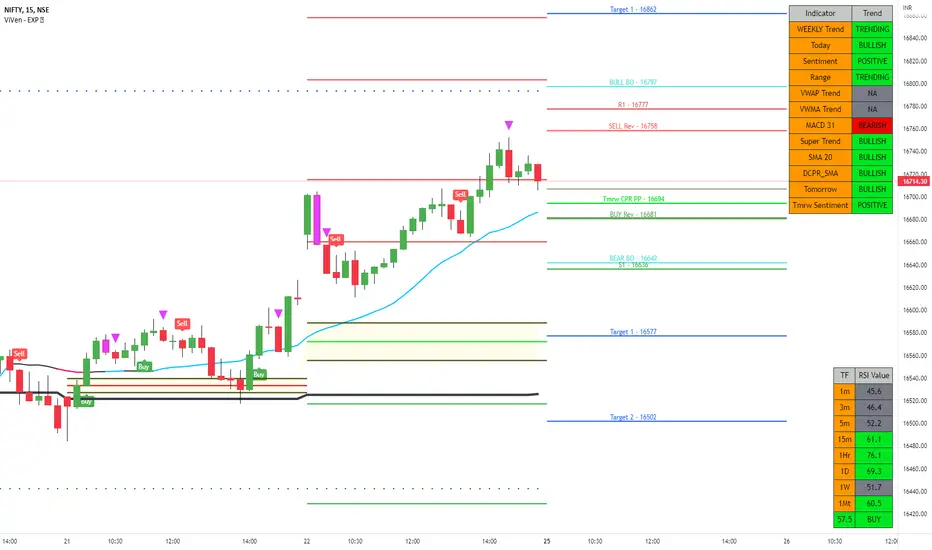
Nifty - Intraday Levels for 11 July 2022Nifty Intraday Levels for Tomorrow..
Trend : Bullish
Sentiment : Positive
Expectation : Bullish Continuation
Expecting Nifty to Open Flat / Small Gap up between CPR and Sell Reversal zone, wait for pull back to test CPR then we can go long for Targets 16253 & 16278 and above
Any breakout below CPR, nifty will go down to test PDL & Virgin CPR level 16110
Refer the chart for detailed Intraday Support and Resistance levels.
Happy Trading!!
Nifty - Intraday Levels for 01 - Jul 2022Nifty Intraday Levels...
Trend : Bullish
Sentiment : Negative
Expectation : Bearish Continuation
Expecting Nifty to Open Flat / Small Gap up around CPR , If any rejection around CPR /Sell Reversal zone we can go short and target is Bear BO and WPP
Any breakout above R1 / Bull BO level, look for buying opportunity.
Refer the chart for detailed Intraday Support and Resistance levels for 28th June - Tuesday.
Happy Trading!!
Indicator for Intraday Trading - with BUY/SELL Signals Hi,
Here the trading made easy with Signals...
Its a Combined Pivot Boss Price Action Strategy Indicator.
This indicator was created based on Pivot Boss, RSI and Price Action Strategy.
BUY Signal - Go Long at middle price of the Candle, SL low of the candle.
SELL Signal - Go Short at middle price of the Candle, SL high of the candle.
Indicator Details:
Daily CPR Levels
Pivot Points
Weekly CPR Levels
Next Day CPR Levels
Camarilla Levels
Pre - Day, Week, Month - High / Low Levels
Money Zo
Gail Intraday using Camarilla StrategyGail on 24-Nov-2021 opened with gap -up and broke the R4 of the day.
The uptrend continued, however with strong resistance at 143.20 and support at 140.00
Hence the range of the stock is between 143.20 and 140.00. With this strategy if would have done entry at 141 would have got 2 rupees profit with stop loss at 140.
Stocks to BUY / SELL for 28 June to 02 JulyThe key levels to watch out for trading next session are mentioned in the video. Trade as per the levels mentioned after finding a suitable candle patterns at support and resistance levels.
For the accurate levels, Follow me on trading view and Insert this indicator from library or from my profile under Scripts.
Happy trading.
NIFTY & BANKNIFTY TRADE PLAN for 28 June MondayThe key levels to watch out for trading next session are mentioned in the video. Trade as per the levels mentioned after finding a suitable candle patterns at support and resistance levels.
For the accurate levels, Follow me on trading view and Insert this indicator from library or from my profile under Scripts.
Happy trading.
Camarilla Strategy Explained on which trade to take on which kind of camarilla setup.
Even Camarilla have Narrow and wide range just like CPR
Providing you the knowledge on how to identify trend of the day on the first bar of the day!!!!
Drawings and explanation has been given on chart. do your back testing and then see the result.
Proving a Small script below of Camarilla.
NIFTY and BANKNIFTY Trade plan for 15th Apr ThursdayKindly watch the fill video to understand the important key levels to watch out for trading Nifty and Banknifty to trade. To find these exact levels, you can install my Indicators and use them for trading.
To know more about these Indicators you can visit my channel PIVOT EDGE where you can find detailed explanation videos and you can also join my live trading sessions daily.
Happy trading
Mohan
NIFTY & BANKNIFTY TRADE PLAN for 9th Apr - MondayThe key levels to watch out are mentioned in the video. Trade as per the levels mentioned after finding a suitable candle patterns at support and resistance levels.
For the accurate levels, Follow me on trading view and Insert this indicator from library or from my profile under Scripts.
Happy trading.
LONG Opportunities for 12-16 AprThe key levels to watch out are mentioned in the video. Trade as per the levels mentioned after finding a suitable candle patterns at support and resistance levels.
For the accurate levels, Follow me on trading view and Insert this indicator from library or from my profile under Scripts.
Happy trading.
NIFTY & BANKNIFTY TRADE PLAN for Monday - 5th AprilHello All,
Please watch this video completely where I have clearly mentioned the possible Entry and exit levels for both NIFTY and BANK NIFTY for Monday as well as for the following days till next week expiry.
Further to get these accurate levels, you can subscribe o my Indicator and follow the levels it plots. For live guidance you can join my daily live session during market hours on my channel PIVOT EDGE.
If you like my analysis and also the Indicators that I have published, you can press l
NIFTY Short opportunity for 18th March - ThursdayThe key levels to watch out are mentioned in the video. Trade as per the levels mentioned after finding a suitable candle patterns at support and resistance levels.
For the accurate levels, Follow me on trading view and Insert this indicator from library or from my profile under Scripts.
Happy trading.