 Long
Long
NIFTY — POTENTIAL BULLISH REVERSAL SETUPNIFTY is showing an interesting technical structure that could indicate a shift from bearish momentum toward a potential bullish reversal.
The setup is based on two key technical observations across different timeframes:
🔹 15-Minute: 30 EMA & 50 EMA crossover + price reaction from the EMA zone
🔹 1-Hour: Prominent Doji formation following a sustained bearish move
The combination of these signals makes the current price action worth monitoring for confirmation of a possible upside move.
🔥 1. 15-MINUTE — EMA CROSSOVER SIGNAL :
On the 15-minute timeframe, the 30 EMA and 50 EMA have crossed, suggesting that short-term momentum may be undergoing a transition.
More importantly, NIFTY is showing a reaction around this EMA zone rather than continuing to accelerate lower.
The 30 EMA and 50 EMA can act as dynamic support/resistance during trending conditions. Therefore, if price continues to hold above this zone, it could indicate that buyers are gradually gaining control.
📌 What to watch:
Price sustaining above the 30/50 EMA zone
Bullish candles forming after the EMA reaction
Increasing buying momentum
Breakout above the recent intraday swing high
A sustained move above the EMA structure would provide stronger confirmation of the bullish thesis.
🕯️ 2. 1-HOUR — PROMINENT DOJI AFTER BEARISH MOMENTUM :
The second and potentially important component of this setup is visible on the 1-hour timeframe.
After a period of bearish momentum, a prominent Doji candle has formed.
A Doji represents a period where the opening and closing prices are relatively close, reflecting indecision between buyers and sellers.
When such a candle appears after an extended directional move, it can indicate that the prevailing momentum is losing strength.
🎯3. TARGET: 23,450
If the bullish reversal gets confirmed and NIFTY sustains the upward momentum, 23,450 can be considered a potential upside target.
Key Setup: 15M EMA crossover + EMA reaction + 1H Doji → potential bullish reversal toward 23,450 .
 Long
Long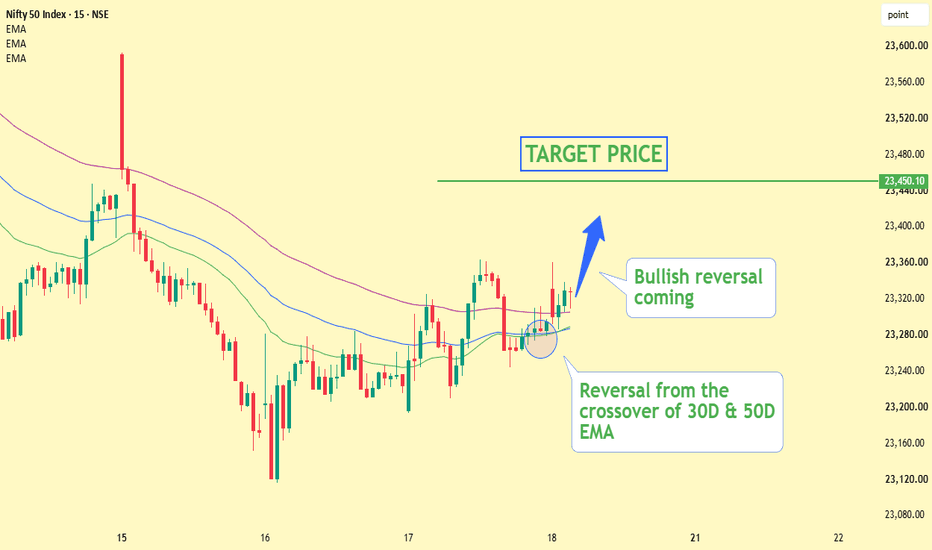
 Long
Long
 Long
Long
COSMOFIRST: Breakout or Liquidity Grab?NSE:COSMOFIRST
After months of recovery, Cosmo First is approaching a major resistance zone near ₹900-916, where historical supply is expected to emerge. While a breakout may attract momentum buyers, the real focus is on how price behaves after the breakout .
One possible scenario is a liquidity grab —a brief move above resistance to trigger breakout participation, followed by a controlled pullback. If the decline occurs on declining volume and finds support around the newly formed demand zone near ₹845–860, it would suggest supply absorption rather than distribution.
A successful reclaim of the breakout level with renewed buying pressure could pave the way for the next leg of the uptrend. ⭐⭐⭐⭐⭐
Key observations:
⭐ 📈 Higher High & Higher Low structure remains intact.
⭐ 📊 EMA alignment continues to improve, supporting the bullish trend.
⭐ 🔍 Watch for high volume on breakout and low volume on pullback.
⭐ 🎯 The quality of the retest is likely to be more important than the breakout itself.
⭐ ❌ Invalidation: Failure to hold the ₹845–850 demand zone after the breakout, especially on expanding selling volume, would invalidate the current bullish setup.
⭐ Patience is often rewarded. Let price confirm the story before drawing conclusions. ⭐
--------------------------------------------------------------------------------------------------------
Disclaimer
This chart is shared purely for educational and market observation purposes. It reflects personal analysis based on price action, volume, and market structure, and should not be considered financial, investment, or trading advice. Please conduct your own research and manage risk appropriately before making any trading or investment decisions.  Long
Long
Marine Electricals: Volatility Compression at Demand Zone ?NSE:MARINE
After a strong impulsive rally, Marine Electricals is transitioning into a healthy consolidation phase rather than showing signs of aggressive distribution. The recent decline has unfolded on relatively lighter volume, suggesting profit booking while buyers continue defending the broader trend.
Price is currently trading near a previously contested breakout area, where multiple technical factors are beginning to align. Volatility has contracted, daily ranges have tightened and the moving averages are gradually compressing, indicating that the market is building energy for its next directional move.
⭐ Key Observations
• Primary trend remains bullish as price continues to trade above the higher-timeframe moving averages.
• Corrective volume has gradually declined, indicating weakening selling pressure.
• Price continues to respect the highlighted demand zone while attempting to establish former resistance as support.
• The current structure reflects volatility compression, often observed before a meaningful expansion.
🎯 Bullish Confirmation
A sustained daily close above ₹258-265, supported by stronger-than-average volume, would improve the probability of continuation toward the previous swing high and potentially higher levels.
⚠️ Invalidation & Risk Parameters
• Pattern Invalidation: A decisive daily close below ₹239 invalidates the immediate VCP structure.
• Volatility Buffer / Safe Level: A close below ₹222 (Weekly Demand / 200 EMA) signals a deeper structural breakdown.
📌 Disclaimer
This chart represents a possible market scenario based on price action, volume behavior and market structure. It is shared solely for educational purposes and reflects my personal market interpretation. It should not be considered investment advice or a recommendation to buy or sell any security. Always conduct your own analysis and apply appropriate risk management.  Long
Long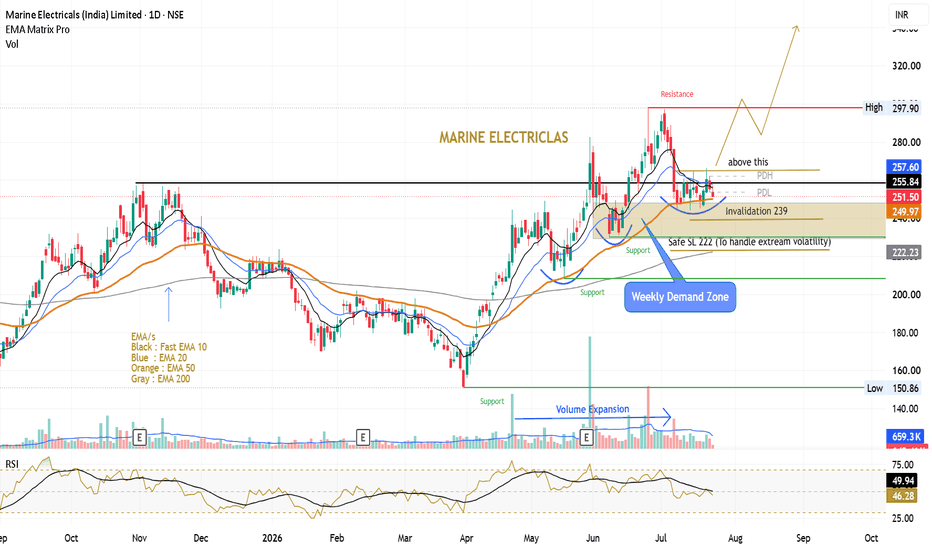
 Long
Long
Nifty - above yesterday's range, indicating bullish sentiment.Yesterday, NIFTY formed a trap in the first 15-minute candle. Today, the market has opened above yesterday's range, indicating bullish sentiment. Therefore, my primary focus will be on long-side trades only.
However, before considering any long position, I would like to see a 15-minute candle close above today's first 15-minute candle high at 24,313. Only after this confirmation will I look for favorable price action setups and evaluate the risk-reward ratio.
If the bullish confirmation is achieved, the potential upside targets are:
🎯 Target 1: 24,370
🎯 Target 2: 24,420
🎯 Target 3: 24,460 (possible target before expiry)
I will consider long trades only if the setup aligns with proper price action and risk management principles.
Disclaimer: This is purely my personal market view and analysis. I may be wrong, and market conditions can change at any time. This is not financial or investment advice. Please do your own research and manage your risk accordingly.
💬 I would love to hear your feedback and market view. Sharing ideas and learning from each other helps us grow together as traders. Long 
Tata Technologies (TATATECH): Engineering Services PowerhouseThere are challenges too. Mentioned them at the end of this description.
Tata Technologies expects a significant growth year due to automotive manufacturers' increased investment. The company is securing full vehicle development projects from major global automakers. This strategic shift allows OEMs to focus on their core brand identity and DNA. Tata Technologies is well-positioned to benefit from this industry-wide outsourcing trend. The firm anticipates meeting its strong double-digit growth guidance for the fiscal year.
SL: 760
Target: ₹1050 - 1150
Tata Technologies has secured three transformative contracts signaling a potential breakout year. The company won a massive ₹830 crore ($100M) deal with Tenneco covering engineering, digital transformation, and AI-driven automation. Additionally, a leading Japanese automotive OEM selected TT for full vehicle engineering, while a European luxury automaker awarded a multi-year engagement spanning engineering, manufacturing, supply chain, and purchasing domains.
These wins represent one of the largest engineering outsourcing deals in TT's history, with delivery extending into FY27. The company now generates ~80% recurring revenue from long-term contracts, significantly enhancing earnings visibility.
Financial Momentum: FY2025 estimates show 18.5% revenue growth to ₹7,850 crores with EBITDA margin expansion to 20.6%. Order book surged 25% to ₹22,500 crores, supported by TT's shift toward higher-margin digital services commanding 15-20% premium pricing through proprietary AI platforms like Autovista™ and SmartPlant Suite.
Strategic Positioning: TT diversifies across North America (40%), Europe (30%), and Asia-Pacific (30%), reducing customer concentration risk. Recent M&A activity includes acquiring Delta Electronics' embedded software arm and partnering with Siemens Digital Industries Software, strengthening digital twin capabilities.
Valuation: Trading at ₹740 with P/E of 28.7x and EV/EBITDA of 14.2x. Our revised target of ₹885 reflects 10x multiple on estimated FY27 EBITDA of ₹1,850 crores, offering 20%+ upside.
Growth Drivers:
• Engineering-as-a-Service model gaining traction (targeting 35% revenue by FY27)
• AI-driven delivery reducing costs while maintaining margins
• Strong global auto OEM relationships in premium segments
Risk Factors: Currency volatility, potential auto industry slowdown, talent acquisition challenges in India.
 Long
Long
BAJFINANCE: High-Probability SMC Retest at Demand ZoneNSE:BAJFINANCE
Market Structure & Setup Analysis:
Structure: Bajaj Finance has completed a clean structural breakout above multi-month All-Time High resistance (~₹1,100), sweeping Buy-Side Liquidity up to ₹1,176.4.
Smart Money Concept (SMC): Price is now conducting a controlled pullback into the daily Point of Interest (POI) / Demand Zone spanning ₹1,050 – ₹1,090, which aligns with the 20 EMA retest.
Volume & RSI Confluence: Volume has contracted sharply on the retracement (signaling no institutional selling pressure), while the daily RSI maintains support above 50.
Action / Zone Price Level Justification
Execution Zone ₹1,085.00 – ₹1,094.00 Immediate entry in POI / Demand Zone
Stop Loss (SL) ₹1,025.00 Below POI structural low & 50 EMA
Target 1 (TP1) ₹1,176.40 Recent Swing High / BSL Level
Target 2 (TP2) ₹1,272.00 Measured Move / Extended Target
Risk-to-Reward 1 : 2 Institutional Risk Management
Disclaimer: This post is strictly for educational and informational purposes only and does not constitute financial or investment advice. I am a non-SEBI registered analyst. Please consult a qualified financial advisor and perform your own risk management before taking any financial positions.  Long
Long
NIFTY 50: Bulls Absorbing Sell Pressure | ₹24,520 Holds, 25,100+NIFTY 50 – Bulls vs Bears: Pressure Building
Nifty has been showing a clear battle between selling pressure and dip-buying pressure over the last few sessions.
After the sharp move up, multiple rounds of selling have emerged, including strong bearish candles and short-term sell-offs. However, each meaningful decline has been met with buying interest around the ₹24,520–₹24,550 zone, suggesting that the bulls are continuing to absorb the selling pressure.
The recent price action is forming a converging structure, with the descending upper trendline representing the supply zone and the rising lower trendline showing continued support from buyers.
The repeated attempts by the bears to push the index lower have so far been absorbed by the bulls.
🎯 Bullish View
As long as ₹24,520 holds, my bullish view remains intact.
A sustained move above the upper resistance/trendline could trigger the next leg higher, with ₹25,100+ as the primary target zone.
⚠️ View Negation
₹24,520 is the key level to watch.
A decisive break and sustain below ₹24,520 would negate the current bullish view. In that case, the setup will need to be reassessed/revised based on the new price action.
📚 This analysis is shared strictly for learning and educational purposes and is not a buy/sell recommendation. Long 
Beyond Candlesticks: Reading the Intent Behind Every MoveMost traders learn candlesticks before they learn anything else about price action.
They learn what a hammer looks like.
They memorize engulfing patterns.
They study dojis, shooting stars, inside bars, and pin bars.
But after a while, something becomes obvious:
Knowing what a candle is called doesn't tell you why it happened.
A bullish candle doesn't automatically mean buyers will continue pushing price higher.
A bearish candle doesn't guarantee that sellers are taking control.
The real skill is learning to look beyond the candle and understand the behavior behind the move.
Because every price movement is the result of decisions.
A Candle Is the Result, Not the Reason
Think about a large bullish candle.
A beginner might simply say:
"Buyers are strong."
But that's only the beginning of the analysis.
Ask a few more questions.
Where did the candle appear?
What happened before it?
Was price sitting at major support?
Did sellers attempt to push lower first?
Did the candle break an important resistance level?
Was there strong participation behind the move?
What happened immediately afterward?
Suddenly, one candle becomes part of a much bigger story.
The candle shows you what happened.
Context helps you understand why it may have happened.
Price Is a Conversation Between Buyers and Sellers
Markets are constantly negotiating.
Buyers want lower prices.
Sellers want higher prices.
When one side becomes more aggressive, price starts moving.
Imagine a stock trading around ₹500.
Buyers are willing to purchase at ₹500, but sellers are asking ₹501.
If buyers become increasingly eager, they may accept ₹501, then ₹502, then ₹503.
Price starts moving higher.
The chart records this process as candles.
But behind those candles are thousands of decisions.
That's why price action can be viewed as a conversation between market participants.
The chart is simply the record of that conversation.
Don't Just Look at Direction—Look at Effort
One of the most useful questions you can ask is:
How much effort did the market need to move this far?
Suppose price rallies strongly but reaches an area of resistance and suddenly struggles.
Candles become smaller.
Upper wicks become longer.
Several attempts to move higher fail.
The market is still technically moving upward, but the behavior is changing.
Buyers are making an effort.
But the result is becoming weaker.
That difference between effort and result can provide an important clue.
Sometimes the market tells you that momentum is running out before the trend actually reverses.
Rejection Tells a Story
Price doesn't always move cleanly.
Sometimes buyers push price into a level and sellers immediately respond.
Price falls back.
A long upper wick appears.
That wick tells you something important:
Higher prices were rejected.
The same principle works in reverse.
Sellers push price lower.
Buyers step in aggressively.
Price recovers.
A long lower wick appears.
Lower prices were rejected.
But remember: rejection isn't an automatic trade signal.
A wick becomes more meaningful when you understand where and why it appeared.
Watch What Happens After the Move
One of the biggest mistakes traders make is reacting to the first candle.
Price breaks resistance.
They buy immediately.
Price drops back below the level.
They panic.
Instead, watch what happens next.
A strong breakout should ideally show acceptance above the previous resistance.
Price may retest the level.
If buyers defend it and price continues higher, the breakout gains credibility.
But if price quickly falls back into the previous range, the story changes.
The market may have rejected the breakout.
The reaction after the move can be more informative than the move itself.
The Importance of Location
A candle doesn't exist in isolation.
Its location matters.
A bullish candle in the middle of a random range may not tell you much.
A bullish candle appearing after a sharp decline at a major support zone can be much more interesting.
Why?
Because traders are already watching that area.
Previous buyers may defend their positions.
New buyers may see an opportunity.
Short sellers may begin taking profits.
The same candle can have completely different meaning depending on where it appears.
This is why experienced traders don't simply scan for patterns.
They study the environment around the pattern.
When Price Struggles to Continue
Sometimes the most valuable information comes from what price fails to do.
Imagine a stock has been trending higher for weeks.
It reaches a new high.
But instead of accelerating, price begins struggling.
Several candles test the same area.
Upper wicks appear.
Breakouts don't follow through.
Momentum becomes weaker.
This doesn't automatically mean the trend will reverse.
But it tells you something has changed.
The buyers are no longer getting the same results they were getting earlier.
That is worth paying attention to.
Failed Moves Can Be More Powerful Than Successful Ones
Markets often reveal their intentions through failed attempts.
Suppose price breaks below support.
Sellers enter.
Breakdown traders join.
Stop losses are triggered.
But price quickly climbs back above the support level.
Now the breakdown has failed.
What happened?
Sellers tried to take control.
They couldn't hold the lower prices.
Buyers absorbed the selling pressure and pushed price back into the range.
Those trapped sellers may now need to close their positions.
Their buying can add fuel to the reversal.
A failed move can therefore become the beginning of a much stronger move in the opposite direction.
Think About Who Is Trapped
Whenever price makes a sharp move, ask:
Who is likely trapped here?
If price suddenly breaks above resistance and then falls back below it, breakout buyers may be trapped.
If price breaks below support and quickly recovers, short sellers may be trapped.
Trapped traders matter because eventually they may need to exit.
Their exits can create additional buying or selling pressure.
This is one reason understanding market psychology can be more useful than memorizing dozens of patterns.
Trends Are Built One Decision at a Time
A strong trend doesn't appear from nowhere.
It develops through a series of decisions.
In an uptrend, buyers repeatedly prove willing to pay higher prices.
Pullbacks are absorbed.
Previous highs are broken.
Support levels hold.
Higher highs and higher lows develop.
In a downtrend, the process is reversed.
Sellers repeatedly accept lower prices.
Rallies are sold.
Support levels break.
Lower highs and lower lows develop.
Instead of seeing market structure as a collection of lines, think of it as evidence of who is consistently winning the battle.
Consolidation Is Also Information
Not every important move is fast.
Sometimes the market becomes quiet.
Candles get smaller.
Price moves sideways.
Volatility decreases.
Many traders become bored and stop paying attention.
But consolidation can be extremely informative.
It tells you that buyers and sellers have reached a temporary agreement.
Neither side is strong enough to move price significantly.
Eventually, something changes.
New information arrives.
Orders build up.
One side becomes more aggressive.
The balance breaks.
Price begins searching for a new level.
The quiet period was not meaningless.
It was part of the process.
Don't Try to Predict Every Candle
The goal of price action isn't to predict exactly what the next candle will look like.
That's impossible to do consistently.
A better approach is to build a scenario.
For example:
"If price holds this support zone and buyers regain control, I may consider a long setup."
Or:
"If price breaks this resistance but immediately falls back below it, the breakout may have failed."
This approach keeps you responsive instead of emotionally attached to one prediction.
You don't need to know what the market must do.
You need to know how you will respond to what it actually does.
The Chart Is Telling You a Story
When you look at a chart, try reading it like a story.
Price rises.
Sellers appear.
The market pulls back.
Buyers defend support.
Price rallies again.
Resistance is tested.
The breakout fails.
Sellers become aggressive.
The trend changes.
Every stage contains information.
The more you practice reading this sequence, the less dependent you become on individual candlestick patterns.
You begin to see the relationship between:
Price → Reaction → Participation → Psychology → Market Structure.
Final Thoughts
Candlesticks are useful.
But they are only the language.
The real skill is understanding what the language is saying.
A candle tells you where price moved.
A sequence of candles tells you how price behaved.
Market structure tells you who is gaining control.
Volume can provide clues about participation.
Liquidity can help explain where price may be attracted.
And psychology helps explain why traders react the way they do.
So the next time you see a familiar candlestick pattern, don't immediately ask:
"What pattern is this?"
Ask:
"What just happened?"
"Who tried to take control?"
"Who failed?"
"Who might be trapped?"
And most importantly:
"What is price telling me about the behavior of buyers and sellers?"
Because the real edge isn't in recognizing more candles.
It's in understanding the story behind them.
Don't just read the candle. Read the intent behind the move.
AUROPHARMA Ascending Triangle Breakout📊 Aurobindo Pharma Ltd.: Daily Technical Snapshot – Ascending Triangle Breakout
📊 STWP Technical Analysis
________________________________________
MARKET STRUCTURE SNAPSHOT | NSE: AUROPHARMA | DAILY
Closing Price: 1,658.00 (+69.10 | +4.35%)
Core Trend: Uptrend
Market State: Ascending Triangle Breakout
Price Structure: Price has broken above the horizontal resistance zone of an Ascending Triangle, supported by a rising trendline, strong bullish candle and above-average volume. The breakout indicates an attempt to move into a higher trading range.
________________________________________
OPERATIONAL PRICE GRID & KEY REFERENCE LEVELS
Model Reference Level: 1,662.40
Hard Invalidation Level: 1,564.80
Structural Risk: 97.60 (5.87%)
Resistance Levels: R1 1,686.97 | R2 1,715.93 | R3 1,769.47
Support Levels: S1 1,604.47 | S2 1,550.93 | S3 1,521.97
Range Structure: Low 1,416.10 | High 1,769.47
Higher Timeframe Observation Zones: 1,716 | 1,769 | 1,850
________________________________________
MOMENTUM, PARTICIPATION & CPR DATA
Volume Profile: 2.00 Million Shares
Volume Character: High Relative Participation
Current Bias: BREAKOUT CONFIRMATION / BUY ON PULLBACKS
CPR State: Bullish Zone | CPR Sideways (Wide)
Today's CPR: Pivot 1,602.50 | Top 1,595.70 | Base 1,609.30
Tomorrow's CPR (Projected): Pivot 1,633.40 | Top 1,645.70 | Base 1,621.20
________________________________________
💡 STWP QUICK READ
Price has broken above an Ascending Triangle resistance.
Strong volume supports the breakout.
Buyers remain in control above the breakout zone.
Momentum remains firmly bullish, though extended.
Watch for sustained acceptance above the breakout area.
________________________________________
📚 EDUCATIONAL OBSERVATION
Aurobindo Pharma has delivered a notable Ascending Triangle breakout after several weeks of price compression. The pattern developed through a series of higher lows while price repeatedly encountered resistance around the same horizontal zone. This combination reflected increasing buying pressure as buyers gradually accepted higher prices.
The latest session has pushed price decisively above the upper boundary of the formation, accompanied by a strong bullish candle and increased participation. This gives the breakout greater technical significance compared with a move occurring on weak volume.
The overall technical picture suggests that buyers are attempting to establish a new higher trading range.
Momentum remains constructive. RSI at 65.27 indicates strong bullish momentum, while ADX at 27.03 suggests that the developing trend has meaningful strength. ROC at +8.22% confirms positive price acceleration, while the CCI at +233.75 reflects strong buying pressure. The Stochastic at 97.07 shows highly extended momentum, which means short-term consolidation or pullbacks remain possible even while the broader structure remains bullish.
Volume expanded to 2.00 million shares, approximately double the 20-day average of 1.00 million shares, representing a participation ratio of around 2.00x. Such above-average volume indicates increased market participation and adds credibility to the Ascending Triangle breakout.
The projected Central Pivot Range (CPR) has shifted higher, with tomorrow's Pivot at 1,633.40 and the projected CPR extending from 1,621.20 to 1,645.70. The upward shift in CPR supports the improving price structure, although sustained acceptance above the breakout zone remains important.
Immediate attention remains on 1,686.97 and 1,715.93, followed by 1,769.47 as the next major resistance zone. Sustained trading above the breakout area could strengthen the developing trend and bring higher-timeframe observation zones into focus. On the downside, 1,604.47 becomes the first important support, while 1,564.80 remains the structural invalidation level.
________________________________________
🏢 BUSINESS & FUNDAMENTAL UPDATE
Aurobindo Pharma remains a major Indian pharmaceutical company with a strong presence across generic medicines, active pharmaceutical ingredients (APIs), specialty products and international markets. Its diversified product portfolio, manufacturing capabilities and global presence provide a constructive long-term business backdrop. Continued focus on complex generics, specialty pharmaceuticals and international expansion remains important to the company's growth trajectory. Aurobindo Pharma delivered a strong Q1 FY27, with consolidated revenue rising approximately 16% YoY to 9,150 crore and net profit increasing 25.2% YoY to 1,032 crore. EBITDA grew around 20%, with the EBITDA margin improving to approximately 21%. The performance was supported by broad-based growth, particularly across its Europe and US businesses. Management also maintained a double-digit revenue growth outlook for FY27, while continuing investments in biosimilars and specialty products. The strong quarterly performance provides a constructive fundamental backdrop to the stock's current technical breakout.
________________________________________
📖 Educational Note
The Ascending Triangle generally develops when price repeatedly encounters resistance at a similar level while successive lows move higher. This reflects increasing demand and compression between buyers and sellers. However, the pattern becomes more meaningful when the breakout is accompanied by strong participation and sustained price acceptance above resistance. Support and resistance levels should be treated as observation zones rather than predictive targets. Chart patterns, price action, momentum indicators, volume analysis and CPR are educational tools that help market participants understand evolving market structure within a disciplined risk-management framework.
________________________________________
⚠️ Disclaimer
This analysis is provided strictly for educational and informational purposes.
This is not financial, investment or trading advice and should not be considered a recommendation to buy or sell any security.
Stock market investments are subject to market risks, including the possible loss of capital.
Past performance, historical observations, chart patterns and technical indicators do not guarantee future results.
Please conduct your own research and consult a SEBI-registered investment adviser before making investment decisions.
STWP assumes no responsibility or liability for any financial loss arising directly or indirectly from the use of this information.
 Long
Long


