BRITANNIA - Falling Wedge + Bullish Engulfing Combo💹 Britannia Industries Ltd (NSE: BRITANNIA)
Sector: FMCG | CMP: ₹5,892.50 | View: Falling Wedge + Bullish Engulfing Reversal Setup
📊 Price Action:
Britannia is currently displaying a strong confluence setup where both a chart pattern and a candlestick pattern align perfectly to signal a potential trend reversal.
After weeks of consolidation within a downward-sloping structure, the stock has formed a Falling Wedge pattern — a classic bullish reversal formation.
Adding strength to this structure, a Bullish Engulfing Candle on 4 Nov 2025 emerged from the wedge’s lower boundary, confirming buyer dominance and hinting at a near-term trend reversal.
📉 Chart Pattern Analysis – Falling Wedge (Bullish Setup):
The Falling Wedge pattern is marked by two converging downward trendlines, each connecting a series of lower highs and lower lows.
This structure reflects seller exhaustion and early buying interest.
Britannia’s wedge formation is now reaching its apex, where breakout probability is highest.
Volume contraction throughout the wedge also supports the notion that supply is drying up, preparing for a breakout above the upper trendline.
📈 Candlestick Pattern – Bullish Engulfing Confirmation:
The Bullish Engulfing Candle formed on 4 Nov 2025 precisely at the lower support line of the wedge, validating the pattern with strong timing. It represents a shift in control from sellers to buyers, with the green candle completely engulfing the prior red body. Volume expansion on that session further confirmed active participation by institutions ahead of the upcoming news catalysts. This one-day reversal candle acts as the first technical confirmation, while a breakout above the upper trendline will serve as the structural confirmation for the wedge pattern.
📏 Fibonacci Analysis:
From swing low ₹5,298 to swing high ₹5,930:
78.6% retracement @ ₹5,795 → Key reversal level defended.
61.8% retracement @ ₹5,888 → Currently reclaimed zone.
100% extension @ ₹5,930 → Short-term breakout threshold.
The Fibonacci structure aligns beautifully with the wedge’s geometry, implying that the reversal zone is complete and buyers are regaining momentum.
🧭 STWP Support & Resistance:
Resistances: ₹5,940 | ₹5,987 | ₹6,055
Supports: ₹5,825 | ₹5,775 | ₹5,710
The ₹5,775–₹5,825 range is acting as a high-confidence accumulation base, while ₹6,090–₹6,150 represents the key breakout trigger zone.
📊 STWP Volume & Technical Setup:
Volume on 4 Nov surged to 363.4K vs 248.7K average, confirming institutional interest at lower levels. VWAP recovery and improving RSI (47→52+) show that momentum is gradually returning.
MACD is approaching a bullish crossover, while Stochastic and CCI have both turned upward — all aligning with a reversal confirmation setup.
Trend Direction: UPTREND (Transitioning) | Volume Confirmation: Possible Accumulation in Progress
🧩 STWP Summary View:
Final Outlook:
Momentum: Strengthening | Pattern: Falling Wedge + Bullish Engulfing | Risk: Moderate | Volume: Increasing
Britannia’s technical structure now showcases dual confirmation — a chart pattern (Falling Wedge) supported by a candlestick reversal (Bullish Engulfing).
This confluence enhances the reliability of the reversal signal and increases the probability of an upside breakout. As long as the price holds above ₹5,825, the bias remains bullish with potential continuation toward ₹6,150–₹6,250.
⚠️ Disclosure & Disclaimer – Please Read Carefully
This analysis is for educational purposes only and should not be treated as financial or investment advice.
I am not a SEBI-registered investment adviser. All views are based on technical observations and publicly available information.
Trading involves risk; please assess your financial suitability, position size, and stop-loss levels before entering any trade.
Always consult a SEBI-registered financial adviser for personalized guidance.
Position Status: No active position in (BRITANNIA) at the time of this analysis.
Data Source: TradingView & NSE India
💬 Found this useful?
🔼 Give this post a Boost if you value clean technical confluence studies.
💭 Comment your thoughts — does this wedge-breakout setup look convincing to you?
🔁 Share this post to help others understand pattern + candlestick synergy.
👉 Follow for more institutional-style technical breakdowns built on clarity and patience.
🚀 Stay Calm. Stay Clean. Trade With Patience.
Trade Smart | Learn Zones | Be Self-Reliant 📊  Long
Long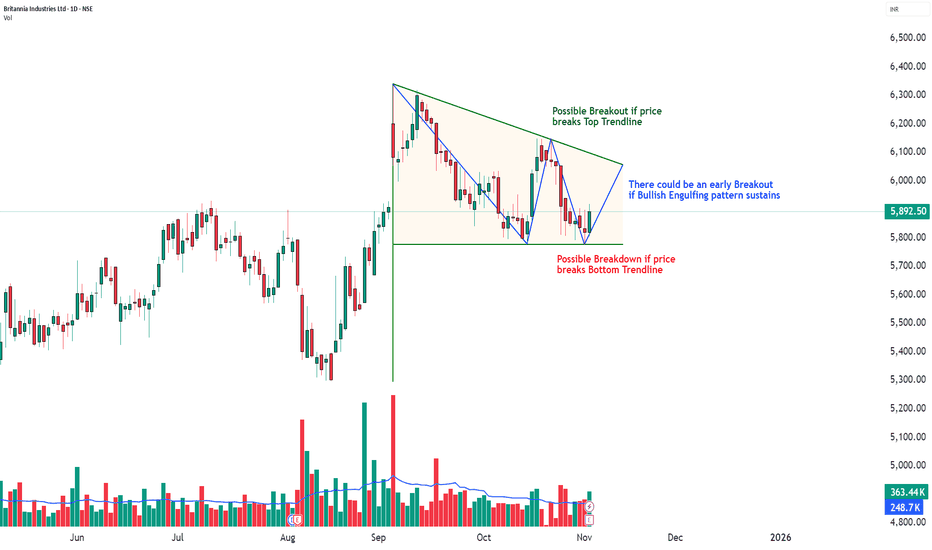
 Long
Long
 Long
Long
 Short
Short
Crude Oil Futures Technical Analysis with TargetsCrude Oil Futures (MCX) Technical Analysis – Key Levels and Price Outlook
(November 2025 Update)
- Crude oil prices have shown some recovery this week after a continuous downtrend seen in October.
- The market is now trying to build a base above ₹5,100 and looks ready for a possible short-term bounce if bulls manage to sustain above support levels. Let’s break down the current chart structure, support, resistance, and targets in detail.
1. Current Market Overview
Crude Oil Futures on MCX are trading around **₹5,460–₹5,500**. After a sharp correction from ₹6,500 levels, prices finally took support near **₹5,100**, which acted as a major base. Since then, the price has started forming higher lows, showing that buyers are slowly returning to the market.
However, the price is still below the key resistance zone, which means bulls need a confirmed breakout before a strong rally begins.
2. Important Support Levels
🟢 Major Support – ₹5,100 to ₹5,144
This zone has become the strongest base for crude oil. The market took multiple rejections from this level before bouncing back. As long as crude stays above ₹5,100, the overall structure remains positive for a possible up-move.
🟢Latest Support – ₹5,485 to ₹5,515
This is the immediate support zone just below the current price. If crude oil manages to hold above this range, it could confirm short-term bullish strength. A close below this support might again push prices toward ₹5,100.
3. Key Resistance Levels
🔴 Resistance Zone – ₹5,980 to ₹6,021
This is the first major resistance zone to watch. If prices move above ₹5,700 (first breakout level) and sustain, crude could attempt to test ₹6,000. Historically, sellers have been active near this area, so it will be a tough barrier for bulls.
🔴 Major Resistance – ₹6,520 to ₹6,580
This is the long-term resistance zone. If crude oil manages to break above ₹6,600 decisively, it will mark the beginning of a strong bullish phase. Such a move could open the way toward ₹7,000 or higher in the coming months.
4. Short-Term Price Targets
🎯 First Target After Breakout: ₹5,700
Once crude oil breaks above ₹5,515 with good volume, the first upside target will be around ₹5,700.
🎯 Second Target: ₹6,000
Sustained momentum above ₹5,700 could push prices toward ₹6,000.
🎯 Major Target (Long-Term): ₹6,520–₹6,580
If the market breaks ₹6,000 convincingly, bulls may aim for this long-term resistance zone.
5. Market View and Strategy
Short-Term View:
Neutral to slightly bullish as long as the price stays above ₹5,485.
Medium-Term View:
A clear breakout above ₹5,700 can trigger a move toward ₹6,000 and ₹6,500 levels.
Risk Zone:
A close below ₹5,100 will turn the sentiment negative, possibly retesting the ₹4,430 level (previous low).
6. Conclusion
Crude oil is showing early signs of recovery, but it still needs confirmation through a breakout above ₹5,700. Holding above ₹5,485 support will be crucial in the short term.
For swing traders, the best strategy could be to buy on dips near ₹5,200–₹5,300 with a stop loss below ₹5,100 and targets at ₹5,700 and ₹6,000.
Overall, the trend remains cautiously bullish, but traders should wait for a confirmed breakout before making aggressive entries.
 Long
Long
BTCUSD Technical Analysis – Imp Levels to WatchBitcoin (BTC/USD) Technical Analysis – Key Levels to Watch (Nov 2025 Update)
Bitcoin is currently showing a sideways-to-weak trend as the price struggles to stay above the $107,000 zone. After reaching its recent high near $125,000, BTC faced selling pressure and started moving lower. Let’s look at the important support and resistance levels that can guide traders in the coming days.
Current Price Action
Bitcoin is trading near **$107,700**, and this area is becoming a key decision zone. The chart shows that buyers are trying to defend the support around **$106,976**, but so far, they are not able to push prices strongly upward. On the other hand, sellers are active near the resistance zone of **$111,000–$112,000**.
This indicates that Bitcoin is stuck in a short-term range between **$107,000 and $111,500**, and a breakout from this range will decide the next move.
Resistance Levels (Upside Targets)
1. Resistance 1 – $110,974 to $111,545:
This is the first barrier BTC needs to cross for any upward momentum. If Bitcoin breaks this level with strong volume, it can move higher toward the next targets.
2. Resistance 2 – $116,500 (First Target):
Once the first resistance is cleared, BTC could aim for this level. This area has seen heavy selling earlier, so bulls will need strong buying power to move above it.
3. Resistance 3 – $125,000 (Third Target):
This is the upper resistance and the recent swing high. If Bitcoin manages to break and close above $125,000, it will confirm a strong bullish trend, and we could see new highs later.
Support Levels (Downside Targets)
1. Immediate Support – $106,976:
This level is acting as the first support for now. If it holds, BTC might bounce back toward $110,000.
2. Downside First Target – $103,500:
If Bitcoin breaks below $106,000, the next target on the downside could be around $103,500. This will show short-term weakness in the market.
3. Latest Support – $98,600 to $99,700:
This zone is very important because it acted as a strong base in the past. Many buyers may re-enter the market here.
4. Demand Zone / Support 2 – $89,000 to $90,700:
This area is called the “Demand Zone.” If prices fall this low, we can expect a strong buying reaction as long-term investors might find this level attractive.
5. Final Support – $78,600 to $79,700:
This is the last strong support on the chart. A fall below this level would signal a major trend reversal from bullish to bearish.
"Summary"
Right now, Bitcoin’s short-term trend is sideways to slightly bearish** until it breaks above $111,500. If BTC holds above $107,000 and breaks the first resistance, we can expect recovery toward $116,000 and then $125,000.
However, if it slips below $106,000, the price may test $103,500 or even $99,700 in the coming sessions.
Traders should watch these levels carefully and avoid over-leveraging during sideways market conditions.
Short 
 Long
Long
Long 
Long 
POLYCAB INDIAThe stock has been in a strong uptrend since mid-2024, forming higher highs and higher lows consistently.
A well-defined ascending trendline supports the move.
Price had a fakeout below the trendline earlier (March 2025) but quickly recovered, confirming strong demand.
The supply zone around ₹7,700–₹7,800 has acted as a major resistance level multiple times.
Now, the price has broken out above this supply zone with strong momentum — confirming a bullish breakout.
🔍 Technical Structure
Key Zone Level Remarks
Support Zone (Previous Supply) ₹7,650–₹7,750 Breakout zone – likely to act as support on retest
Trendline Support Rising trendline near ₹7,400 Long-term support zone
Immediate Resistance ₹8,000 Round number, short-term barrier
Next Major Resistance / Target ₹8,400–₹8,500 Previous swing projection / measured move
⚙️ Trade Plan
✅ Entry
Aggressive Entry: At current price (~₹7,840–7,860) — as price has broken out above supply with good volume.
Conservative Entry: On retest of the breakout zone ₹7,700–7,750, if price holds and shows bullish candle confirmation.
🛡️ Stop-Loss (SL)
Keep SL below ₹7,500, just under the trendline and breakout zone.
→ This protects against false breakouts.
🎯 Targets
Target 1: ₹8,000–8,050 (immediate breakout confirmation zone)
Target 2: ₹8,400–8,500 (measured move from previous range)
⚖️ Risk–Reward Example
If entered at ₹7,750:
SL: ₹7,500 (Risk = ₹250)
T1: ₹8,050 (Reward = ₹300 → R:R = 1.2:1)
T2: ₹8,500 (Reward = ₹750 → R:R = 3:1)
📈 Technical Bias
✅ Uptrend intact
✅ Breakout above strong resistance
✅ High volume confirmation
✅ Strong price structure above trendline
Bias: Strongly Bullish (Momentum + Breakout Confirmation)  Long
Long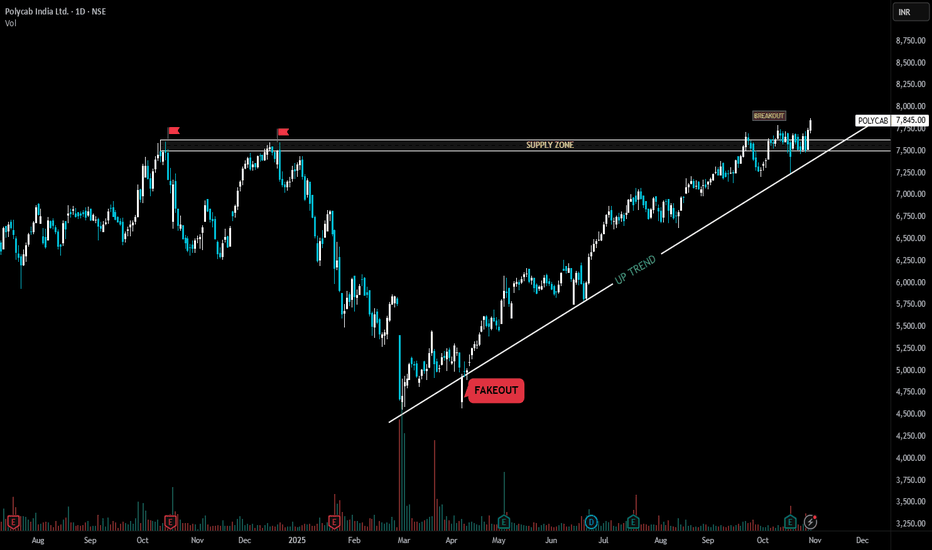
CHALET HOTELS TECHNICAL ANALYSISLooking at the chart, it’s pretty clear the stock has been in a short-term downtrend after forming a peak around the September high near ₹1,068, but it has now started to stabilize and show signs of reversal.
We can see a classic inverse head and shoulders pattern forming —
Left Shoulder around early October,
Head near mid-October (the lowest point), and
Right Shoulder forming recently.
At the head, there’s a bullish engulfing candle, which signals strong buying interest and potential reversal. The neckline (resistance turned support) sits roughly around ₹936–940, and the price has broken above it, confirming the bullish structure.
📊 Price Structure & Zones
Support (SEP LOW): ₹936
→ This level held multiple times, showing buyers are active here.
Immediate Resistance / Supply Zone: ₹980–₹995
→ Expect some profit booking or sideways action in this region.
Major Resistance (Target): ₹1,068 (September high)
→ If price sustains above ₹995, it can easily rally toward this zone.
⚙️ Trading Plan
✅ Entry Options
Aggressive Entry:
Around current price (₹960–965) since breakout is confirmed.
Conservative Entry:
Wait for a pullback to ₹940–950 zone and buy on a bullish candle confirmation.
🛡️ Stop-Loss (SL):
Keep SL below ₹925, under the right shoulder / recent swing low.
→ If price falls below this, the pattern fails.
🎯 Targets
Target 1: ₹985–995 (intermediate resistance zone)
Target 2: ₹1,068 (measured move from inverse head & shoulders pattern)  Long
Long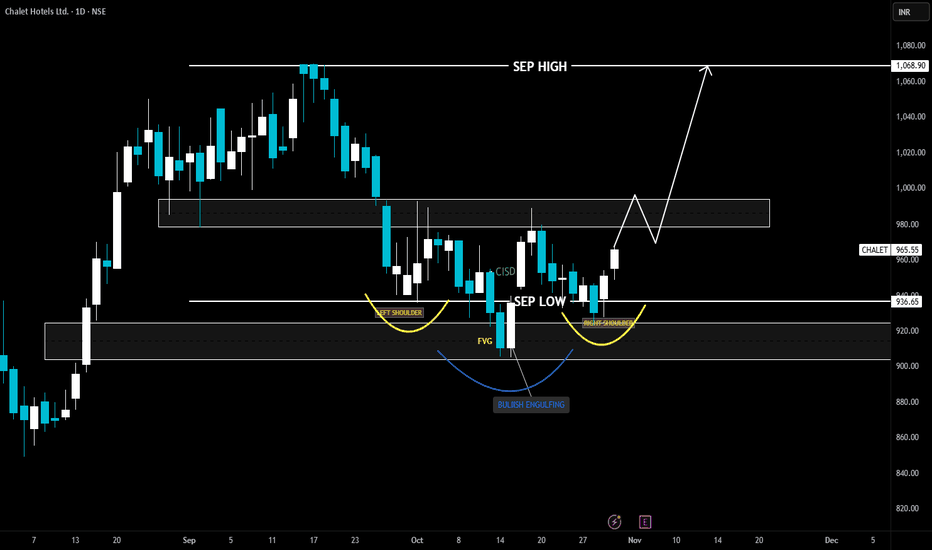
Short 
NUVAMA | Bullish Engulfing + VWAP Alignment📈 NUVAMA | Bullish Engulfing + VWAP Alignment + Strong Momentum Reversal 🚀
🔹 Entry Zone: ₹7,420.50 – ₹7,436.00
🔹 Stop Loss: ₹7,151.90 (Risk ~284 pts)
🔹 Supports: 7,244.33 / 7,068.17 / 6,972.33
🔹 Resistances: 7,516.33 / 7,612.17 / 7,788.33
🔹 Swing Demand Zone: ₹7,086 – ₹6,998.50
🔹 Intraday Demand Zone: ₹7,253.50 – ₹7,223
🔑 Key Highlights
✅ Bullish Engulfing Candle – powerful reversal confirmation
✅ VWAP Alignment – institutional bias turning bullish
✅ Momentum Strength – bullish follow-up after base formation
✅ Bollinger Squeeze-Off – volatility expansion expected
✅ Volume near average – healthy buyer participation, stable accumulation
🎯 STWP Trade View
📊 Strong bullish momentum supports a near-term rally toward ₹7,516–₹7,612. Sustaining above ₹7,612 could open upside potential to ₹7,788.
⚠️ The ₹7,253–₹7,223 zone provides intraday support, while ₹7,190–₹7,165 acts as a swing base for positional buyers to watch.
💡 Learning Note
This setup demonstrates how a Bullish Engulfing pattern with VWAP confirmation offers a reliable multi-signal entry. When aligned with tight demand zones, it allows traders to manage risk effectively while capitalizing on short-term breakouts.
Final Outlook: Momentum: Strong, Trend: Bullish, Risk: Low, Volume: High
________________________________________
________________________________________
⚠️ Disclosure & Disclaimer – Please Read Carefully
The information shared here is meant purely for learning and awareness. It is not a buy or sell recommendation and should not be taken as investment advice. I am not a SEBI-registered investment adviser, and all views expressed are based on personal study, chart patterns, and publicly available market data.
Trading—whether in stocks or options—carries risk. Markets can move unexpectedly, and losses can sometimes exceed the money you have invested. Past performance or past setups do not guarantee future results.
If you are a beginner, treat this as a guide to understand how the market works and practice on paper trades before risking real money. If you are experienced, always assess your own risk, position sizing, and strategy suitability before entering trades.
Consult a SEBI-registered financial adviser before making any real trading decision. By engaging with this content, you acknowledge full responsibility for your trades and investments.
Position Status: No active position in NUVAMA at the time of analysis.
Data Source: TradingView & NSE India (Past Chart Reference) (Historical levels)
💬 Found this useful?
🔼 Give this post a Boost to help more traders discover clean, structured learning.
✍️ Drop your thoughts, questions, or setups in the comments — let’s grow together!
🔁 Share with fellow traders and beginners to spread awareness.
👉 “If you liked this breakdown, follow for more clean, structured setups with discipline at the core.”
🚀 Stay Calm. Stay Clean. Trade With Patience.
Trade Smart | Learn Zones | Be Self-Reliant 📊  Long
Long
BPCL (D): Forms Bullish MorningStar, Challenges Major ResistanceAfter reversing from a short-term downtrend, BPCL (Bharat Petroleum Corporation Ltd) has flashed a powerful bullish signal. However, this newfound momentum is now running directly into a major, long-term resistance trendline that has capped its progress, setting the stage for a critical battle.
The Bullish Setup: A Morning Star at Support
Today's price action (Monday, October 27, 2025) was highly constructive for the bulls:
- Price & Volume Surge: The stock rallied +3.80% on a strong volume of 11.77 million shares .
- Classic Reversal Pattern: This move completed a "Morning Star" candlestick pattern . This is a classic three-candle bullish reversal pattern that often signals the bottom of a downtrend and a new shift in momentum.
Broad-Based Technical Strength
This bullish pattern is strongly supported by a powerful alignment of indicators across all major timeframes (Monthly, Weekly, and Daily):
- Short-Term EMAs: All three timeframes are in a bullish Positive Crossover (PCO) state.
- RSI (Relative Strength Index): The RSI is also in a rising trend on all three timeframes.
This multi-timeframe alignment indicates that the underlying momentum is broad, synchronized, and strengthening.
The Immediate Hurdle: Long-Term Resistance
Despite these bullish signals, the stock is now positioned less than 2% below a major long-term resistance trendline formed since its All-Time High. This line represents a significant historical barrier for the stock.
Outlook and Key Levels to Watch
The stock is at a clear "prove it" moment. The outcome of the battle at this resistance will likely determine the next major move.
- Bullish Breakout Scenario: A decisive close above the long-term resistance on high volume would confirm the breakout and validate the Morning Star pattern. This would signal a continuation of the new uptrend, with a potential next target of ₹375 .
- Bearish Rejection Scenario: If the stock fails to breach this resistance and momentum fades, it could be rejected. The first key support level would be the bottom of the Morning Star pattern, around ₹325 .
In conclusion, the price action in the coming days is critical. All eyes should be on this key resistance level for either a confirmed breakout or a rejection.  Long
Long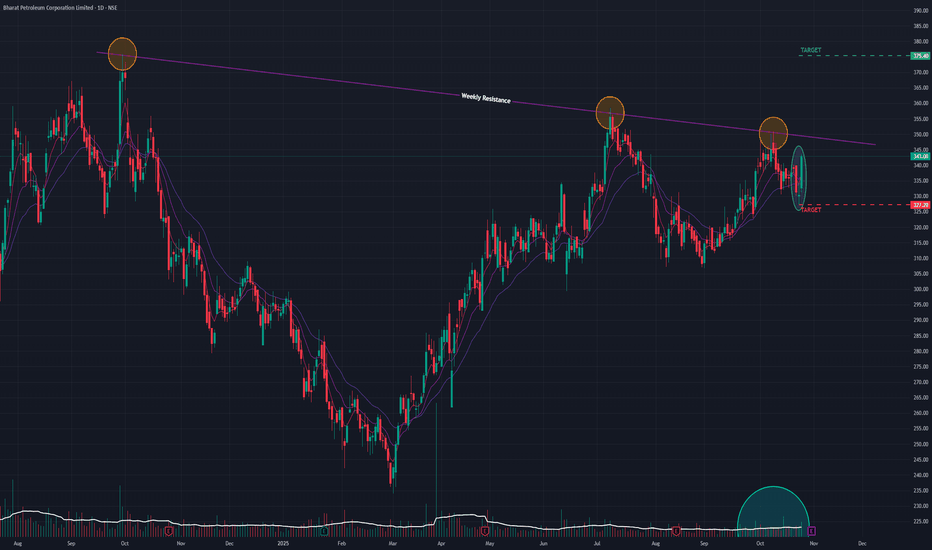
Long 

 Long
Long
 Long
Long


