Candlestick Analysis
BRITANNIA - Falling Wedge + Bullish Engulfing Combo💹 Britannia Industries Ltd (NSE: BRITANNIA)
Sector: FMCG | CMP: ₹5,892.50 | View: Falling Wedge + Bullish Engulfing Reversal Setup
📊 Price Action:
Britannia is currently displaying a strong confluence setup where both a chart pattern and a candlestick pattern align perfectly to signal a potential trend reversal.
After weeks of consolidation within a downward-sloping structure, the stock has formed a Falling Wedge pattern — a classic bullish reversal formation.
Adding strength to this structure,
OGS LONGHello traders,
I'd like to post my analysis on OGS with a more timely and actionable observation. While the consolidation range of $79.50 - $83.10 is still valid, a clearer entry signal has just presented itself.
Context: Following the significant breakout on the week of September 22, OGS has been in a healthy consolidation.
Key Observation: The stock has now pulled back to test the precise level of its former breakout resistance. This "resistance-to-support flip" is a classic bullish confirm
Aster DM Healthcare Ltd – Head & Shoulders Pattern with Doji at Aster DM Healthcare is currently forming a Head & Shoulders pattern, indicating potential short-term distribution after a strong uptrend. The right shoulder has developed with a Doji candle near support — suggesting indecision and possible reversal or continuation depending on the next few sessions.
The stock is hovering around its golden zone (₹640–₹660) — a critical area to watch for either a bounce or a breakdown. Sustaining above this zone can lead to recovery, while failure to hold it coul
Crude Oil Futures Technical Analysis with TargetsCrude Oil Futures (MCX) Technical Analysis – Key Levels and Price Outlook
(November 2025 Update)
- Crude oil prices have shown some recovery this week after a continuous downtrend seen in October.
- The market is now trying to build a base above ₹5,100 and looks ready for a possible short-term bounce if bulls manage to sustain above support levels. Let’s break down the current chart structure, support, resistance, and targets in detail.
1. Curre
BTCUSD Technical Analysis – Imp Levels to WatchBitcoin (BTC/USD) Technical Analysis – Key Levels to Watch (Nov 2025 Update)
Bitcoin is currently showing a sideways-to-weak trend as the price struggles to stay above the $107,000 zone. After reaching its recent high near $125,000, BTC faced selling pressure and started moving lower. Let’s look at the important support and resistance levels that can guide traders in the coming days.
Current Price Action
Bitcoin is trading near **$107,700**, and this area is becoming a key decision zone.
Bharti Airtel is still in a bull run?Major trend of the stock is bullish and repitition of a previous pattern is a possibility.
In this trade I will be trading a pattern, in fact 2 candle and 5 candle patterns.
Rising Three Method is there in the monthly charts
Bullish engulfing pattern formation on the 3 month chart.
Entry:- 1970
Risk :- 1880 (4.523960-%)
Reward :- 2360 (19.8%)
R:R is good, pattern setup is good.
Wait for the price to approach around my buying area.
Good bearish setup on the higher time frame.Asian paints is one of the leading paint manufacturer in country and for the last few months the stock is trading in a parallel channel there are chance of it trying to retest the previous support zone of around 2700 levels before entering into another bearish leg.
Fundamentally stock shows some negativity as ~45% YoY decline in consolidated net profit in Q4 FY25.
Revenue slipped 4.3% YoY in this quater. Net profit fell 23.3% YoY in Q3 FY 2025.
Technically too the stock look to form bearish F
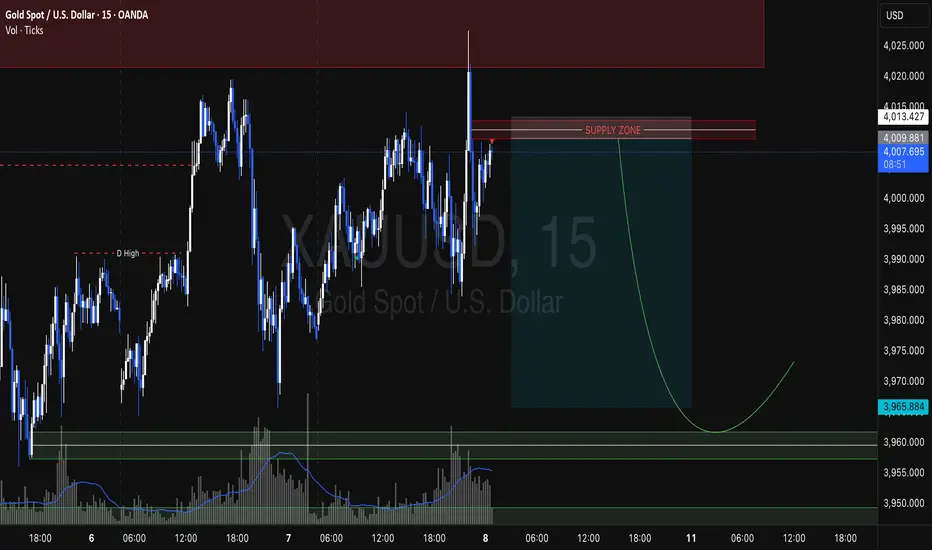
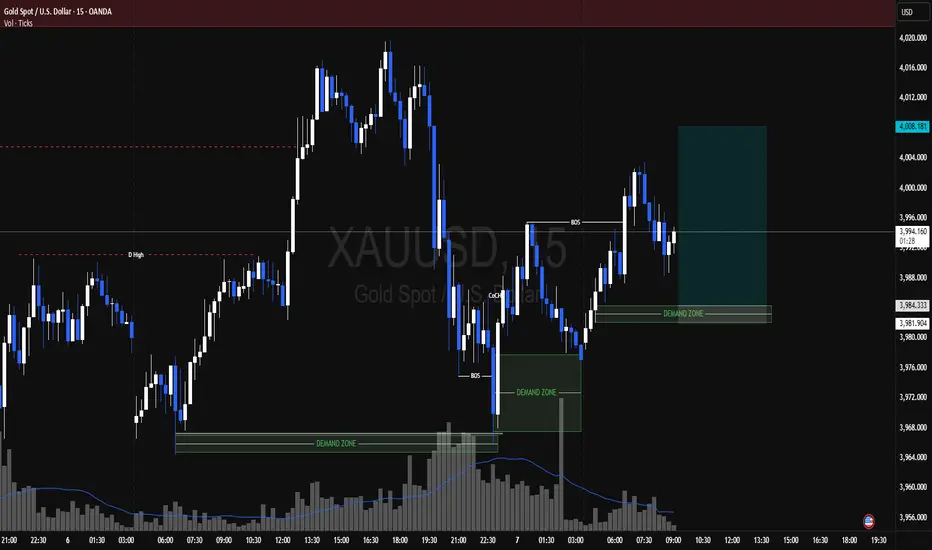
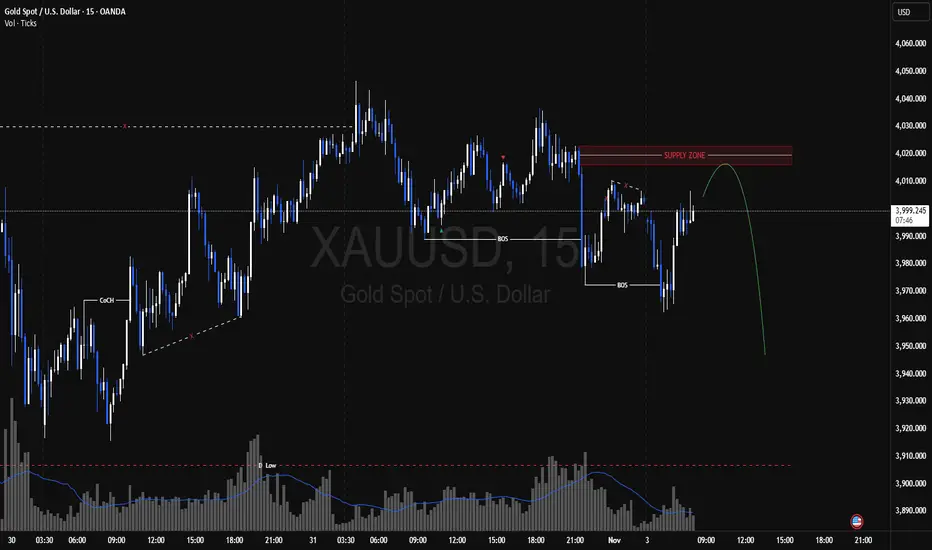
XAUUSDGold has been going down from the beginning of the week. There is possibility of retracement to the up side and take out Buy side liquidity.
Price slows down as it moves down.
Daily is closing bullish. Giving us Inside bar.
We can expect a sell side liquidity sweep and then reverse to target buy side liquidity.
Expect a pull back as price opens on Friday 31 Oct. then reverse to go up.
POLYCAB INDIAThe stock has been in a strong uptrend since mid-2024, forming higher highs and higher lows consistently.
A well-defined ascending trendline supports the move.
Price had a fakeout below the trendline earlier (March 2025) but quickly recovered, confirming strong demand.
The supply zone around ₹7,700–₹7,800 has acted as a major resistance level multiple times.
Now, the price has broken out above this supply zone with strong momentum — confirming a bullish breakout.
🔍 Technical Structure
Key Z
CHALET HOTELS TECHNICAL ANALYSISLooking at the chart, it’s pretty clear the stock has been in a short-term downtrend after forming a peak around the September high near ₹1,068, but it has now started to stabilize and show signs of reversal.
We can see a classic inverse head and shoulders pattern forming —
Left Shoulder around early October,
Head near mid-October (the lowest point), and
Right Shoulder forming recently.
At the head, there’s a bullish engulfing candle, which signals strong buying interest and potential rever
NUVAMA | Bullish Engulfing + VWAP Alignment📈 NUVAMA | Bullish Engulfing + VWAP Alignment + Strong Momentum Reversal 🚀
🔹 Entry Zone: ₹7,420.50 – ₹7,436.00
🔹 Stop Loss: ₹7,151.90 (Risk ~284 pts)
🔹 Supports: 7,244.33 / 7,068.17 / 6,972.33
🔹 Resistances: 7,516.33 / 7,612.17 / 7,788.33
🔹 Swing Demand Zone: ₹7,086 – ₹6,998.50
🔹 Intraday Demand Zone: ₹7,253.50 – ₹7,223
🔑 Key Highlights
✅ Bullish Engulfing Candle – powerful reversal confirmation
✅ VWAP Alignment – institutional bias turning bullish
✅ Momentum Strength – bullish follow-up after
BPCL (D): Forms Bullish MorningStar, Challenges Major ResistanceAfter reversing from a short-term downtrend, BPCL (Bharat Petroleum Corporation Ltd) has flashed a powerful bullish signal. However, this newfound momentum is now running directly into a major, long-term resistance trendline that has capped its progress, setting the stage for a critical battle.
The Bullish Setup: A Morning Star at Support
Today's price action (Monday, October 27, 2025) was highly constructive for the bulls:
- Price & Volume Surge: The stock rallied +3.80% on a strong v