Candlestick Analysis
Powergrid - 10% Upmove possible?!!!Chart patterns suggest me the above titled opinion
1. Monthly chart shows a Mother baby candle (feb and march 2025)
2. Weekly chart too shows a good inside bar candle with good volume support and Breakout visible (shown below)
3. In daily time frame, there is an expanding channel pattern... . Higher high formed indicates a bulls edge .
4.Let's wait for the Breakout and enter the trade
5.Target levels mentioned @ chart.
This is just my opinion...not a tip nor advice...
Thank you!!!!
Positional or longterm opportunity in CESCGo Long @ 139.6 for Targets of 165, 185.8, and 276.5 with SL 124.2
Reasons to go Long :
1. On a Weekly timeframe if we draw the Fibonacci retracement tool from the recent swing low (point A) to the recent swing high (point B) then we see stock took support from the 0.618 Fibonacci level.
2. Besides, a bullish candlestick pattern Bullish Engulfing (marked with orange) is formed around the 0.618 Fibonacci level.
3. Also there is a strong Trendline (marked with green color) which earlier was ac
EDELWEISS FIN SERVE LTD - BUY/LONG TRADEThere is bullish head and shoulder formation on edelweiss fin serve ltd. given breakout on daily time frame with supporting volume . one can look to buy if next candle hold above breakout candle high with mention target and without stoploss as i will update when to exit.
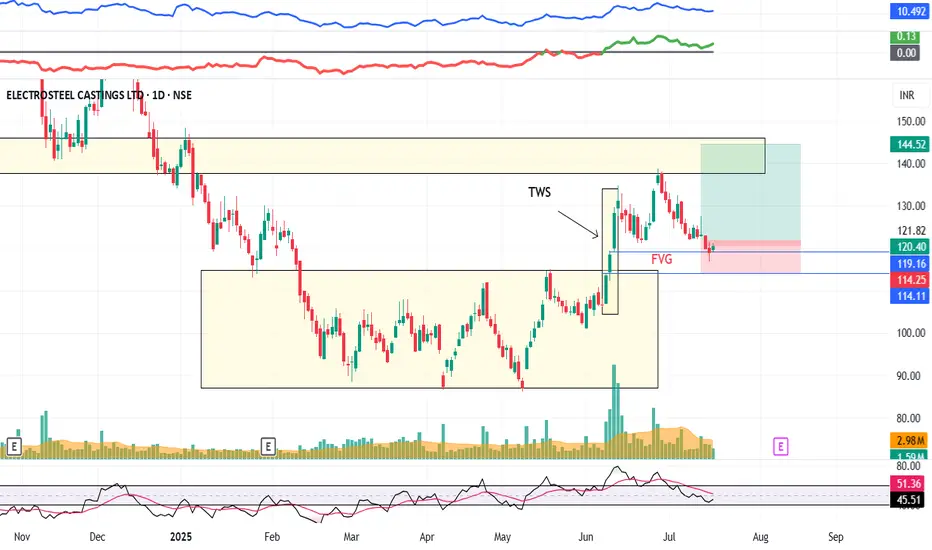
ELECTCAST : Swing Trade#ELECTCAST #ThreeWhiteSoldiers #fairvaluegap #stage1breakout #breakoutstock #Trendingstock
ELECTCAST : Swing Trade
>> Low PE Stock
>> Stage 1 Breakout & Retest done
>> TWS & FVG Visble
>> Liquidity Sweep Visible
>> Volumes Dried up
>> Stock gaining strength
Swing Traders can lock profit at 10% and keep Trailing
Please Boost, comment and follow us for more Learnings.
Note : Markets are still Tricky and can go either ways so don't be over aggressive while choosing & planning your Trades, Calc
Nifty Holds Positive Trend, BankNifty Eyes New High - Key LevelsThe missing piece we talked about yesterday — a close above 25200 — is now complete.
Selling pressure has reduced, although we didn’t get the strong follow-up buying we expected.
But from a trading perspective, today was superb:
- NSE:SPORTKING , which we bought yesterday, gained another 7% today.
- NSE:EDELWEISS intraday setup delivered a solid 6% move.
- NSE:TATAPOWER ATM options shot up by 100%.
- As mentioned in yesterday’s commentary, NSE:CNXPSUBANK performed well — I’m holdi
MTNL's Comeback Story: Innovation and GrowthRevitalizing MTNL: A Bright Future Ahead
Target: ₹200
Time frame: 3 years
Mahanagar Telephone Nigam Limited (MTNL), a Public Sector Undertaking (PSU), has faced significant challenges in recent years, leading to a decline in its business fortunes. However, despite being knocked out of the competitive telecom market, the company is poised for a resurgence.
Embracing New Frontiers
As the telecom landscape evolves, MTNL is gearing up to tap into emerging opportunities. The future holds immense
Pivot Low Formed, Follow-Up Buying Crucial – Nifty and BankniftyYesterday, i mentioned that sellers’ volume was 40 million higher than buyers, and for a new trend to emerge, today’s candle needed to absorb that supply.
And look what happened — today, buyers’ volume surpassed sellers’ by 82 million.
All the setups I traded today blasted exactly as expected:
NSE:SWARAJENG (Earnings Pivot) – +10%
NSE:SPORTKING – +5.92%
NSE:MOBIKWIK – +4.16%
For the short term, I am still holding NSE:CUPID , which has already given a 22% move in the last 3 session
July is Historically a Bullish Month for NiftySaid earlier that NSE:NIFTY could pull back till 25000 and then bounce. And that's exactly what happened.
The quarterly rotation in the market seems to have completed. And today, supply started getting absorbed.
I’ve already mentioned before — July has historically been a positive month for the markets, and that view still stands.
The outlook remains bullish.
Today’s candle in Nifty is a demand candle — it has absorbed nearly half of the selling pressure.
However, the remaining supply i
Nifty possible movement for the upcoming trading session.Nifty closed around the support zone forming a long lower tail showing some bullishness today.
Though the market has moved after a long time and can move on the either side.
Levels are marked and possible movements are also plotted.
Wait for the price action and trade accordingly.
Banknifty analysis for the upcoming movement in the index.Banknifty has been trading in a range for a long time and is now trading around the support levels of 56600.
The RSI indicator on the daily charts is showing some bearish divergence and today the market has taken a halt after 2 days of fall.
If the market starts travelling on the lower side there are chances of testing the lower support level of 56120.
The market has been trading in a range of 56600 to 57600. And the support is tested many a times.
Bullish trades can be initiated for intrada
Nifty ready to Bounce As mentioned in Friday’s commentary — a gap-down was expected in NSE:NIFTY , and that’s exactly what we saw.
I highlighted that the gap-down could happen below 25285 — and the market opened at 25255.
A bounce was expected near 25333 — and the bounce actually came, up to 25322.
It was clearly stated that selling should be done on bounce — and from there, the market dropped nearly 180 points from the high.
In short — the analysis played out exactly as planned.
Now, since everything is moving
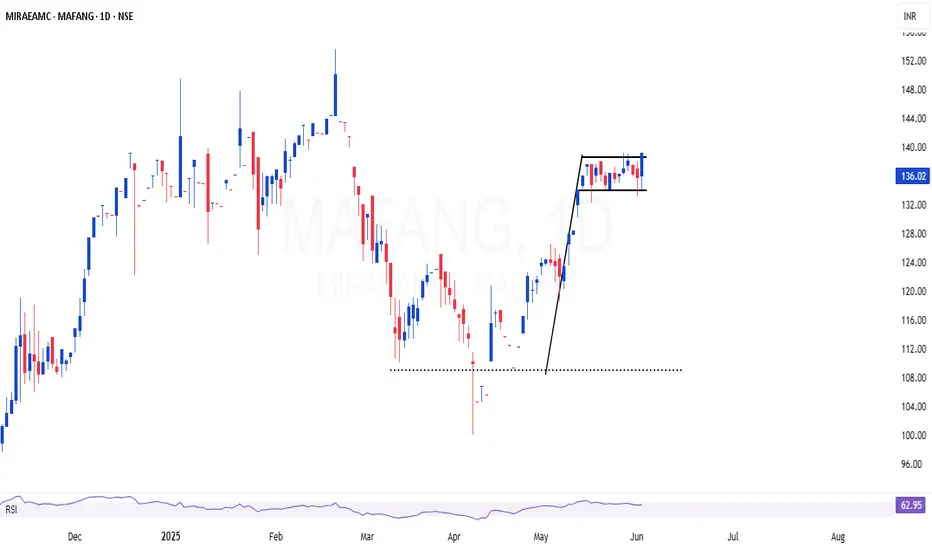
MAFANG | Excellent bull flag setup in top class index fundMAFANG 🏁| Strong buy in top class index fund 👌
-Strong uptrend supported by volume
-Consolidation near all-time highs — bullish structure
-Global tech dominance + AI tailwinds
MAFANG (Meta, Apple, Facebook, Amazon, Netflix, Google) is showing solid momentum and forming a strong technical base in a top-tier index fund.