LINK 4H Analysis — Sixth Test Incoming: Can the Resistance Final⏱ Timeframe: 4H
Key Resistance: $16.50 (1H-based level)
Number of Touches: 5 prior touches, 6th approaching
🔍 Market Context
The $16.50 resistance zone has been tested five times, and we’re now approaching the sixth test.
➤ According to price action principles, the more a level is tested, the weaker it becomes — increasing the probability of a breakout.
The last reaction (5th touch) was weak, indicating that sellers may be running out of strength.
Bullish momentum is strong — a cluster of str
Candlestick Analysis
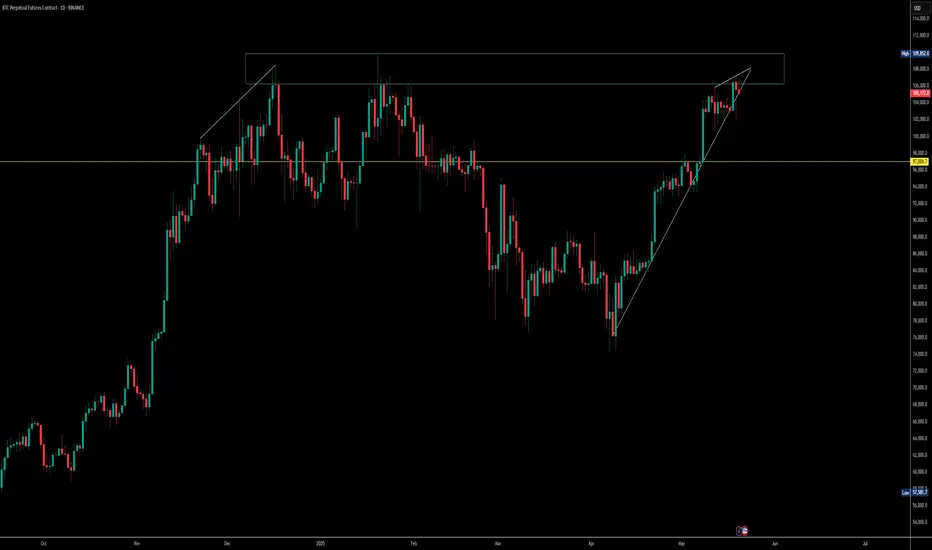
$BTC Facing Strong Rejection – Correction Ahead?CRYPTOCAP:BTC is showing clear rejection signs from the trendline near the key resistance zone around $107,000, replicating the December 2024 - January 2025 structure.
Hanging Man candle near resistance
Bearish RSI divergence
MACD bearish crossover
Weak buying pressure vs growing selling volume
Stochastic RSI fading out
one retest around 97000$
If $90K support breaks, watch out for a deeper drop toward $60K.
Market structure suggests a smart correction is brewing. Don’t ignore the signs
HDFC Bank confirm target 1970 in 2025 HDFC Bank confirm target 1970 in 2025
HDFC Bank's stock presents a potential upside ranging from approximately 9% to 23% over the next year. The bank's strong financial performance and positive analyst sentiments support this optimistic outlook.
Analyst Price Targets for 2025
1. Motilal Oswal: Recommends a 'Buy' rating with a target price of ₹2,050, suggesting a potential upside of approximately 21% from the current pri
2 Candlestick Patterns That Actually Work — when used right !Intro:
Most traders learn candlestick patterns from cheat sheets —
Engulfing, doji, hammer, shooting star…
But not all patterns are created equal.
The key isn’t memorizing names — it’s understanding which ones hold real weight when used with structure.
Here are 2 powerful candlestick patterns that can shift the game — if you know when to trust them.
⸻
1. The Rejection Wick with Body Close Inside Structure (a.k.a. Rejection Candle)
What It Looks Like:
• A long wick that pierces above/below
DYCL RSI Breakout - D timeframeDYCL Dynamic cables daily chart. After exiting parallel channel, DYCL made double top formation and fell 41% breaking down neckline during Jan-Mar '25 correction despite good Q3 result YoY.
Now Daily chart displaying double bottom formation in price chart and RSI.
Mar 18 shows bullish harami and Mar 19 shows inverted hammer. Bullish patterns in daily chart. So far volume isn't satisfactory. May 17 (this week) Weekly chart shows hammer pattern, but RSI is taking nose dive. Let's see if daily
Escorts Kubota Ltd (NSE: ESCORTS) **Trade Idea – Escorts Kubota Ltd (NSE: ESCORTS)**
**Chart Setup:** Weekly timeframe
**Current Price:** ₹3,523 (as of May 13, 2025)
**Technical Structure:**
* The stock has bounced sharply (+12.5%) from a **long-term trendline support**.
* The trendline is aligned with a strong **horizontal demand zone** (\~₹2,800–3,100), which has held since early 2024.
* Structure indicates accumulation near support with bullish momentum resuming.
EURCHF LONGHey everyone
Im looking for a Buy after we break the Daily/4H resistance and retest from it but also we have mulitple confirmation:
1) Daily bullish, 4h bullish
2) after we break above our daily support we went down to retest our 61.80% Fib level
3) break our counter trend line and retest it
4) we need to break above our Daily/4H resistance level and wait for an engulfing bullish 1h/30 and then will get in
Good luck!!
Not all lines are Trends: Post about proper Trendlines
Introduction-:
Trendlines are often the first tool traders learn and ironically, one of the most misused. Drawing a line between two swing points may look convincing, but that doesn’t make it meaningful. A right trendline is not just about connecting dots it’s about capturing the heartbeat of the market.
In this post we will learn how to draw high quality trendlines that align with price structure, reflect momentum, and provide reliable trade signals. Whether we are scalper, swing trader, or p
Nestle India: Multiple times resistance and Breakout and retestNSE:NESTLEIND
Resistance becomes Support !
This has shown multiple times resistance levels see the red arrows on chart, on 9th Apr 2025 script has shown the breakout with increased volumes, on 09th May script has shown the Bullish candle at the previous resistance level which will work has support.
Buy above the high of Bullish candle at 2351
SL at 2269
Target at 2473.
NIFTY : Very bearish due to forming Bearish Divergence pattern
BEARISH DIVERGENCE -
Market has formed a higher high on the chart whereas rsi has formed a lower high which indicates a bearish divergence pattern. This indicates upcoming market fall
Bearish Divergence forms when market forms higher high & rsi forms lower high
BEARISH MACD -
The macd line recently crossed below the signal line inside the macd indicator forming bearish macd crossover. Market is likely to fall in the upcoming days due to this bearish signal
MACD indicator is the com
ETH Short Triggered — Here’s Why It Still Makes Sense
BINANCE:ETHUSDT Trade Breakdown – 🧠
🔹 Timeframe: 1H / 15min Trendline Focus
🔹 Position: Short
🎯 Cycle Overview:
• HWC (High Wave Cycle): Bullish 🔼 (but not strongly)
• MWC (Medium Wave Cycle): Ranging 🔁
• LWC (Low Wave Cycle): Weakly Bearish 🔽
Since this position is against the HWC (High Wave Cycle), I’ve reduced my risk. However, because the HWC is not strongly bullish and the MWC (Medium Wave Cycle) is ranging, taking a short position is still a valid option — as long as risk is properl
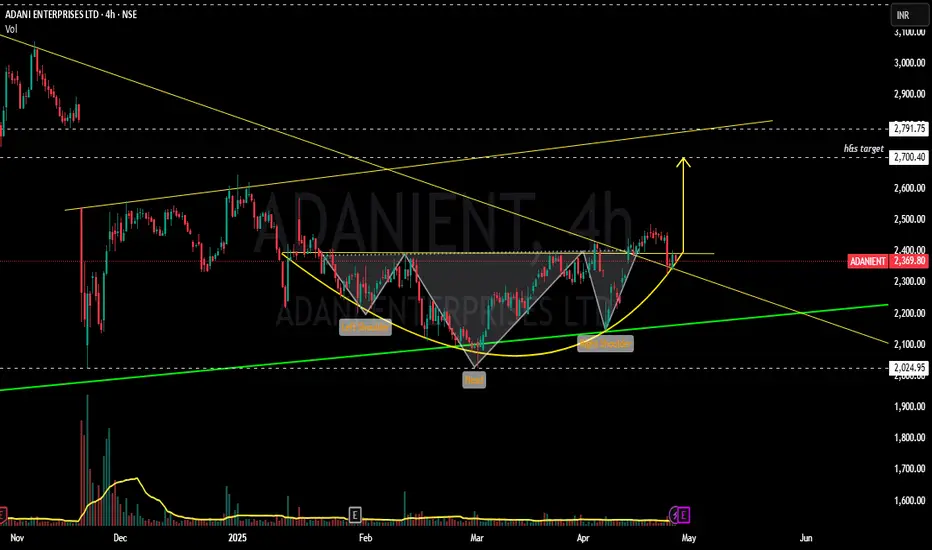
ADANIENT - Bulls getting ready to bump up ?????!!!Y essss!!! !
Chart patterns inculcating me the above titled opinion.
1. Monthly timeframe shows the symmetrical triangle pattern from 2020 till now, now the stock at support line(chart image shown below)
2. Weekly time frame shows us the INSIDE BAR candlestick pattern(mother baby pattern) with good volumes....with the low umtested till now.(made the low of 2025 on 22 nov 2024)
3. Daily time frame shows the Breakout attempt out of the 11 month old trendline.
4. Now, with the result
NIFTY - 50 Not easy to break at Weakly ResistanceThe Nifty 50, a benchmark index of the National Stock Exchange (NSE) in India, has shown a bullish trend recently, but its performance for the upcoming week (starting May 5, 2025) will likely be influenced by a mix of technical levels, macroeconomic factors, and market sentiment. Below is an overview based on recent analyses and market data:
Technical Analysis
Current Levels and Trend: The Nifty 50 closed at 24,313 on May 2, 2025, reflecting a bullish trend with a 0.24% weekly gain, a 4.98% mon
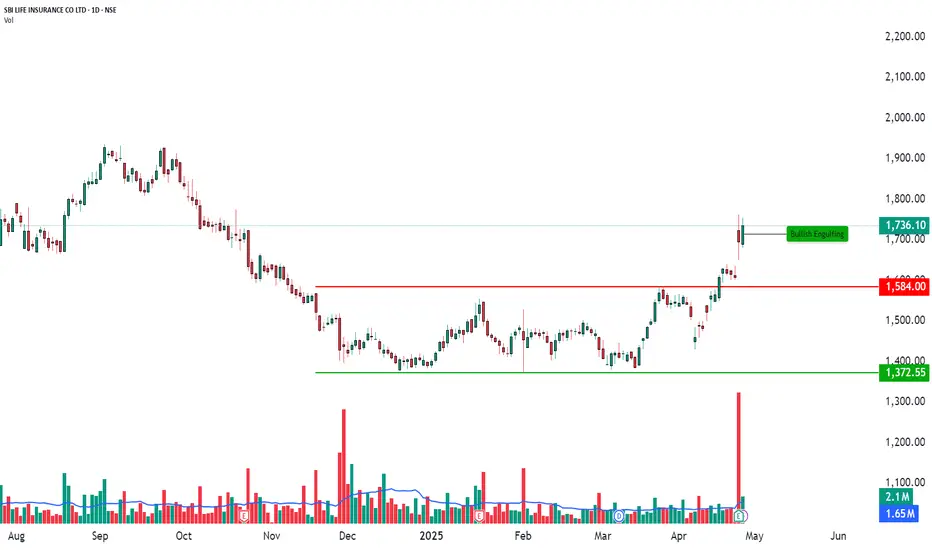
Breakout with Bullish Engulfing Confirmation | Daily Chart🏦 SBI LIFE INSURANCE CO LTD – Breakout with Bullish Engulfing Confirmation | Daily Chart
📅 Date: April 28, 2025
📈 Timeframe: Daily Chart
🔍 Stock: SBI Life Insurance Co Ltd (NSE)
📌 Technical Overview:
SBI Life is showing strong bullish momentum on the daily chart after breaking out above a key horizontal resistance around ₹1,584.
The price has formed a Bullish Engulfing candlestick pattern, indicating renewed buyer strength, backed by heavy volume.
🧩 Chart Pattern:
Strong horizontal resistance
MOL | One more time - trying to take position with stoplossMOL | One more time - trying to take position with stoploss
As this is my favorite stock, but its under performing for a long time. This setup looks good for 50-60% for short term.
Trendline + Small channel breakout
CMP : 70
SL : 65
Target : 110
The Four Powerful Candlestick PatternsHello TradingView Community and Friends here I am sharing the four of the most powerful candlestick patterns every trader should know especially to the new entrants to technical analysis and that are-: Hammer, Inverted Hammer, Bullish Engulfing, and Bearish Engulfing.
These patterns are not just visual shapes they reveal critical shifts in market sentiment and offer high probability trading opportunities when interpreted correctly.
I hope this article adds real value to your trading journey. F