Candlestick Analysis
Bank of Maharashtra Trendline Breakout Key Ratios
Capital Adequacy Ratio - 17.38% in FY24 vs 16.48% in FY22
Yield on Advances: 8.94% in FY24 vs 7.29% in FY22
Cost of Fund: 3.95% in FY24 vs 3.35% in FY22
NIM - 3.97% in FY24 vs 3.17% in FY22
Cost to Income: 37.55% in FY24 vs 44.26% in FY22
ROE: 23.8% in FY24 vs 11.5% in FY22
BITCOIN PRICE UPDATE – April 21, 2025🔴 BITCOIN PRICE UPDATE – April 21, 2025
💰The D1 chart of
BTC
is currently showing a pretty solid buying signal. From the 78k support zone, we can see that buyers have stepped in. Although the price has broken the downtrend line and there are positive signals from the MACD, I have the following observations that you should pay close attention to before making any trading strategy decisions during this period:
1. The trendline breakout signal doesn’t necessarily indicate that the market is ent
The Market Speaks in the First Hour Learn to ListenDear TradingView Community and Fellow Traders, Wishing you all a focused and fulfilling trading journey. Each day in the market brings its own rhythm, and recognizing that early can make all the difference. In this piece, I’m sharing a concept that continues to shape my intraday approach, the First Hour Range. It’s a simple yet powerful framework that can offer clarity right from the start of the session.
Let’s explore how the first 60 minutes can set the tone for the entire trading day.
Body-
Gold Technical - Weakly (21 To 26 Apr-2025)#GOLD (XAU/USD) Technical Analysis - April 19, 2025
Current Price & Trend: Gold is trading around $3,327 maintaining a strong bullish trend despite a slight retreat from its all-time high of $3,357 earlier this week. The price remains within an ascending channel, with higher highs and higher lows on the daily chart, confirming bullish momentum.
#ChartPatterns for your reference
#XAUUSD
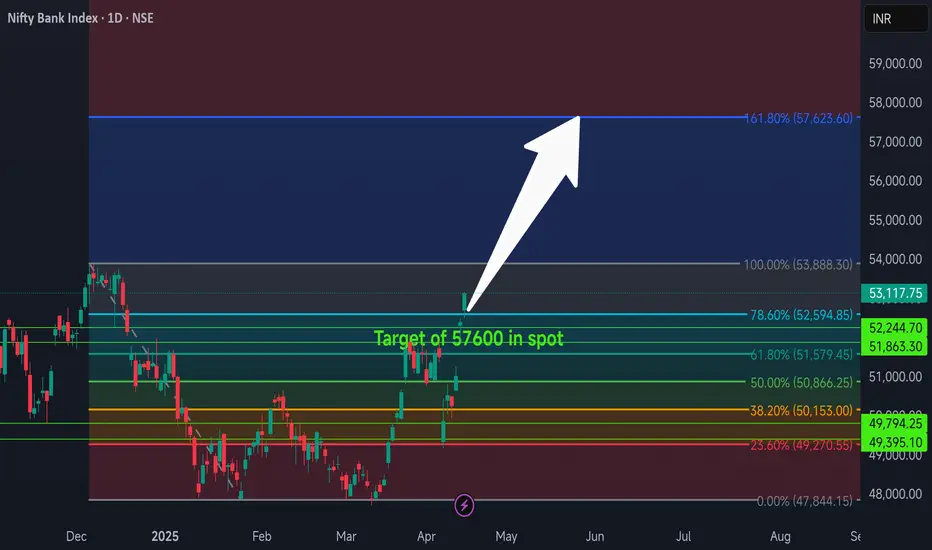
Clear upside direction in Banknifty for Indian Market. Soon ATHBanknifty has sustained above 50 sma and also has closed convincingly above the fibo channel of 78.6% on daily timeframe. Along with that long term trend and momentum indicators also have confirmed the bullishness. Once we see 50sma crossing above 200sma then the run will be extended and we will see an ATH after crossover happens on daily timeframe. The first target is 57600 and after that ATH
Positional or Longterm Opportunity in ABBGo Long @ 5432.1 for Targets of 6510, 7015, 7520, and 8024.7 with SL 439.15
Reasons to go Long :
1. On a Weekly timeframe if we draw the Fibonacci retracement tool from the recent swing low (point A) to the recent swing high (point B) then we see stock took support from the 0.5 Fibonacci level.
2. Besides, a bullish candlestick pattern Bullish Engulfing (marked with orange) is formed around the 0.5 Fibonacci level.
3. In addition to this there is a strong demand zone (marked with purple) whi
NACL Industries - Range Breakout Trade Setup🔥 NACL Industries - Range Breakout Trade Setup 🚀
📍 Breakout Level: ₹116
📍 Current Market Price (CMP): ₹121
📍 Stop Loss (SL): ₹96.5 (📉 Closing basis)
📍 Target 1 (T1): ₹166 🎯
📍 Target 2 (T2) (Positional): ₹255 🎯🎯
🔍 Why This Trade?
✅ Range Breakout 📈: Stock has broken out of a 3-year-old consolidation range!
✅ Big Money Inflow 💰: Breakout supported by high volume, indicating institutional buying.
✅ Bullish Pattern 📊: Formation of 3 White Soldiers on March 25 in DTF– a strong bullish signal! 🚀
✅
Bajaj Finserv in a bullish trend; Watch and trade?Bajaj Finserv has been in a good trend even when overall market remained negative, the stock has been trading around the recent highs.
There has been a Break out of the resistance zone but the market has formed a Tweezer top after the break out on the weekly charts.
If there is trend reversal of the indices, high chance of it forming new high while be there.
YTD the stock has posted 17% positive returns while the markets are down by the approximately the same percentage.
Major Resistance le
Positional or Longterm Opportunity in Axis BankGo Long @ 1005.05 for Targets of 1123, 1182, 1275.35, and 1320.4 with SL 960
Reasons to go Long :
1. On a Weekly timeframe if we draw the Fibonacci retracement tool from the recent swing low (point A) to the recent swing high (point B) then we see stock took support from the 0.382 Fibonacci level.
2. Besides, a bullish candlestick pattern Bullish Engulfing (marked with orange) is formed around the 0.382 Fibonacci level.
3. Also there is a strong Trendline (marked with green color) which supp
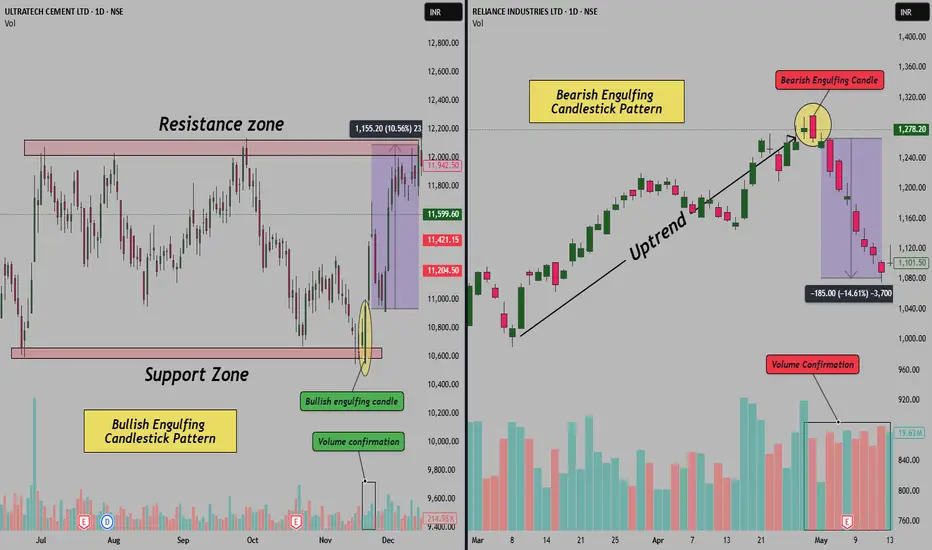
My Favorite Reversal Candle Pattern (Works Like Magic!)Hello Traders!
What if I told you that one single candlestick pattern could give you an 80% win rate — when traded with the right context and strategy? That’s right! Today, we’re talking about the powerful Engulfing Candlestick Pattern — backed by data, tested across timeframes, and loved by price action traders.
Let’s break it down properly so you can spot it, trade it, and win with it.
The Candle Setup: Bullish & Bearish Engulfing Patterns
Bullish Engulfing Pattern:
This forms a
Shooting Star Candlestick Pattern The Shooting Star is a key candlestick pattern that signals the end of an uptrend. It looks like a small body with a long upper shadow, and very little or no lower shadow. This pattern often appears at the peak of an uptrend and can indicate a potential reversal.
How to Identify the Shooting Star:
1) Long upper shadow: The upper shadow should be at least twice as long as the body.
2) Gap up: Price opens higher than the previous day’s close.
3) Small body near the bottom: The body of the candle
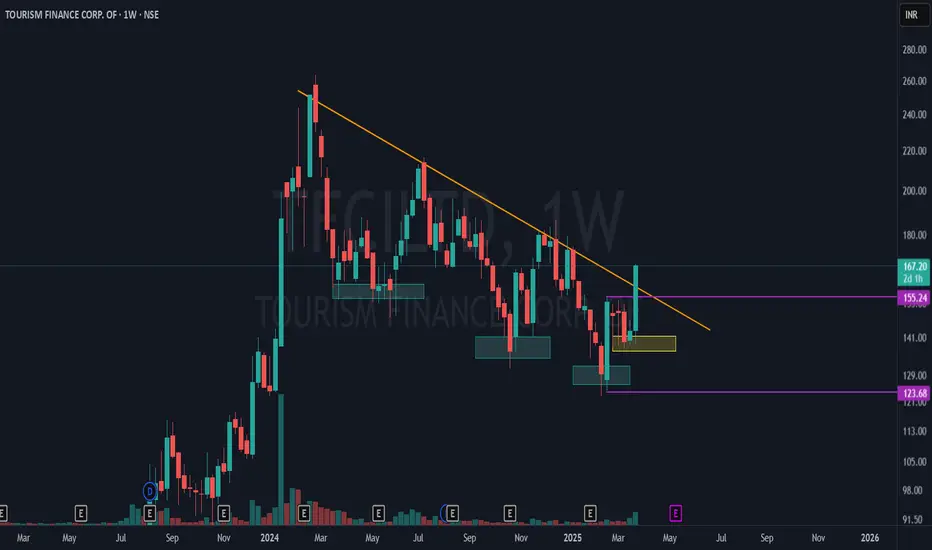
Tourism Finance Corp - Major Breakout in Progress!TFCI is showing a significant market structure shift on the weekly time frame (WTF) with strong confluence of technical signals! 📊
🔹 Lower Lows to Higher Low Transition:
Blue boxes indicate a series of lower lows, reflecting a prior downtrend.
The yellow box highlights a higher low, signaling a potential trend reversal!
🔹 Mother Candle Breakout:
The purple lines mark the high and low of the mother bar (key range).
Price is now breaking out from the upper side of the mother candle, confirming b
Tata Technologies Stock: A Critical Moment AheadTata Technologies stock has recently been trading near its lifetime low. After reaching an all-time high of ₹1400, the stock dipped to its lifetime low of ₹626.65 and is currently at ₹698.
📊 Bullish Engulfing Pattern: On the weekly chart, the stock has formed a bullish engulfing pattern with volumes significantly higher than the average. This is a potentially strong reversal signal.
🔑 Key Support and Resistance Levels:
The stock has previously found support around ₹1000 multiple times. If the
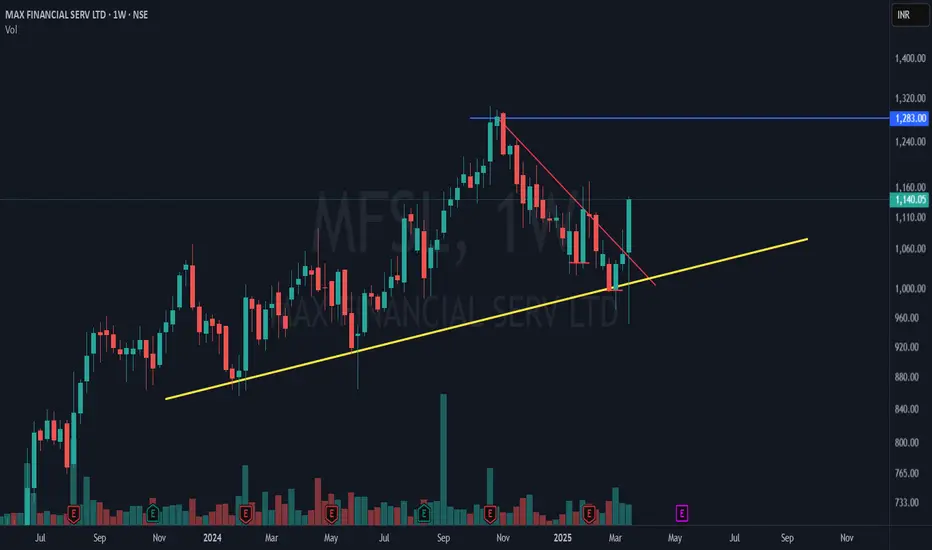
Max Financial Services Ltd – Trend Reversal in Play?🚀 Technical Analysis Breakdown:
The yellow trendline shows a long-term support, which has held well despite recent corrections.
The red downtrend line indicates a recent bearish phase, which has now been broken with a strong bullish candle.
The stock has bounced from the trendline support, showing signs of strength.
Above all the strong Pinbar candle looks amazing for a candle close .
🔎 Your Take? Do you see further upside or a pullback? Comment below! 👇
Positional or Longterm Opportunity in KfinechGo Long @ 918.55 for Targets of 1109.65, 1205.2, 1300.75, and 1491.85 with SL 439.15
Reasons to go Long :
1. On a Weekly timeframe if we draw the Fibonacci retracement tool from the recent swing low (point A) to the recent swing high (point B) then we see stock took support from the 0.618 Fibonacci level.
2. Besides, a bullish candlestick pattern Bullish Hammer (marked with orange) is formed around the 0.618 Fibonacci level.
3. In addition to this there is a strong demand zone (marked with p