Nifty 50 Weekly Analysis: Key Levels & Trend OutlookThe Nifty 50 ended the week at 23,350.40, recording a notable gain of 4.26%.
Key Levels for the Upcoming Week
🔹 Price Action Pivot Zone:
The critical range to monitor for potential trend reversals or continuation is 23,274 - 23,427.
🔹 Support & Resistance Levels:
Support:
S1: 23,046
S2: 22,743
S3: 22,427
Resistance:
R1: 23,658
R2: 23,965
R3: 24,227
Market Outlook
✅ Bullish Scenario: A sustained breakout above 23,427 may attract buying interest, potentially pushing Nifty
Candlestick Analysis
Bank Nifty Weekly Update & Key Levels📌 Weekly Recap:
Bank Nifty closed the week at 50,593.55, recording a strong gain of 5.27%.
Key Levels for the Upcoming Week
🔹 Price Action Pivot Zone:
The crucial range to watch for potential trend reversals or continuation is 50,482 - 50,707.
🔹 Support & Resistance Levels:
Support:
S1: 50,146
S2: 49,698
S3: 46,956
Resistance:
R1: 51,046
R2: 51,470
R3: 51,893
Market Outlook
✅ Bullish Scenario: A sustained move above 50,707 could drive buying momentum, pushing Bank N
Kalyani Steels trendline breakout - D timeframeKalyani Steels after achieving the target of 1179.50 exited parallel channel and held support at 700 range. Bullish reversal happened at 704.20 (mar 3) and bullish reversal confirmation at 721 (mar 17). Dec 17 '24 ATH to Mar 3 '25 precisely 44.86% fall as anticipated. Now price chart in daily timeframe showing double bottom with inverted hammer (Mar 19) along with RSI double bottom breakout. Weekly chart piercing line (i think) candlestick pattern along with RSI +ve divergence.
Nifty weekly analysis for 17/03/2025Nifty is trading between 100 EMA (weekly) and 20 EMA (daily). A good support from the weekly moving average is there and resistance on the daily charts.
A continuous support from 22300 level is there as the market has remained in a range whole week.
If the market tried to breach the support level, the support of weekly 100 EMA can be the other support around 22030 else it will take support around 21800.
In case the market starts to recover from the bottom and creates a higher high higher lo
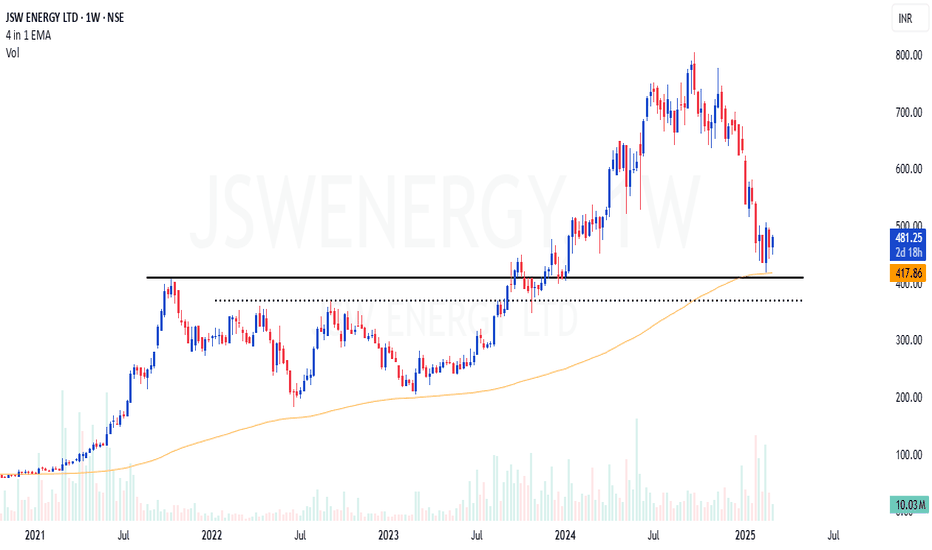
Positional or Longterm Opportunity in JSW EnergyGo Long @ 506.8 for Targets of 634.35, 709.75 and 777.4 with SL 439.15
Reasons to go Long :
1. On a Weekly timeframe if we draw the Fibonacci retracement tool from the recent swing low (point A) to the recent swing high (point B) then we see stock took support from the 0.5 Fibonacci level.
2. Besides, a bullish candlestick pattern Bullish Engulfing (marked with orange) is formed around the 0.5 Fibonacci level.
3. In addition to this there is a strong demand zone (marked with purple) which ea
Positional Opportunity in AptusGo Long @ 304.15 for a Target of 382.6 with SL 278
Reasons to go Long :
1. On a Monthly timeframe if we draw the Fibonacci retracement tool from the recent swing low (point A) to the recent swing high (point B) then we see stock took support from the 0.618 Fibonacci level.
2. Besides, a bullish candlestick pattern Bullish Hammer (marked with orange) is formed around the 0.618 Fibonacci level.
3. Also there is a strong Trendline (marked with green color) which supports the stock.
Coforge-A perfect watchlist stock!Coforge is an IT services company providing end-to-end software solutions and services and is among the top-20 Indian software exporters according to Screener data. Stock has give 20% compounded sales growth in last 5 years which is quite remarkable.
Hence, It can be a good stock to be kept in watchlist for medium to long term.
Stock had given breakout of cup and handle pattern in weekly time frame and is now retesting the same.
Stock has formed a kind of morning star pattern at the retest supp
Nifty weekly analysis for 10/03/2025.Is this the end of the fall or its just a retracement. The market after a while has given some hope of a green week.
It is a retest or a base formation no body knows. Nifty is trading around 22550 levels and looks somewhat positive for the coming week.
Market is still in the down trend and bullish trend will only be confirmed once a 'W' pattern is formed on higher time frame or a break out is done.
On the hourly charts, market remained in a range for the last trading session, the sideways m
#SDBLFundamentals:
* ROCE - 19.4%, ROE - 18.4%. Debt to Equity - 0.21
* EPS / Revenue - has been steadily increasing
* FII/FPI have increased holdings from 0.56% to 0.90% in Dec 2024 qtr.
* Institutional Investors have increased holdings from 0.57% to 0.92% in Dec 2024 qtr.
* Promoters have increased holdings from 35.33% to 36.32% in Dec 2024 qtr.
Technicals:
* Bullish Candlestick Patterns - Closing Marubozu Uptrend / Long Line Uptrend
* Weekly Chart shows that 10 WEMA is crossing above the 20 WEMA
Long Swing In PFC SPOTTED!After Correcting almost 40% from ATH.
Technical Analysis:
1. PFC has broken out of its Bearish Trend line with
2. Candle Stick Pattern shows Bullish Engulfing Pattern on
3.Weekly Time Frame (in formation) at
4. Demand Zone with
5. Bullish Divergent RSI on Daily Time Frame.
Above Factors Favour a Short Term Upmove.
Trade Details:
CMP 403
Buy Above 395
SL below 350
Target 460~470
Risk Reward Ratio - 1:2
Monthly Breakout On RSI & TrendlinePlease check Monthly Trendline over RSI - From 2018 to 2025 RSI Trendline Breakout done Last month & Sustain in crusial month also
Second thing if we check Trendlines over Chart - Stock is taking regular support from 2014 to till date
if we check from 2021 to till date consolidation zone - Stock is going to breakout this zone (final conformation above 2080, for Safest Entry)
But as per current scenario and situation i thing kotakbank will be a good choice if market start upward direction
Mahindra & mahindraM&M itself focuses primarily on mobility products and farm solutions. It’s a titan in India’s automotive sector, renowned for rugged SUVs like the Scorpio, Thar, and XUV700, and holds a dominant position in utility vehicles with an 11.4% market share, competing with Tata Motors, Hyundai, Kia, and Maruti Suzuki.
Chart for your reference
Understanding Bullish & Bearish Candles FormationHello Traders!
In today’s post, we’ll be discussing the Candlestick Formation setup, which is essential for reading price action and identifying potential trend reversals. Candlestick patterns are a crucial tool for traders to understand market sentiment and predict future price movements. Let’s break down the two most common formations: Bullish Candlestick and Bearish Candlestick .
Bullish Candlestick Formation Setup
What is a Bullish Candlestick?
A bullish candlestick appears
Positional or Long term Opportunity in Shipping Corp Of IndiaGo Long @ 205.7 for Targets of 241.1 and 276.5 with SL 188
Reasons to go Long :
1. On a Weekly timeframe if we draw the Fibonacci retracement tool from the recent swing low (point A) to the recent swing high (point B) then we see stock took support from the 0.618 Fibonacci level.
2. Besides, a bullish candlestick pattern Bullish Hammer (marked with orange) is formed around the 0.618 Fibonacci level.
3. Also there is a strong Trendline (marked with green color) which supports the stock.
4. I
Mastering the Three White Soldiers Pattern: A Bullish ReversalHello Traders!
I hope you're doing great in your trading journey! Today, we will be diving into the Three White Soldiers chart pattern, a powerful bullish reversal pattern that can help you spot a potential trend shift. This pattern typically occurs after a downtrend, signaling a strong reversal. If you can spot it early, it offers a high-reward trading opportunity. Let’s break down the pattern and how to use it effectively.
What is the Three White Soldiers Pattern?
The Three White Soldie
Three Black Crows: How to Spot and Profit from Bearish ReversalsHello Traders!
I hope you’re all doing great! Today, we’ll discuss the Three Black Crows candlestick pattern, one of the most reliable bearish reversal patterns you can find in technical analysis. If you're serious about identifying potential trend reversals, understanding this pattern is essential.
The Three Black Crows is a powerful bearish signal that typically marks the end of an uptrend. It consists of three consecutive long red (or black) candles that close progressively lower, sho
Weekly Wrap idea Got Confirm. Tradeplan #Nifty50 18th Feb2025First Step of a successful trader is to build a Trade plan & review what he has done. (education purpose for all )
*Trend is rangbound, Short term Bullish.
*Trade plan: Buy on dip.
*for Critical levels see the video
Jai Hind.
Disclaimer :
This video is only for educational purposes. Please consult your financial advisor before you take any trade.
Long In SBICARDEntry- 815-818
Stop- 800
Target- 840, 860,
Pattern- Falling trendline BO with a bullish engulfing in 4hr Time frame.
Note- This stock has been underperforming for a long time. It may continue its upward journey
* Please trade carefully seeing the current market structure the trend is to be cautious.
Disclaimer- This is just for education purpose please take advice from your financial advisor before making any decision.
Jai Shree Ram.
SRM CONTRACTORS - At Channel Support The stock has been travelling in an ascending channel respecting the borders in 4 previous instances. Within the channel, we have seen how the stock price action has been repeating itself. As the saying goes history repeats itself, this time again the stock has shown strength at the channel support which in my opinion seems to be indicating a possible rally towards the upper border of the channel. Only time will tell.
Company has reduced debt.
Company is expected to give good quarter
3 Years RO
Nifty 50: Market Structure Break on 60-Hour TimeframeMarket Structure Break: The 60-minute timeframe shows a clear structural break, pushing prices into a premium zone.
Premium to Discount Retracement: Given the overextended nature of the premium zone, a retracement to a discount zone is expected.
Potential Reversal: The retracement could lead to a reversal, where market momentum shifts, creating a more balanced trading environment.
Consolidation Point: The market is likely to consolidate around the 23400 level, a critical juncture that correspond