Candlestick Analysis
Nifty weekly expiry intraday levels for 25/12/2024Nifty has given a nice closing around the resistance zone and a good support on 20 EMA is there on 30 minutes.
Tomorrow is weekly expiry and a volatile trading day will be there as all the volume will be in this only index tomorrow.
Support levels :- 24460,24345
Resistance :- 24570, 24670
If market consolidate in the first half and gives a break out, trending move can be capture either side.
Wait for the price action near the levels before entering the market.
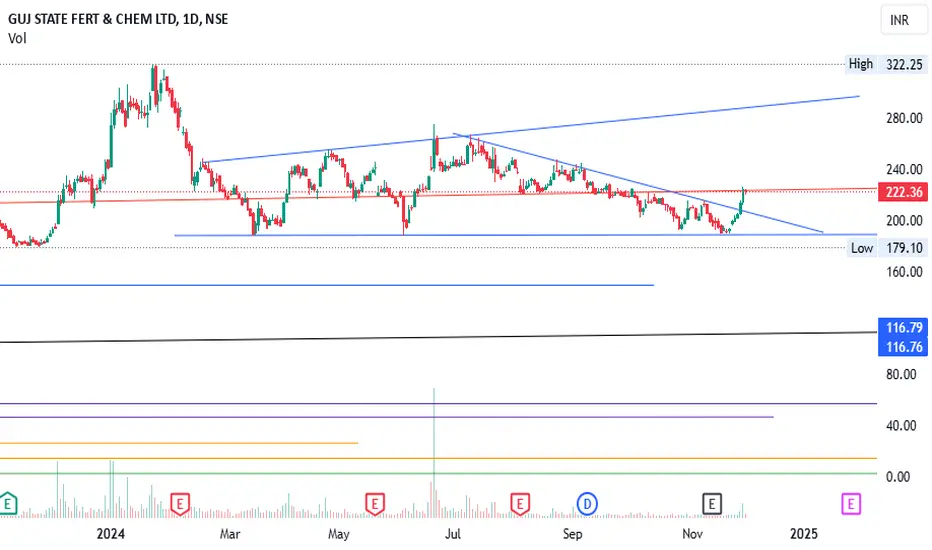
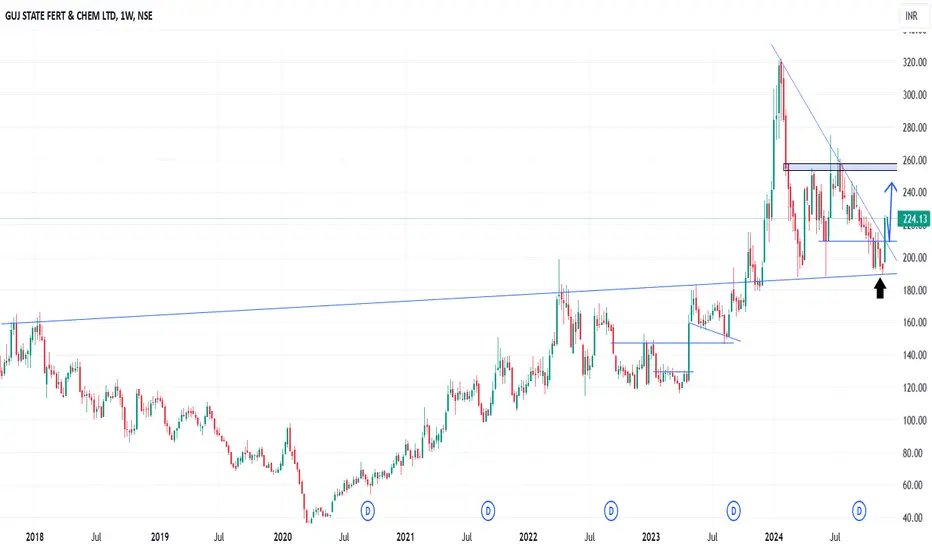
GSFC - Trendline breakout and Good Morning star candle formationThe price has been consolidating since March 2024, respecting the 188 range on the daily timeframe. Last week, it broke out of the trendline within the wedge. On the weekly timeframe, the candlestick formation resembles a morning star, which is a positive signal. We can expect the price to reach the resistance line of the wedge, around 288 INR. This setup is suitable for swing trading.
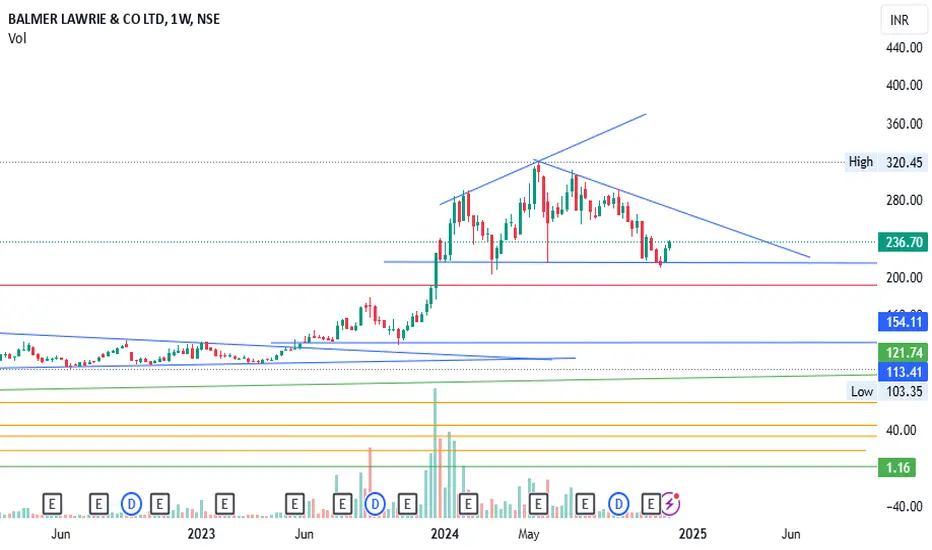
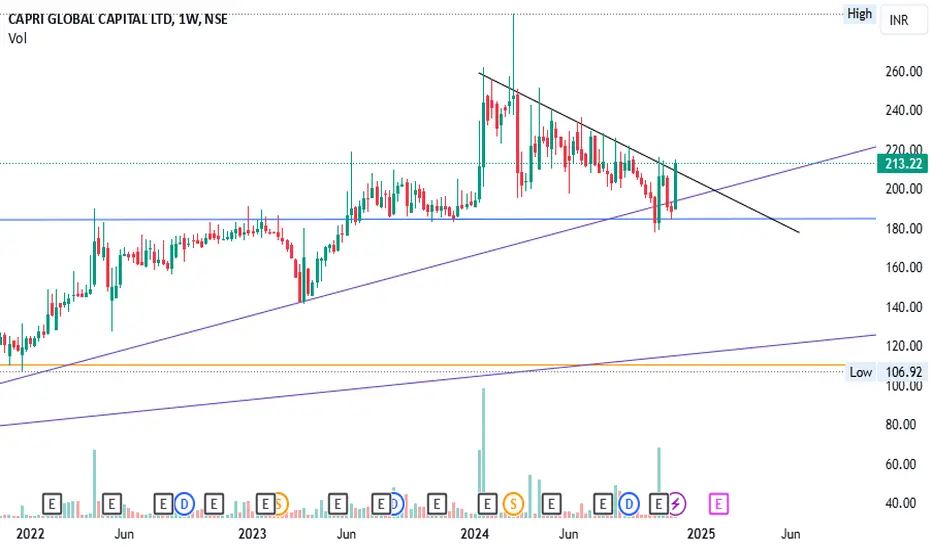
BALMLAWRIE - Wedge formation and Morning starThe price has been consolidating since January 2024, forming a wedge pattern. Recently, a morning star candlestick formation has appeared, which could be considered as a potential signal. However, it might be better to wait for a trendline breakout for additional confirmation.
Nifty analysis for 03/12/2024Nifty has been trading in a range for last five trading session and there are possibility of a trend reversal as the chart seems to me.
It is trading around the Hourly EMAs and has closed above it after good fall on Thursday.
If there is a break out of the resistance zone, 24500 can also be breached and new highs around 24730 can be seen.
A base and W pattern formation is there around the low created. Buy on dip can be done once the crucial round number figure is taken out.
Resistance :- 24350, 24500, 24940
Support zone :- 24090-24140
The market is looking strong for the coming days. Market reaching 25k this week or the next can be seen.
Wait for the price action near the levels before entering the market.
Reliance Industries Dragon Fly Doji in Weekly chart at SupportHi this is Kapil,
Reliance Industries took support at 1257 on weekly and monthly support area, Made Dragon Fly Doji on weekly chart as well
Bulls can be seen pulling the price back above the support level of 1237.
after 43% upside swing in one year from oct 2023 to oct 2024 the stock looks in minor consolidation period
to a possible reversal we can plan adding reliance in our portfolio with annual returns of 25-20% for 2025 year.
Next support below 1200 is at 1004. So add near here and @1015
Near term targets are 1405 and 1569 in 2025-2026.
Special Note- Reliance will actually be used as index management tool so every hourly oversold portion can be seen
as possible reversal for intraday basis.
Consult your Financial advisor before making any decisions
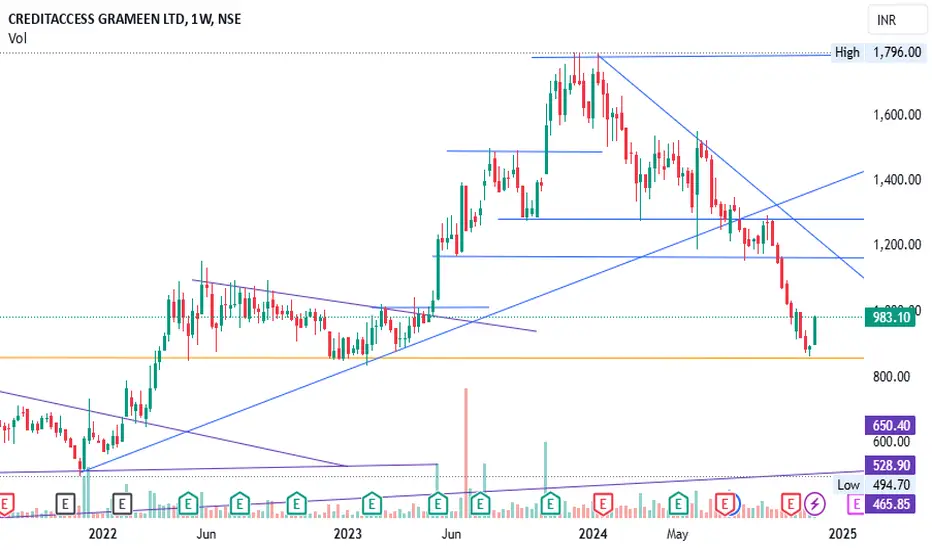
CREDITACC- Price at support line forming Morning StarThe 850 range has been a significant support level for this stock since 2020. After a decline from its all-time high of 1750 to the 850 range, the price is now forming a Morning Star pattern on the weekly timeframe. An entry opportunity is available only on Friday if the green candle formation is good without long wick, with a stop-loss placed below the hammer candle.
Engineers India offers good RR from this price level. -Good RR setup.
-Bouncing from a support level with Volume.
-Formed a bullish engulfing candle.
-Broke out of Trendline.
-Double Bottom at support level.
Overall, it's good for a swing.
This is not a Buy/Sell Recommendation. Please do your due diligence.
Risk- 15.4%
Reward: 29.8%
RR- 1:1.9
Option Buying in Nifty 28-11-2024Hey Traders,
As i have marked some important levels in Nifty trade, there are high chances that Nifty might move on higher side tomorrow. here are the few steps to follow
If buyers are more active in 1st hour then there is high probability that option buying may give good returns tomorrow. if SL hits then will shot the call option (Far OTM) with small SL.
P.S:- Tomorrow is Nifty Expiry trade with caution.
Happy Trading
Thanks
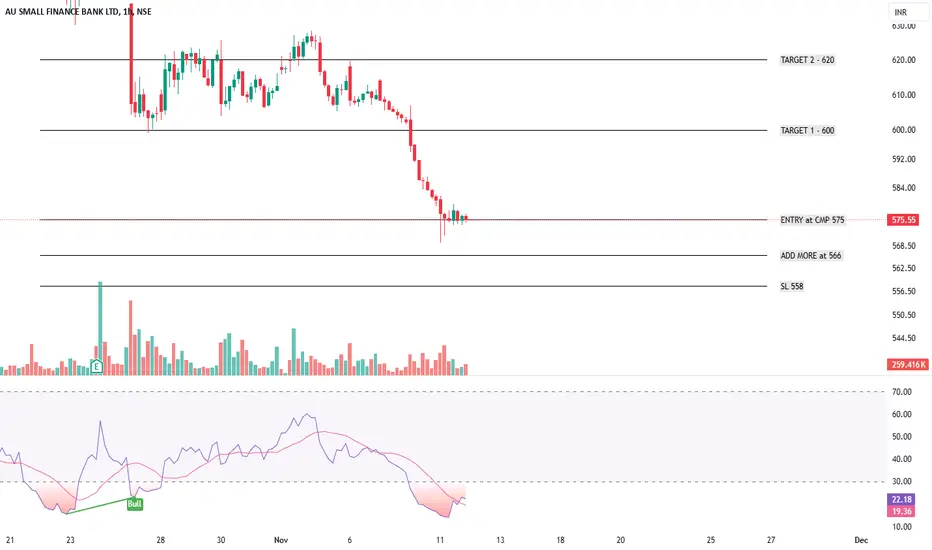
AU SMALL FINANCE BANK - SWING TRADING IDEASymbol - AUBANK
AUBANK is currently trading at 575
I'm seeing a trading opportunity on buy side.
Buying AUBANK Futures at 575
I will add more long position at 566, if comes.
Holding with SL of 558
Targets I'm expecting are 600 - 620 & above.
Disclaimer - Do not consider this as a buy/sell recommendation. I'm sharing my analysis & my trading position. You can track it for educational purposes. Thanks!
Three White Soldiers | Educational | Colpal The Three White Soldiers candlestick pattern is commonly used in technical analysis.
The pattern identifies potential bullish reversals in a downtrend or a period of consolidation. Traders often use the pattern and other technical analysis tools, such as support and resistance levels, trend lines, and volume indicators, to confirm the trend’s strength and potential entry and exit points.
The Three White Soldiers pattern can be used on various time frames, from short-term intraday charts to longer-term weekly or monthly charts, depending on the trading strategy and goals.
Disclaimer: This is for educational purpose. Definition and details can be found on any other search engine / books/ articles etc.