Nifty weekly analysis for 13/01/2025.The weekly charts of the index is looking bearish as the market has closed around the 50 EMA.
A strong support around the 23400 levels is there. The support has been tested 2-3 times and it is weakening the levels.
If the support levels is breached it can test the lower support level of 22k.
Sell on rise the market is there. On daily charts market has reversed from the levels but bullish trades can only be trade once the previous resistance level is taken out.
Major levels
Support :- 22340
Candlestick Analysis
Positional or Longterm Opportunity in GAILGo Long @ 188.55 for Targets of 208, 221.15, and 237.45 with SL 180.4
Reasons to go Long :
1. On a Weekly timeframe if we draw the Fibonacci retracement tool from the recent swing low (point A) to the recent swing high (point B) then we see stock took support from the 0.382 Fibonacci level.
2. In addition to this a bullish candlestick pattern Bullish Hammer (marked with orange) is formed around the 0.382 Fibonacci level.
3. Also there is a strong Trendline (marked with green color) which sup
VST Looks good for 180-200TA shows volume bottoms for support, 3 LARGE bottom wicks on daily chart, weekly chart has a bullish hammer. Not to mention the monthly moving average 4 bounce we had today.
Feb21 expiry $200 Strike calls are constantly being loaded every day. Seems like accumulation to me.
Momentum can bring this up really fast, and the overall strength as markets turn red are a great sign too.
NFA - Watch this
No more ruling the skies of the aviation sector!! - INDIGOInterglobal Aviation (INDIGO) has shown several bearish patterns recently, indicating potential downward trends in its stock performance.
Weekly : Bearish Engulfing Candlestick Pattern.
Daily : Three Outside Down with very weak volume
Each candlestick pattern confirms a bearish trend, suggesting a short trade. Additionally, global factors are expected to impact the aviation sector.
Entry: 4425
Stop Loss: 4740
Target: Open/Mentioned.
Let me know if you found this interesting.
Happy
How to Trade Candlestick POIsThis is not precisely a forecast, rather, it is a tutorial on how to trade candlestick POIs using my custom Templar Trading Methodology. It is a very basic approach, not exactly as robust as I would teach in a class or seminar per se.
In this video, you will learn how to capture the best Day Trading ideas on a daily basis, especially on Gold (XAUUSD), and other high-volatility commodities. I hope you learn a thing or two from this though. Cheers!
- Adetola Freeman.
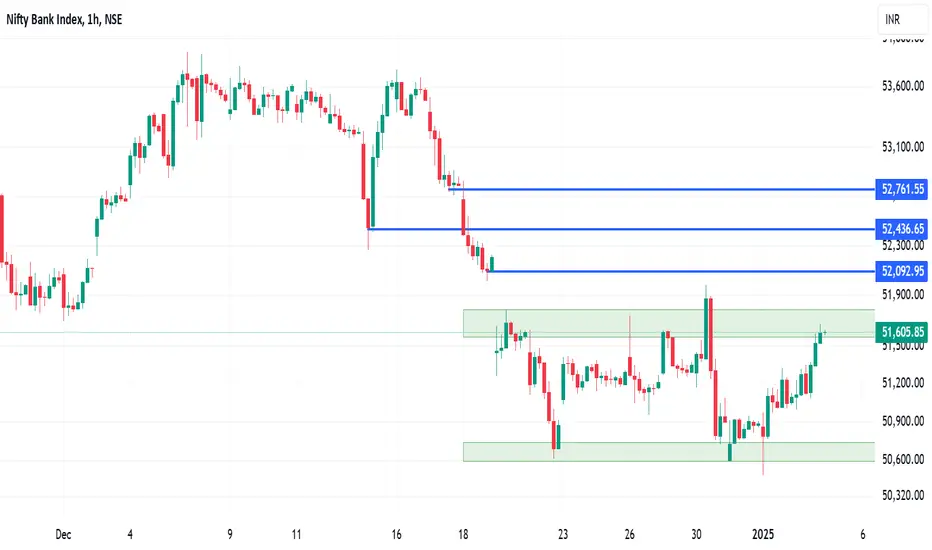
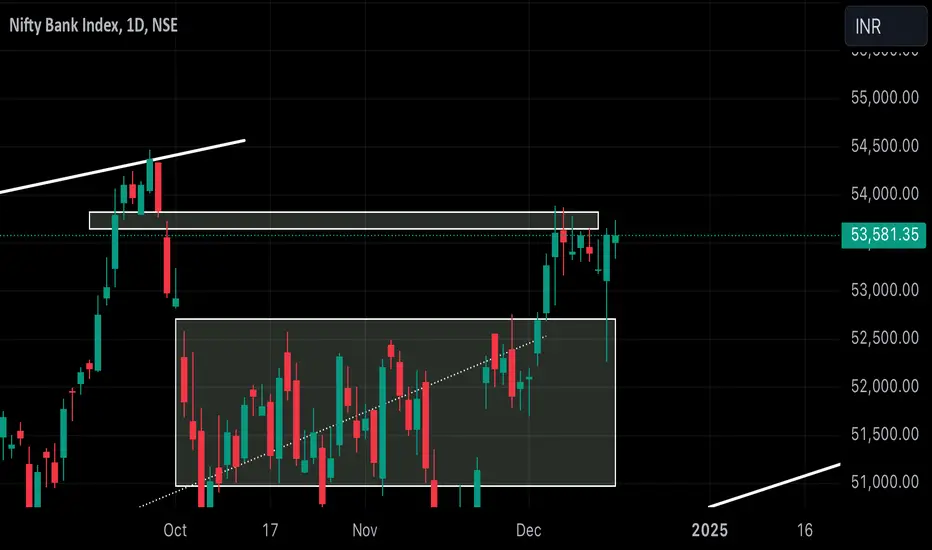
Banknifty analysis for 03/01/2025.Banknifty is trading in a range is trading around the resistance zone.
If their is a upside break out in the index, a trending move can be seen in it. Otherwise, another side way market will be there.
Moving averages are around the closing price and EMA strategy may also be implied in capturing the move.
Major levels
Resistance :- 51835, 52090
Support :- 50650, 50000
Wait for the pirce action near the levels before entering the markets.
Nifty weekly expiry analysis for 02/01/2025.Tomorrow is nifty first weekly expiry of the year.
A consolidation is going on in the index and today also it closed in a range.
If there is break out of the trendline on the upper side, chances of market retesting 24k levels are high.
In case of a fail and market trading downside, a trend downside possibilities are there.
20-EMA and 50-EMA are acting as a resistance and once cleared higher EMAs can be tested.
Option buyer be cautious of the expiry premium decay. Only trade the momentum
PTC India WBuy in PTC India with a very good risk reward.
Pattern- Double Bottom and A bullish engulfing in Daily TF.
Entry- 148-150
Support/SL- 140-138
Targets- 180, 200, 220
Jai Shree Ram
Disclaimer- This is just for educational purpose please take advice from your financial advisor before making any decision.
Mol potential reversal zoneMol is in potential reversal zone
-Monthly vol is good
-On monthly candle -march23 n april 23 and sep 23 n oct 23 bullish harami pattern
-On weekly level inverted head and shoulder is in formation
-Daily candle- tweezer bottom pattern and bullish bet hold line are seen
-cmp 76 target - 90/115/140
Mol potential reversal zoneMol is in potential reversal zone
-Monthly vol is good
-On monthly candle -march23 n april 23 and sep 23 n oct 23 bullish harami pattern
-On weekly level inverted head and shoulder is in formation
-Daily candle- tweezer bottom pattern and bullish bet hold line are seen
-cmp 76 target - 90/115/140
Lupin: Triple Top Signals Breakout Potential Topic Statement: Lupin has a bullish breakout potential, forming a triple top candlestick pattern with resistance at 2300, but may correct to 2000 if the breakout fails.
Key Points:
1. The stock is forming a triple top candlestick pattern, which is a strong breakout signal.
2. Resistance is established at the 2300 level, if the breakout does not occur, the price may correct to the support level of 2000.
POWERGRID - very bearish after breaking out of double top
DOUBLE TOP BREAKOUT -
price of NSE:POWERGRID has recently broken out of a perfect double top pattern indicating strong downward pressure for the stock
MORNING STAR CANDLESTICK -
price has formed a morning star candlestick pattern at the last peak indicating bearish momentum for the stock
CROSSED BELOW 200D SMA -
the price has also recently crossed below 200D sma which is an indicator of strong downside pressure for the stock.
TARGET -
the price will go till 301.9 le
Bajaj Finance Weekly Swing Idea (Short)Bajaj Finance might retest the support & beyond. Here are the logic behind
1) Earlier attempt of breakout failed on weekly so bearish trend likely to
continue
2) Trading BELOW 50 EMA & 20 EMA on weekly &
BELOW 20,50 & 200 EMA on daily
3) Strong BEARISH ENGULFING CANDLE with sustained volume
(Note: Author not responsible for anyone's profit or loss, nor a sebi registered RA, this only for educational purpose. Please do your own due diligence before taking any trades.)
Marine Electricals-Exhibiting good Price Action. Positional Pick
✅Successfully completed a breakout and retest.
✅Demonstrating strong resilience in a bearish market.
✅Forming an Inverse Head & Shoulders pattern.
✅Gaining momentum with increasing volume and
price action.
❌ The market is in a profit-booking phase.
❌ Be cautious while entering new trades.
Entry: 335.5
SL: 281- Day closing basis.
Risk: 16.6%
Reward: 31%
RR: 1:1.8
Note: This chart is shared for educational purposes only. Please conduct your own research before making any
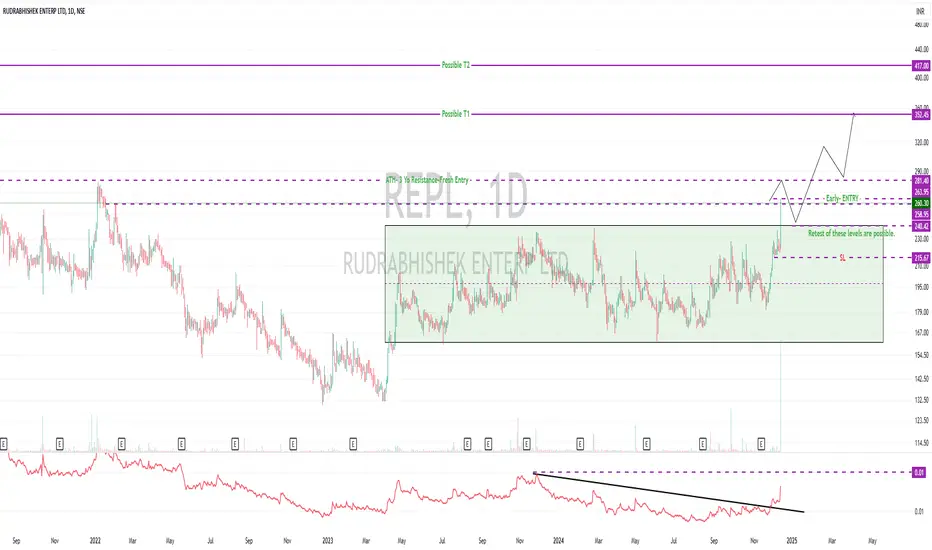
Rudrabhishek Enterp Ltd (REPL) Breakout with Huge Volume⚠️Risky Bet.
1. Early Entry above 264. SL 215. A retest of 240 levels is possible. Any signs of retest and reversal are an entry opportunity. Retest Level. 240
Or
2. Wait for a fresh breakout above 282 for an entry. SL Below the breakout candle.
These are my views and my way of doing things. Please do your due diligence and research. Do not jump into a trade with a huge allocation based on Tips.
Reasons to go Long:
✅Huge Volume 4x volume c
Powergrid - Good upside from trend line📊 Analysis:
Good bullish Hammer candle form on Trend line, The price is supported by the 21-EMA and 50-EMA, which are trending upwards with good volume, signaling bullish momentum.
📈 Trading Plan:
Entry: Buy above 335 (wait for a breakout above candle at least 15 min with strong volume confirmation).
Target 1: 340-345
Target 2: 360
Stop-Loss: 325 (below hammer low)
NIFTY 1HR ANALYSIS After making a higher high, the price went sideways for a week. Then price broke the liquidity/sideways zone to sweep orders before reaching the supply zone.
Now, the price may retrace to grab buy orders lying in the FVG/demand zone before moving upward or continue its direction.
NOTE - We may be 100% wrong . It's not a buy/sell recommendation, just for educational purpose only!