Candlestick Analysis
NIFTY (1 DAY)Nifty 50 can lift from here have some reasons at below
- Nifty 50 is 11% down from last all time high.
- Touching big supports & trendlines.
- Near fibonacci zone (23250-23500).
- Formatting pulling up candles like dojis in last 3 days.
- Created high when nifty gave biggest fall of 2024 is support.
for all other reasons chart says it all.
Ascending Parallel channel in JSW NSE:JINDALSAW An ascending parallel channel has been formed in weekly & daily channels out of which a current daily bullish candle confirms the reversal of the falling stocks
A confirmed buying can be when it crosses the parallel channel at 310 or risk-takers can accumulate at current levels.
Another bullish signal is the crossing of the EMA 200
Gold - Bookish example for Morning/Evening StarA typical example of Morning Star and Evening Star in the same chart. Its a good time to consolidate Gold
Evening Star
Evening star patterns are associated with the top of a price uptrend, signifying that the uptrend is nearing its end
The first day consists of a large white candle signifying a continued rise in prices.
The second day consists of a smaller candle that shows a more modest increase in price.
The third day shows a large red candle that opens at a price below the previous
Evening Star - A Typical ExampleEvening Star
Evening star patterns are associated with the top of a price uptrend, signifying that the uptrend is nearing its end
The evening star pattern is considered to be a very strong indicator of future price declines. Its pattern forms over three days:
The first day consists of a large white candle signifying a continued rise in prices.
The second day consists of a smaller candle that shows a more modest increase in price.
The third day shows a large red candle that opens at a pri
Morning Star + Flag pattern - Trend ReversalMorning Star - The Morning Star pattern is a classic bullish reversal pattern in technical analysis. The pattern consists of three candlesticks: two large ones with different directions and a smaller candlestick between them.
Flag Pattern - A sudden move in either direction followed by the price consolidates in a range following the sharp move, and the price then continues to move in the same direction after it breaks out of the range. Its visual resemblance to a flag and a pole
Easy 20% return with Piccadily Agro IndustriesBSE:PICCADIL looks perfectly poised to give a solid 20% return to investors with a short term horizon.
Technicals: When we see the candlestick chart on a daily basis, it is trading at 750 which lies in between its nearest support at 700 and nearest resistance of 780. The MACD indicator points in the direction of an uprise with a healthy positive value.
Fundamentals: BSE:PICCADIL is a very fundamentally strong stock. It has high ROCE and ROE of 29.6% and 30.6% respectively. BSE:PICCADIL
Weak below 52500..!!?As we can see despite the strong movement in all other index including NIFTY and Sensex, BANKNIFTY remained sideways to negative throughout the day showing no strength despite looking good pattern wise. The pattern seems to viable only if BANKNIFTY breaks above 52500 until it can remain sideways to negative so plan your trades accordingly and can prepare for bearish trades till BANKNIFTY breaks above 52500.
Nifty Bank _Election 2024 USHi traders,
Currently Nifty Bank trading @ Support Zone @ which is 52207.
Pros:- Master Candle @ Support Area which took nifty Bank almost 1200 points up from Intraday
low.
:- Positive news of US elections of Trump comeback.
:- Major Financial stocks contributing for Nifty and bank nifty Rally.
:- Go long In Dec-2024 futures & Options of Nov-2024 until opportunity gives at 52.2k
Zone.
:- Transaction data showing positive data before election
CONCOR: Price Action for DiwaliFollowing a substantial downtrend in CONCOR has recently exhibited a bullish reversal pattern characterized by three consecutive green candlesticks ( Three Green Soldiers ) on the daily timeframe. This formation suggests a significant shift in stock movement, indicating that buyers have gained control and are exerting upward pressure on the stock. Such a pattern is typically interpreted as a strong signal that the preceding downtrend may be reversing into an uptrend.
In conjunction with the d
Aether Ind forming H&S on weekly charts.A perfect Head and shoulder pattern formation in Aether Ind.
Aether Industries is engaged in the production of intermediates and specialty chemicals. Products for Pharmaceutical, agro chemical, material sciences, coating, photography, additive and, oil and gas, segments of chemical industry.
MCap = 10491 Cr
P/E Ratio = 103
The company has grown in sale by 30% since September 2021 while the expenses has gone up by 40% from 101 Cr to 142 Cr. Opertaing profits are down by 1% (Sept 2021) to 28%
What is Price Action ? Beginners Guide in Easy Steps Part -2In our previous discussion, we delved into the fundamental techniques of reading a price chart with key price action strategies. This time, we're set to expand our understanding even further. By the end of this article, you'll have a fresh perspective on analyzing charts and interpreting price movements, empowering you with deeper insights and more confident trading decisions.
1. Identify the direction of trend with the help of price action candlesticks
a.)Strong Uptrend:
Green candlesti
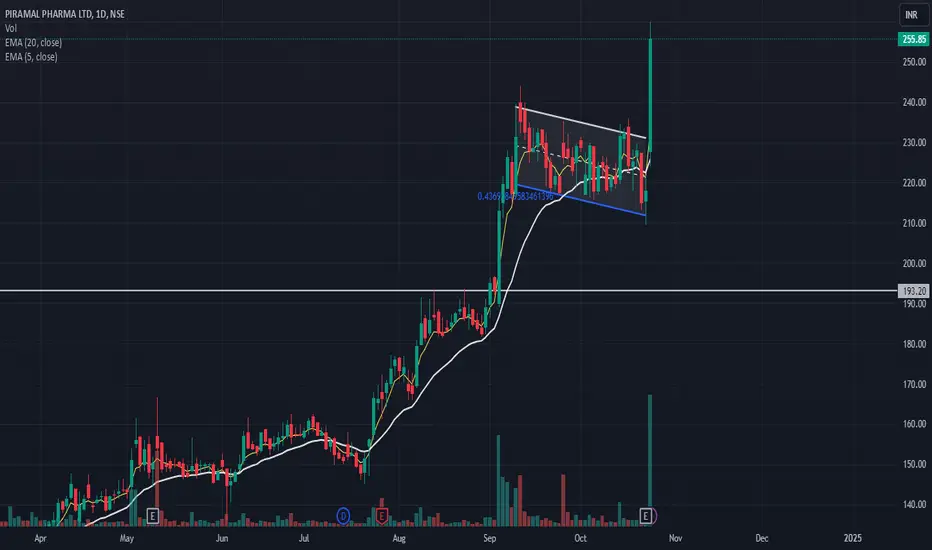
PPLPHARMA STRONG BULLISH CANDLEPiramal Pharma Ltd
Strong Bulish candle formation after QTR Result of company
good QTR result
and breakout found on chart good levels for entry after a pullback
or INTRADAY continuation trade with strict Stop Loss
**Disclaimer:** This information is for educational purposes only and does not constitute financial advice or a recommendation to buy or sell any securities. Always do your own research and consult with a financial advisor before making investment decisions.
A clear play on Auto sales and the Bajaj GroupThis was the original Bajaj entity, now restructured into a holding company that supports Bajaj Auto and other family businesses. I believe it’s a PPFAS favourite and a low-risk stock. With new measures removing holding company discounts, it stands to benefit significantly from the upcoming favourable market conditions.