Candlestick Analysis
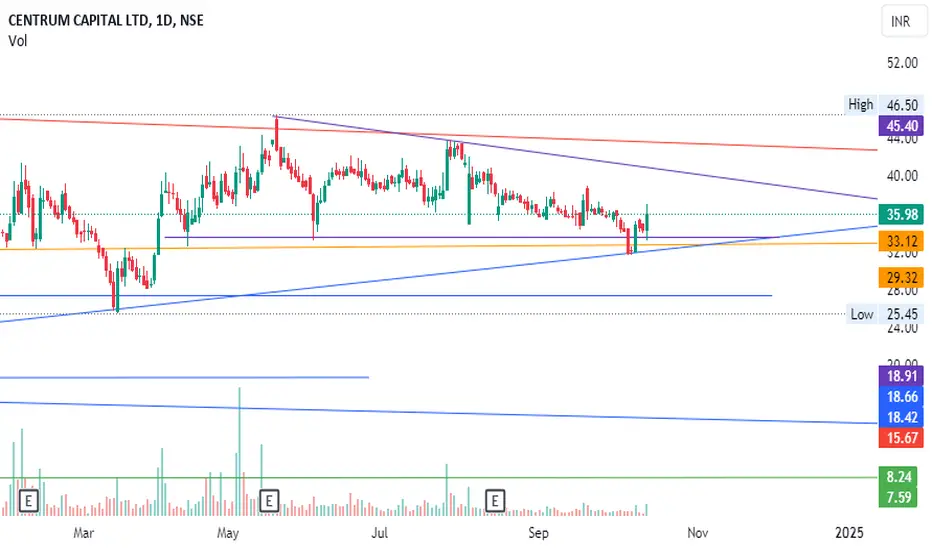
EXACT REVERSAL from our demand zone! Depsite the weakness, we held on to our view of buying the dip approach till the price doesnt doesnt sustains below the trendline and it REVERSED exactly from our given trendline support with unidirectional rally. Hence we would stay with our original view of buying the dip till the trendline is not breached and expected more of uptrend as it can be seen forming more like a W pattern in smaller time frame so plan your trades accordingly.
VERANDA - Breakout and RetestPrice breakout triangle and came back inside the triangle and it formed hammer like candle now (Weekly Timeframe). We should consider entering a trade only if a strong green candle forms in the next session. On the daily timeframe, it appears to be forming a morning star-like structure.
Tirupati Sarjan Ltd#stocks #investing #swing #trading #technical #RSI #candlesticks
Key Points:
1. Support at ₹15-16: The stock has shown strong support at this level, as evidenced by multiple bounces. This suggests that buyers are stepping in at this zone, making it a crucial level to watch.
2. RSI Crossover with 14 EMA: The crossover of RSI above the 14-day EMA is a bullish signal, indicating increasing momentum. If the RSI continues to rise, it could suggest further upside potential.
3. Weekly Hammer Patte
BTC Trade Update : "BTC Rocket Ride: 669 Points Gained, Target i"BTC's price action has come close to hitting the first target. So far, the trade has delivered 669 points, showing strong momentum towards our anticipated levels. With price testing key support zones and facing resistance near 63,462, there's still potential for further movement. Keep an eye on the next levels for a possible continuation or pullback, as the 61,602 zone below could offer critical support if the momentum shifts."
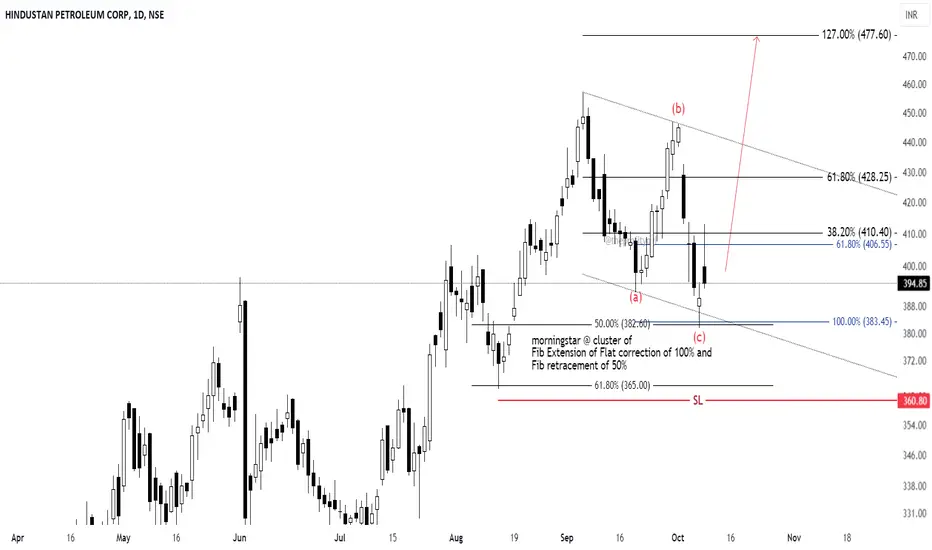
Morning Star at several Fib clusters in HINDPETRO Wave C of Flat correction has fulfilled the rule of equality (Wave A and Wave C are equal).
There is also a Fib level of fib retracement of the previous impulse at this level.
We can also see the Morning Star pattern forming at this cluster.
This suggests a high probability of a buy trade in HINDPETRO .
Stop-loss for this trade can be put below 61.8%, i.e., around 360 level.
This analysis is for educational purposes only.
Nifty weekly expiry analysis for 10/10/2024Market has given a nice movement and for two days it remained in a range but is volatile.
There are chance of market either follow the bearish trend or form a 'W' pattern.
Nifty has closed around crucial levels from where it can either reverse the trend or continue falling.
Major support level :- 24760, 24600
Resistance level :- 25210, 25480
The weekly expiry can show a trending move after a break out or break down.
Wait for the price action near the levels before entering the market.
BANKNIFTY at MAKE or BREAK zone!! The Bank Nifty showed impressive resilience today, staging a strong recovery from key demand zones as anticipated. Closing around the crucial 51,000 level, which serves as both a psychological barrier and a former demand zone turned supply zone, sets the stage for an interesting session ahead.
If the Bank Nifty opens flat tomorrow, the 51,000-51,100 range is likely to act as significant resistance. Traders should watch this zone carefully for potential reversal signals or breakout attempts.
Ho