BANKNIFTY at MAKE or BREAK level !!As we can see BANKNIFTY has filled its much awaited gap and can be seen trading around trendline resistance. Now as long as BANKNIFTY trades below the trendline, every rise can be sold till it closes above the trendline for change in trendline for target being new ATH so plan your trades accordingly.
Candlestick Analysis
Nifty weekly analysis for 28/08/2024.Nifty is stuck in a range and has slowly recovered after a retest. Yet there were no opportunities for option buyers this week.
If the market breaks out of the range, there are high chance of a fake out, as it has been rallying for last few days.
Small quantities can be traded in a bullish trade. In case of break down, a good profit booking rally can be captured.
Major levels :- 24870, 24960, 25050
The supports are nearby and market can reverse after testing the zones.
Index seems strong a
BANKNIFTY is STRONGER than NIFTY As we can see BANKNIFTY is stronger than NIFTY because it has a gap to be filled which has already been filled by NIFTY hence we can expect more of bullishness in BANKNIFTY till the gap is filled till it gets rejected and continues it next trend so plan your trades accordingly.
GAP is yet to filled in BANKNIFTY As we can see BANKNIFTY has shown signs of REVERSAL after a series of consolidation which could lead to potential unidirectional move followed by its break. Unless it’s broken down, we can’t expect a change of TREND, till then BANKNIFTY remains bullish till 46700 is protected and have we might see more of bullishness as the impending gap is yet to be filled so plan your trades accordingly.
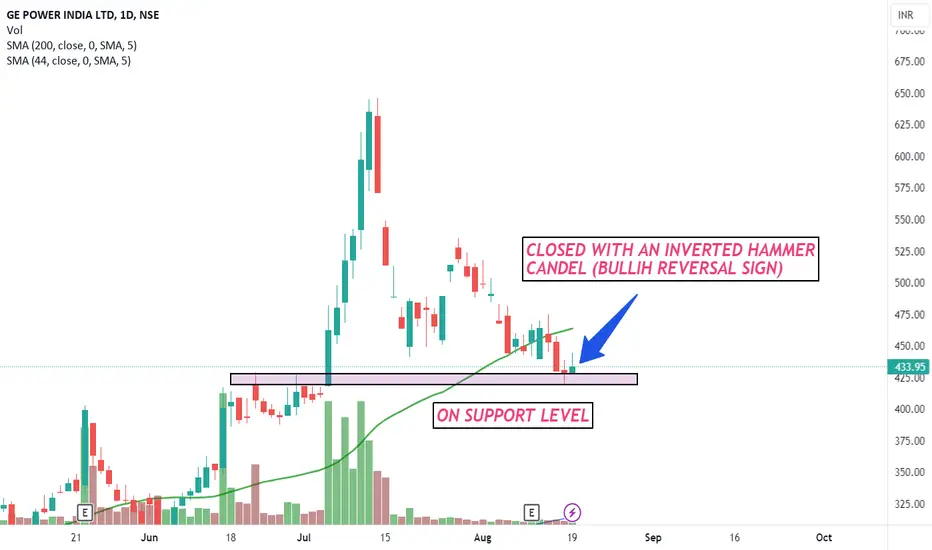
KEEP AN EYE!The stock is currently trading at the support level with an INVERTED HAMMER.
Can give a good move from this level.
Can start booking your profits from 10% returns.
DO NOT TRADE IF BREAKS THE TREND LINE.
DISCLAIMER - Analyse yourself before investing.
HAPPY TRADING
GShort
Banknifty weekly expiry analysis for 21/08/2024.Banknfity has given a nice move on the upper side clearing the resistance zone of 50800 but reversed after testing the round levels of 51k.
The markets were looking bullish from the morning and even in the second half. The last hour selling has created a confusion about the market movement for tomorrow.
It has been respecting the resistance trendline and retested 38.2% fib levels.
Shorting opportunity in the market will trigger once the makret starts trading below 50550 levels.
If today's hi
Ashok Leyland - Bullish viewI have entered the marked level for swing trade.
Reasons for buying:
1. Breakout at 1 D time frame.
2. Stock is trading at all time high. These stocks generally perform good after breakout.
3. Breakout in 30 mins with volumes.
Please note that it's not a recommendation to buy. I have posted my analysis for educational purpose. Please do your own analysis before buying. I am not responsible for your profit or loss.
Kokuyo camlin : Breakout Stock#kokuyocmln #breakoutstock #tws #fvg #patterntrading #chartpattern #inverseheadandshoulder
Kokuyo Camlin : Swing Trade / Short term(1-3 Months)
>> Breakout Stock
>> TWS Visible
>> Stock Bouncing from FVG Area
>> Good Strength & Volumes might Pickup soon
>> Low Risk High Reward Trade
Swing Traders can lock profit at 10% and keep trailing.
Please give a Boost or comment if u r Liking the analysis & Learning from it. Keep showing ur Love by following
Disclaimer : This is not a Trade Recommendat
WHEELS | Simple trendline breakout - Potential for 70-80%WHEELS | Simple trendline breakout - Looks potential for 70-80%
CMP : 796
SL : 650
Target : 1400
The previous post was deleted by tradingview moderator, as i had mentioned the same description above. It is a simple breakout. Its my style of simple analyze.
There is nothing to write beyond this, i'm just posting all this charts to create a respository. I dont have any hidden agenda like creating courses or selling indicators.
But this website looks like promoting only those authors.
FIN NIFTY - TRENDLINE RESISTANCEFIN NIFTY is facing trendline resistance at 4hr chart.
It is at Lower Trendline support and made a Hammer Candle under 50ema. Breakout with a strong green candle may give a good upside move.
It has been moving between an ascending channel at daily time frame since January 2024.
Earlier it gave breakout on 25june but started coming down from 23rd July - Budget Day, also impact of global market fall.
LEARNING : Less is More!
Identification of right support and resistance levels are import
ATH_GLENMARK_Hi Traders,
Happy to share this post since Tracking it from last couple of months and today it closed above Previous levels with Strong Bullish pinbar at 20 EMA support in uptrend.
Pros:-Bullish Pinbar in uptrend which is taking 20 EMA as support.
:- Energy is being stored from last couple of months to explode.
:- Pharma Sector Is positive with recent Results In Indian markets.
:-Go long Oct-2024 Futures.
Cons:-NA.
Happy trading!!Only for Educational purpose.
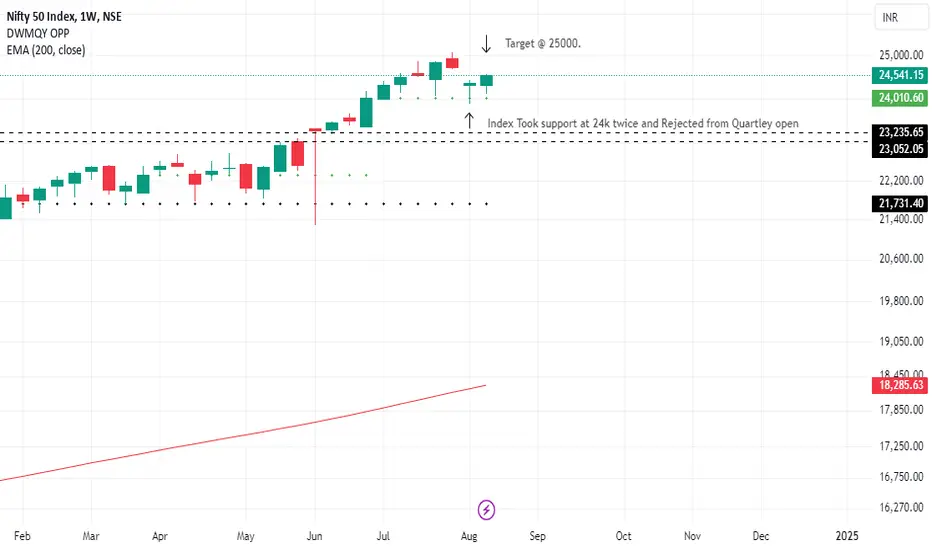
Long_Nifty50_Bullish hammerCurrently Nifty 50 trading @ INR 24541.15.
Go long in Nifty50 options with Near Strike.
Pros:- Market took @ 24k from past 2 weeks.
:- Bullish Hammer candle @ Support from last two weeks.
:- Global market is positive.
:- Options premium is cheap as we are heading to Month end expiry.
Cons:-NA.
Happy trading!!Only for educational purpose.