Candlestick Analysis
Bullish break out in the stocks for this week 08/07/2024..
ONGC is a government sector company is trading around the resistance zone. If there is a break out of the consolidation zone good returns can be captured in the stock.
The stock has taken a good support from 20 ema which also gives a confidence to hold the stock for a swing trading.
Even on the daily charts, the stock has test the 200 ema and chance of it clearing the resistance level is high.
A round number figure of 300 can be seen as the next resistance as the stock will be trading in an
Banknifty analysis for 19/07/24.Banknifty on the weekly time frame is still forming an inside candle. If it crosses the previous weekl high of 52800, a bullish trade can be made.
The hourly time frame, there is a inverted Head and Shoulder pattern and the high probability trade can be initiated as Nifty is trading around Life time high of 24800.
There is chances of BN catching up with other index.
Major Break out level :- 52800
Targets :- 53080, 53250
In case the market starts break down, trade only once it break the supp
Gold July 16 2024Technical:
1. W - Strong uptrend.
2. D - Strong uptrend. There is rejection at resistance yesterday and closed below resistance.
3. 4H - Strong uptrend. Structure is very steep.
4. It is at all time high resistance.
5. It reached resistance with fundamental support also.
Fundamental:
1. USD negative so far..
2. Powell speech was not much impact. It helped to retest the break.
3. USD has red data at 6PM IST - mostly negative
Game plan:
1. Based on 4H structure, it may come down to 2397.695 to g
GBPUSD - July 16 2024Technical:
1. Strong uptrend in all timeframes.
2. Strong momentum.
3. It is at resistance.
4. 1H - Consolidation and no momentum either side.
5. So far no confirmation to go any side in both 4H and 1H.
Fundamental:
1. USD data very negative so far.
2. Powell gave few good words about US economy but that won't help to go down.
3. GBP - No economic data for today.
4. USD - Red data at 6Pm.
Game plan:
1. both buy and sell.
2. Sell - Double top, Rejections, 4h/1H candle confirmation, Medium risk
GBPJPY - July 16 2024Technical Analysis:
1. Even though some weird selling pressure was there last week, it is still in uptrend.
2. W - Uptrend and last week rejected resistance and closed below resistance.
3. D - Uptrend and given fake out and closed below resistance.
4. 4H - There was buying pressure at support.
5. 4H - Made double bottom at support and candle stick confirmations.
Fundamental:
1. No use of having GDP data coming out.=, the same day market dropped much.
2. No economic data for today.
Game Pla
Is BANKNIFTY forming FLAG-POLE pattern..?As we can see BANKNIFTY is forming more like a flag-pole pattern which is also a bullish continuation pattern if the structure breaks but we can also see a trendline resistance which had been resisting BANKNIFTY for quite sometime now. Hence we can expect a trap if BANKNIFTY breaks but couldn’t sustain itself above the structure which could lead a to a bigger fall so plan your trades accordingly.
GBPUSD - Weekly AnalysisIt may give a pullback to 1.28951 and go up.
If it is not giving pullback, it may break 1.29946 and continue to go up.
Do not expect to give pullback because of strong uptrend.
If pullback / sell - These confirmation required to go for sell - double top, Candle confirmation and rejections - Trail SL.
Based on economic data also we have to decide the bias.
Gold Weekly Analysis July 15 - 19 Be a strong buyer until it reaches 2433.302.
Observe what the market is doing at that level.
If it breaks that resistance and sustain above that level, be a strong buyer.
If there is a signal to go down, then be a seller with proper selling signals.
Fundamentals may also support the market going up.
If the market goes down, fundamentals may play a role in this move.
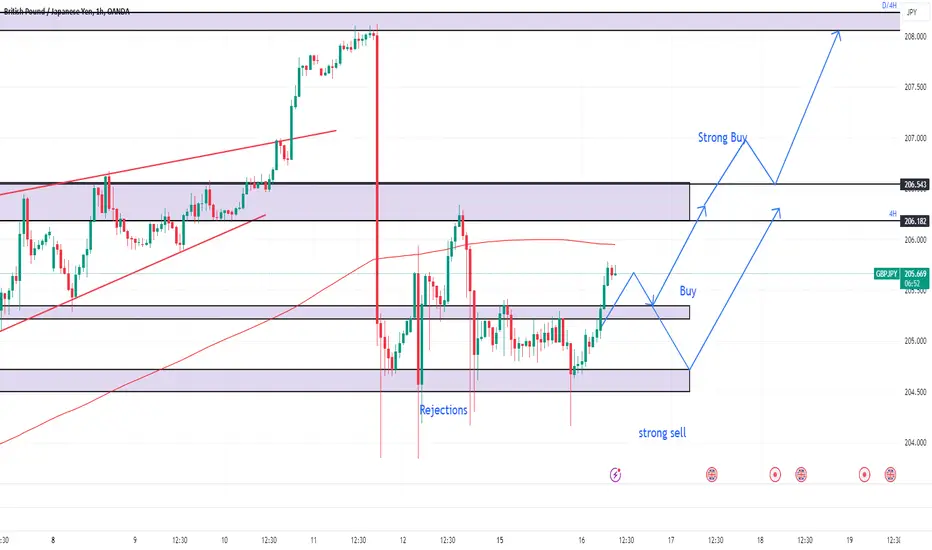
GBPJPY - Pre Week Analysis Still its uptrend and trend has not been changed.
We can go to buy above 204.500 where we can see buying pressure.
If Buy SL hits 2 times in the zone of 204.500 - 206.543, Do not go for trade after that in that zone.
Based on every day situation bias can be changed
If it breaks and sustains below 204.500 - After retest and candle confirmation , We can become a seller.
Expecting it would go up based on upcoming economic data.