Intraday AnalysisOption Chain Analysis: Decoding Open Interest (OI) to find where the "Big Players" are positioned.
FII/DII Data: Understanding institutional activity and its impact on market direction.
Intraday Strategies: Scalping and swing setups using Price Action and key EMAs.
Global Market Cues: How GIFT Nifty and US Markets might influence our opening.
Candlestick Analysis
Positional or Longterm Opportunity in Elgi EquipmentsGo Long @ 575.05 for Targets of 629.5, 683.95 and 738.4 with SL 520.6
Reasons to go Long :
1. On Weekly timeframe If we draw Fibonacci retracement from the recent swing low (A) to the swing high (B) then the stock took support from the 0.382 Fibonacci level.
2. In addition to this, the stock formed a Bullish Engulfing Pattern (marked with a orange color) around 0.382 Fibonacci level.
3. Also the stock gave a Trendline breakout (marked with a red color).
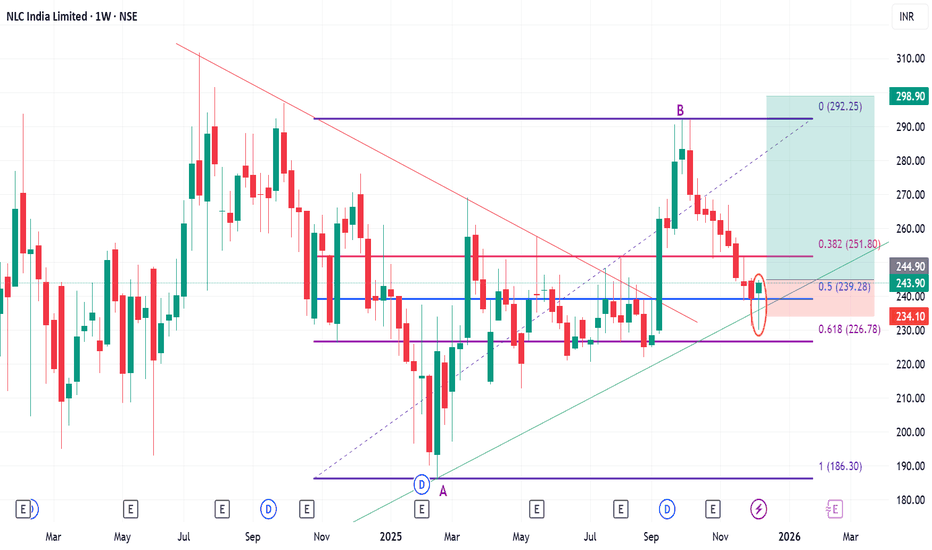
Positional or Long Term Opportunity in NLC IndiaGo Long @ 244.9 for Targets of 288.1 and 298.9 with SL 234.1
Reasons to go Long :
1. On Weekly timeframe If we draw Fibonacci retracement from the recent swing low (A) to the swing high (B) then the stock took support from the 0.5 Fibonacci level.
2. In addition to this, the stock formed a Bullish Hammer Pattern (marked with a orange color) around 0.5 Fibonacci level.
3. Also the stock gave a Trendline breakout (marked with a red color).
4. Also there is a strong Trendline (marked with green color) which supports the stock.
NIFTY is preparing itself for a big move. As we can see continued rejected from given levels shows strong buying sentiment but cannot be confirmed unless NIFTY closes above 23750 levels . It could be a trap and hence until and unless NIFTY manages to close and sustain above given level, every rise can be shorted! So plan your trades accordingly.
Trading Option Analysis With Education and Logic Part-1ICICI Bank
Support
₹1240–₹1230 → First support area where buyers may enter
₹1200 → Strong support for positional view
If the stock breaks below ₹1220, then selling pressure can increase for some time.
Resistance
₹1275 → Immediate resistance
₹1300 → Main breakout level
A strong close above ₹1300 can push the stock toward ₹1320–₹1350 in the upcoming weeks.
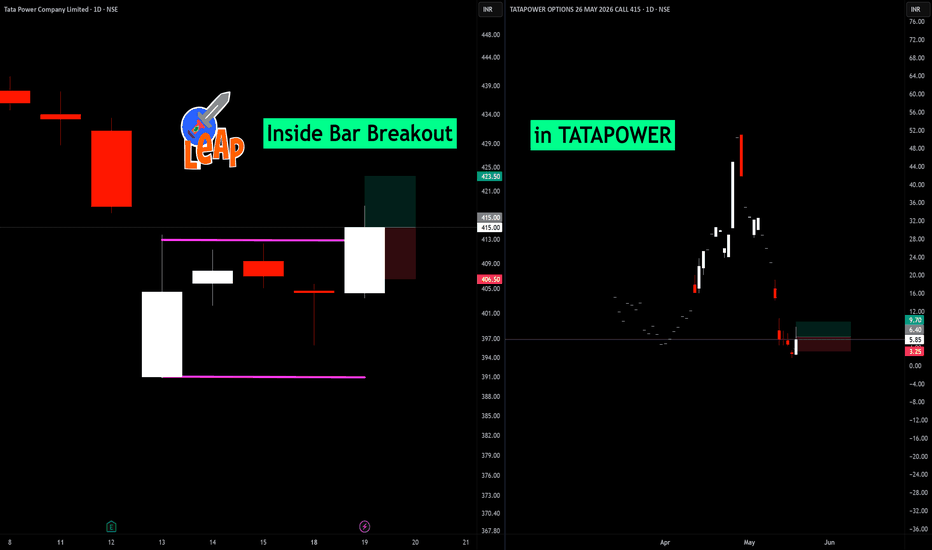
BUY TODAY SELL TOMORROW for 5% - BTST STOCK OPTIONAn explosive breakout pattern is forming on Tata Power Company Limited (TATAPOWER) on the daily time frame. We are looking at a high-probability BTST (Buy Today, Sell Tomorrow) or short-term swing opportunity based on a textbook Inside Bar breakout.
🔍 Technical Breakdown
The Setup: Following a strong directional move, Tata Power compressed into a tight consolidation range, forming multiple Inside Bars contained completely within the high and low of the mother candle (marked by the purple horizontal lines between ₹391 and ₹413).
The Breakout: Today's daily candle has aggressively broken out above the key resistance level of ₹413 with strong bullish momentum, closing well above the consolidation zone at ₹415.
The Target & Risk: * Immediate Target Zone: ₹423.50 – ₹425+ (as indicated by the green projection box).
Invalidation/Stop Loss: A daily close back inside the range or below the breakout candle's lower body (around ₹405 - ₹406.50).
T
BTCUSD Retest Structure After Channel BreakdownAfter breaking out of the parallel channel structure, the market is continuing toward the downside while respecting the bearish trend. However, I believe the current bearish candle area may still get a retest before the next major move begins.
My expectation is that the market could perform a small pullback and retest the negative candle zone. If price reacts there and forms another bearish confirmation candle, then the downside continuation may become stronger.
At the same time, I also converted the previous demand area into a potential supply zone using the demand-to-supply interchange concept. Because of that, the marked lower zone is now acting as an important reversal area.
If the market reaches this zone and forms any strong positive candle or bullish confirmation, then a temporary upside reaction is also possible from that area.
For now, the market structure still looks bearish overall, but a short pullback before continuation would be completely normal. The reversal zone is already marked, and if proper retesting happens, the setup could become even cleaner.
At this stage, the next reaction around the retesting area will decide whether the market continues lower immediately or creates a short-term recovery move first.
Institution Option Trading Part-1PCR means Put Call Ratio
It tells us how many Put options and Call options people are buying or trading.
Why it matters for institution trading
Big players mostly use options. So PCR helps us understand what big money may be thinking.
If PCR is high
More puts than calls.
Means traders are scared or taking protection.
Sometimes big players expect weakness.
If PCR is low
More calls than puts.
Means confidence in upside.
Sometimes market is bullish.
Why learn this
Price only shows movement.
PCR shows mindset behind movement.
Institutions think different
Retail people chase candles.
Institutions manage risk first.
PCR helps you see that risk activity.
HDFCBANK Important ZonesStrong Support Zone
₹750 – ₹745
Recent buying interest is coming from this area.
If this zone holds, a bounce is possible.
Major Support
₹726
This is a clear previous low on the chart.
If the price breaks below this level, selling pressure could increase quickly.
Immediate Resistance
₹780
The price has been rejected multiple times near this level.
A strong upside swing is likely only if ₹780 is broken decisively.
Next Resistance / Target
₹795 – ₹800
This is a strong supply zone.
Momentum may strengthen only after a proper breakout above this range.
Bigger Target
₹810 – ₹820
Medium-term upside target zone.
Simple Trading View
Bullish Scenario
If:
₹750 holds
and ₹780 breaks out with good volume
Then upside targets could be:
₹795
₹800
₹820
Bearish Scenario
If:
the stock closes below ₹745
Then downside levels could be:
₹735
₹726 support test
Understanding the Trend
Overall chart structure:
Short-term trend looks weak to sideways
Lower highs are forming
However, above ₹726 the structure is not completely broken yet
So the most important levels are:
₹750–₹745 → Decision Zone
₹780 → Breakout Zone
Technical AnalysisCore of Technical Analysis
Technical Analysis is the study of past price movements, volume, and market trends to predict future price direction.
3 Main Principles:
Market Discounts Everything
All news, emotions, and fundamentals are already reflected in price.
Prices Move in Trends
Markets usually move in uptrend, downtrend, or sideways trends.
History Repeats Itself
Human psychology creates repeating chart patterns.
Key Tools:
Charts (Candlestick, Line, Bar)
Support & Resistance
Trendlines
Indicators (RSI, MACD, Moving Averages)
Volume Analysis
Patterns (Head & Shoulders, Double Top, Triangle)
Goal:
Find good entry, exit, and risk management points for trading.
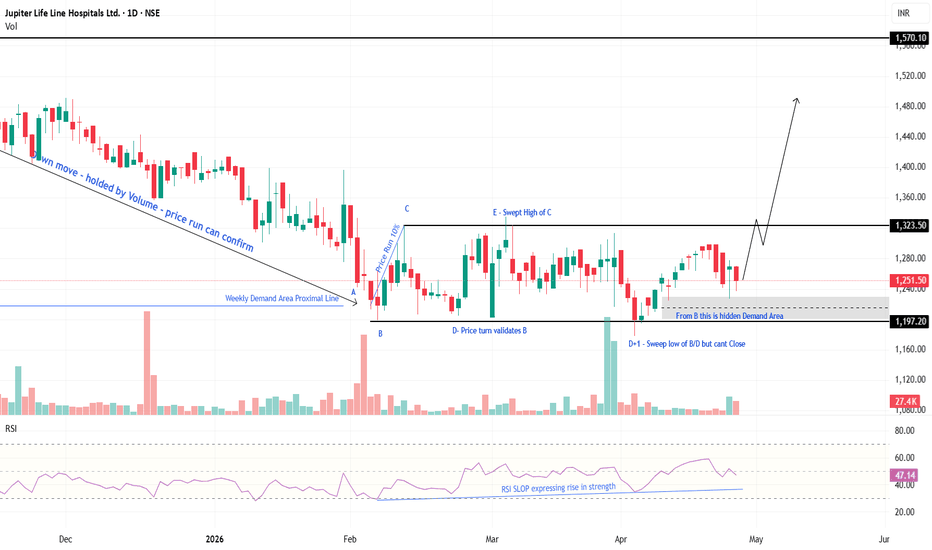
JLHL - A detailed Price action observationNSE:JLHL
Jupiter Life Line Hospitals Ltd - A detail price action observation
⚠️ DISCLAIMER :
I am NOT a SEBI-registered investment advisor. This is a personal technical observation for educational purposes only. It is NOT a recommendation to buy, sell, or hold any security. Trading involves substantial risk of loss. Consult a SEBI-registered advisor before making investment decisions.
From 52 W high, price was arrived at area of origin from where past move get originated
First sign was high volume (Point A)
Selling Pressure was felt vanished may be due to passive buying
Price Run 10% in few session due to lack of liquidly - 3rd Sign (B to C)
Price moved down with drying volume & returned to B point but not broke (D)
From D another fast move towards C and made Sweep - Validating Big Player positioning (E)
Price intermediately come down with low to high volume in between E to D range
Again Price shown a shake out type move to grab liquidity (D1)
Till then price slowly shifting up with low volume
Within consolidation, RSI expressing strength
Conclusion
Drawn gray area is possibly an area of absorption since Point B with active as well as passive buy orders possibly triggered, so we may concludes an accumulation is going on silently.
=================================================================================
NOT A RECOMMENDATION: This post is strictly for educational purposes to demonstrate price action principles and observation skills. I am NOT a SEBI-registered Investment Advisor or Research Analyst. Many time I was proven failed in past.
NO CALL TO ACTION: Do not treat this as a "Buy," "Sell," or "Hold" instruction. No specific price targets or stop-loss levels are being provided.
MARKET RISK: Equity investments are subject to market risks. Past performance and chart patterns do not guarantee future results.
PERSONAL DISCLOSURE: I may have a personal interest or position in this stock. My views are personal and should not be used as a basis for financial decisions.
ADVICE: Always consult a qualified and SEBI-registered financial professional before investing your capital.
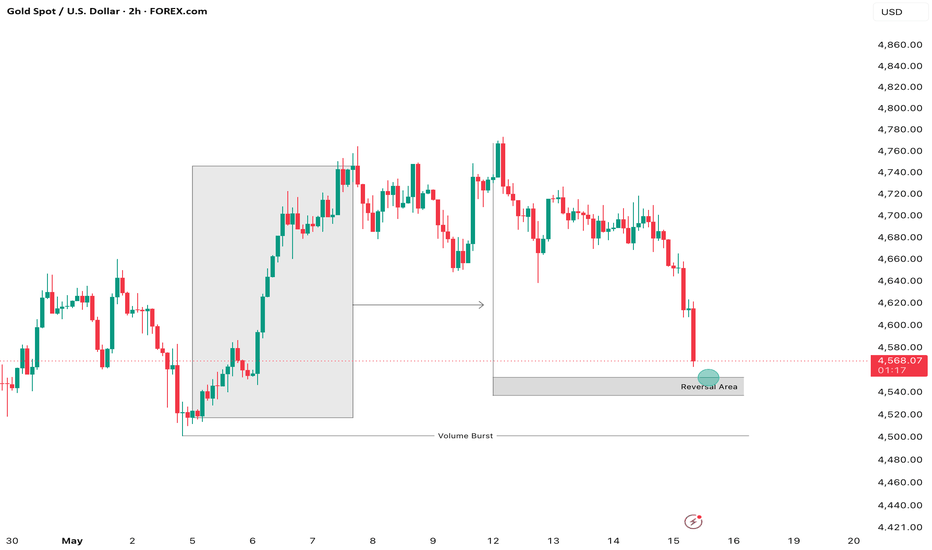
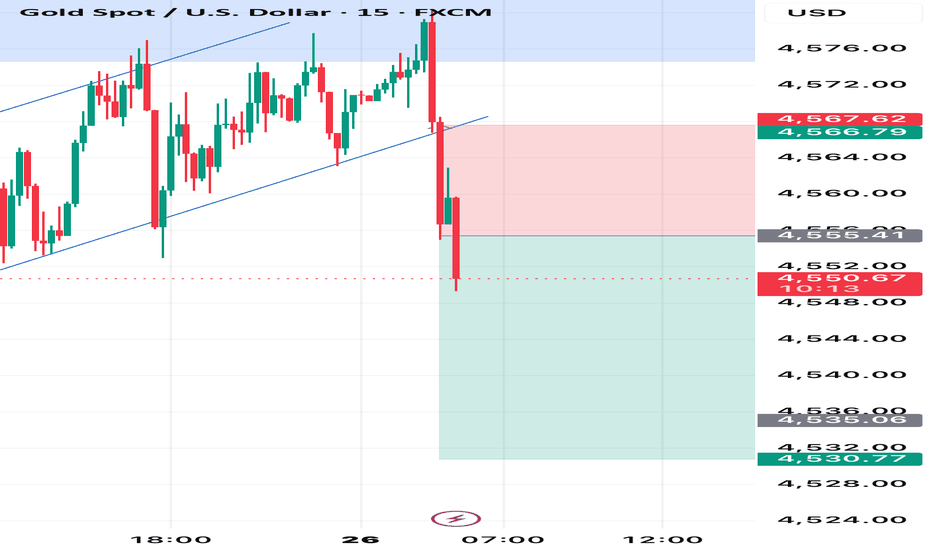
Market Analysis Summary: XAUUSD (Gold Spot)1. Structural Context & Trend Shift
Timeframe Focus: 2-Hour (2H) chart.
Recent Price Action: Gold experienced a strong bullish rally from May 5 to May 12, creating a well-defined consolidation block (gray shaded area).
2. Key Technical Levels
Current Price: $4,567.52 (-1.82%).
Immediate Support: The "Reversal Area" is identified between $4,535.00 and $4,550.00.
Critical Liquidity Level: The "Volume Burst" line marks major historical buying liquidity near $4,500.00.
Key Resistance: Previous structural breakdown point at $4,635.00.
3. Trading Scenario Breakdown
Condition: Price must find structural stability and print a bullish confirmation pattern (e.g., engulfing candle, pin bar) inside the designated Reversal Area ($4,535 – $4,550).
Target: A technical bounce targeting the $4,635 resistance zone.Invalidation: A clean 2H candle close below $4,530 invalidates the immediate long bias.
Bearish Scenario (Trend Continuation)
Target: Extension lower to sweep the critical Volume Burst liquidity level near $4,500.
Will 23800 act as a RESISTANCE??As we can see NIFTY showed a strong upmove which was unexpected but we can expect NIFTY to reject at 23800 levels which is also a neckline of the breakdown of m pattern so we may see NIFTY getting rejected at those areas. So plan your trades accordingly and keep watching everyone.
How To Understad Option?Institutional Option Trading (7 Key Points):
Smart Money Activity – Institutions like banks, hedge funds, and FIIs trade options with large capital, creating strong directional moves in the market.
Option Chain Analysis – They focus on OI buildup, unwinding, and PCR to identify accumulation/distribution zones.
Liquidity Zones – Institutions trade where liquidity is high (ITM/ATM strikes), ensuring easy entry and exit without slippage.
Hedging Strategies – Use advanced strategies like spreads, straddles, and strangles to manage risk instead of naked positions.
Volatility Play (VIX Focus) – Institutional traders trade based on implied volatility expansion and contraction, not just price direction.
Support & Resistance Creation – Major OI levels act as strong support/resistance due to institutional positioning.
IGB 10Y Weekly UpdateIGB 10Y closed 3 bps higher for the week while it continued to trade in the range of 6.88%-7.06% given the geopolitical uncertainty. I expect the yields to trade in the same range for the upcoming week as well, unless there is a big positive or negative development happens wrt US-Iran war.
Let me know your views. DYOR
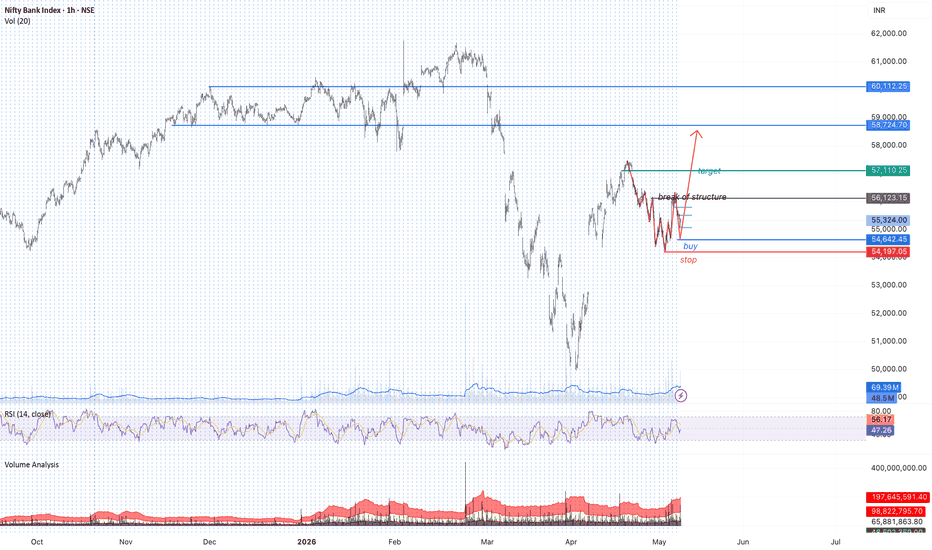
Bank nifty upside move possiblePrice has successfully broken structure to the upside, signaling a potential shift in market bias from bearish to bullish. After sweeping sell-side liquidity below key lows, Bank Nifty printed a strong BOS candle closing above the previous swing high indicating smart money accumulation.
Bulls are now in control of short-term structure. As long as price holds above the BOS level, an upside continuation toward the next resistance buy-side liquidity zone remains the higher probability outcome. Dips into the order block or fair value gap can be considered potential long opportunities with defined risk.
Institution Option Trading Part-2PCR (Put-Call Ratio) – Institutional Trading Strategy
What is PCR?
PCR = Put OI ÷ Call OI
It shows market sentiment of big players in indices like NIFTY 50.
Institutional Psychology
2. How Big Players Use PCR
Retail buys options randomly
Institutions control PCR zones to trap traders
👉 You follow PCR = You follow smart money
📈 PCR Levels (Game Changer)
3. Key Zones
PCR < 0.7 → Bearish sentiment (too many Calls) → ⚠️ Reversal possible
PCR 0.7 – 1 → Neutral zone
PCR > 1.2 → Bullish sentiment (too many Puts) → ⚠️ Reversal possible
👉 Extreme PCR = Trap zone (Institutional move coming)
🔥 Pro Institutional Setup
4. Entry Logic
PCR very high (1.3+) + Resistance → SELL (market fall likely)
PCR very low (0.6-) + Support → BUY (market bounce likely)
Institutional Trading Masterclass Part - 2Core Structure of Institutional Option Trading
Institutions focus on 4 pillars:
A. Direction
Will market go up, down, sideways?
B. Volatility
Will movement increase or decrease?
C. Time Decay
How much premium melts daily?
D. Risk Exposure
How much capital at risk?
Rules to Become Consistent
Never trade without plan
Never increase size emotionally
Never revenge trade
Protect capital first
Focus on process daily
Take breaks after losses
Journal every trade
Stay physically healthy
Sleep properly
Keep learning