 Long
LongCandlestick Analysis
Long
LT Weekly follow up and track Since the channel has been broken wave iii is complete and we are in a wave iv . It has reached wave 4 of one lesser degree . Since wave iii is a 5 wave move with and extended wave 1 , we can expect correction till wave 2 of one lesser degree ie the blue patch shown . Note we can initiate buying only when reversal with support occurs eg Hammer , Morning star , Moribozu , Engulfing green etc . buying then will be considered established only when the highest high of these formations are traded with support . Regards


NIFTY failed to REVERSE! What’s next? As we can see NIFTY broke down our channel and fell unidirectionally despite our view being on the buy side as we expected a strong REVERSAL from given levels. Now we can see it has formed more like a marabozu candle in daily time frame showing weakness hence if NIFTY opens weak to flat then we may see another strong downfall else if opens strong and inside the structure then we may see a strong REVERSAL so must be ready for both side tomorrow so plan your trades accordingly.


IT is ready for trend changeAfter Claimed 10EMA IT is ready for new run?
IT Index is consolidate at support line and after break 33800 they will upwards.


Godrej Consumer Cmp 1169 Flag Pattern & Hammer CandleGodrej Consumer Cmp 1169 dated 19-4-2024
1. Flag Pattern, taken support @ lower trend line.
2. Hammer Candle @ support
Buy above 1176 target 1200-1230-1250-1280 SL 1130
It is just a view, please trade at your own risk.
 Long
Long
DELHIVERY - Weekly AnalysisIn the Weekly Chart of DELHIVERY ,
we can see that, after breakout, it has done a very strong consolidation.
Also, now it has created a Hammer candle.
Enter on breaking its high with low as SL.
 Long
Long
PARAS - Weekly AnalysisIn the Weekly Chart of PARAS ,
we can see that, it has started to become bullish.
This Defense Sector stock will show a good run in next 4-6 months.
Expected momentum is shown in chart.
 Long
Long
HGS - Weekly AnalysisIn the Weekly Chart of HGS ,
we can see that; it has shown a recovery sign from 720 levels.
Now it has created a Halt candle.
Enter on breaking its high with low as SL.
 Long
Long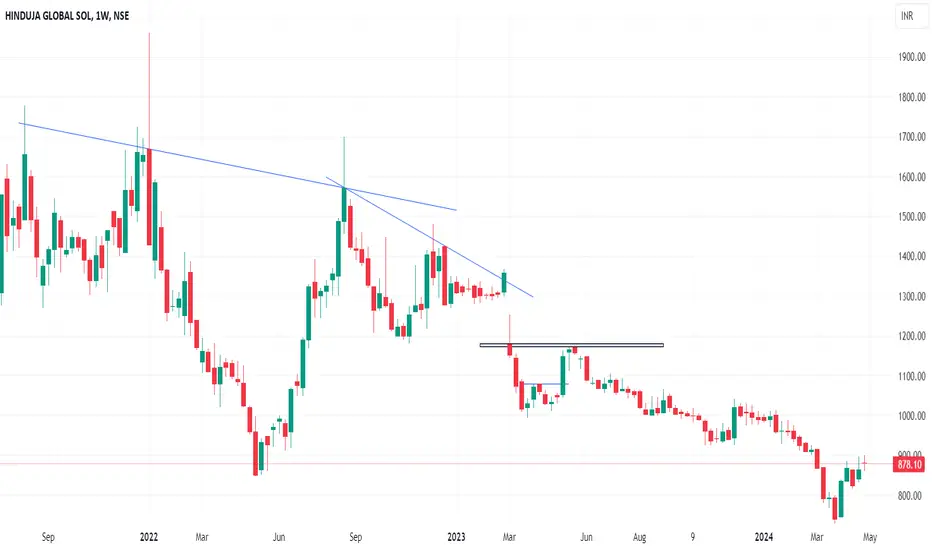
TATVA - Weekly AnalysisIn the Weekly Chart of TATVA ,
we can see that; it has made inside Decision making candle.
Enter on breaking its high with low as SL.
 Long
Long
TATAELXSI - Weekly AnalysisIn the Weekly Chart of TATAELXSI ,
we can see that, after breakdown, it has created a Hammer candle on support trendline.
Enter on breaking its high with low as SL.
 Long
Long
Positional or Longterm Opportunity in MothersonGo Long above 93.95 for Targets of 105.65, and 125.15 with SL 90.05
Reasons to go Long:
1. On a weekly timeframe if we draw the Fibonacci retracement tool from the swing low (point A) to the swing high (point B) then we see stock took support from the 0.382 Fibonacci level.
2. Also a bullish candlestick pattern Bullish Engulfing (marked with orange color) is formed around 0.5 Fibonacci level.
3. In addition to this there is a strong demand zone (marked with purple color), from which the stock initially faced resistance but now is taking support and moving up.
 Long
Long
Positional or Long term Opportunity in Craftsman AutomationGo Long @ 4160.1 for Targets of 4456.75, 4753.4, 5050.05 and 5346.7 with SL 3863.45
Reasons to go Long :
1. On a Weekly timeframe if we draw the Fibonacci retracement tool from the recent swing low (point A) to the recent swing high (point B) then we see stock took support from the 0.382 Fibonacci level.
2. In addition to this a bullish candlestick pattern Bullish Hammer (marked with orange color) is formed around the 0.382 Fibonacci level.
3. Also there is a strong Trendline (marked with green color), from which the stock is taking support and moving up.
 Long
Long
Positional or Longterm opportunity in RatnamaniGo Long @ 2915.1 for Targets of 3110.2, 3305.3, and 3500.4 with SL 2720
Reasons to go Long :
1. On a Weekly timeframe if we draw the Fibonacci retracement tool from the recent swing low (point A) to the recent swing high (point B) then we see stock took support from the 0.382 Fibonacci level.
2. In addition to this a bullish candlestick pattern Bullish Harami (marked with orange color) is formed around the 0.382 Fibonacci level.
3. Also there is a strong Trendline (marked with green color), from which the stock is taking support and moving up.
 Long
Long
DELTACORP - Weekly AnalysisIn the Weekly Chart of DELTACORP ,
we can see that, after the breakdown, it is trying to recover.
Inside & Hammer candle is formed.
Enter on breaking its high with low as SL.
 Long
Long
NAZARA - Weekly AnalysisIn the Weekly Chart of NAZARA ,
we can see that, after the breakdown from support it has now formed a Hammer candle.
Expected momentums are shown in chart.
 Long
Long
FINEORG - Weekly AnalysisIn the Weekly Chart of FINEORG ,
we can see that, after Trendline breakdown, it showed a recovery.
Expected momentum is shown in chart.
 Long
Long