Candlestick Analysis
Gold at Key Support: Bounce or Breakdown?Gold is currently trading near a critical demand zone between $5040–$5055, which has acted as a strong support area during recent price action. This zone is important because buyers have repeatedly stepped in here to defend prices and prevent deeper declines.
If buyers continue to defend this support, gold could maintain its bullish structure and attempt a move higher. The next key upside target would be the nearby resistance zone around $5170–$5200, where previous selling pressure has appeared. A sustained bounce from support could trigger momentum buying toward that level.
However, traders should closely watch $5040, as it acts as the line in the sand for bulls.
If price breaks and closes below $5040, it would signal that buyers are losing control. In that scenario, the bullish momentum may weaken and gold could move lower toward the next support range between $5000 and $4980, where stronger demand may emerge again.
Key Levels to Watch
📍 Support: $5055 – $5040
📍 Major Support: $5000 – $4980
📍 Resistance: $5170 – $5200
Trading Perspective
As long as gold holds above the $5040 support zone, the bias remains bullish with potential upside continuation.
A clean break below $5040, however, could shift sentiment and trigger short-term downside pressure toward $5000.
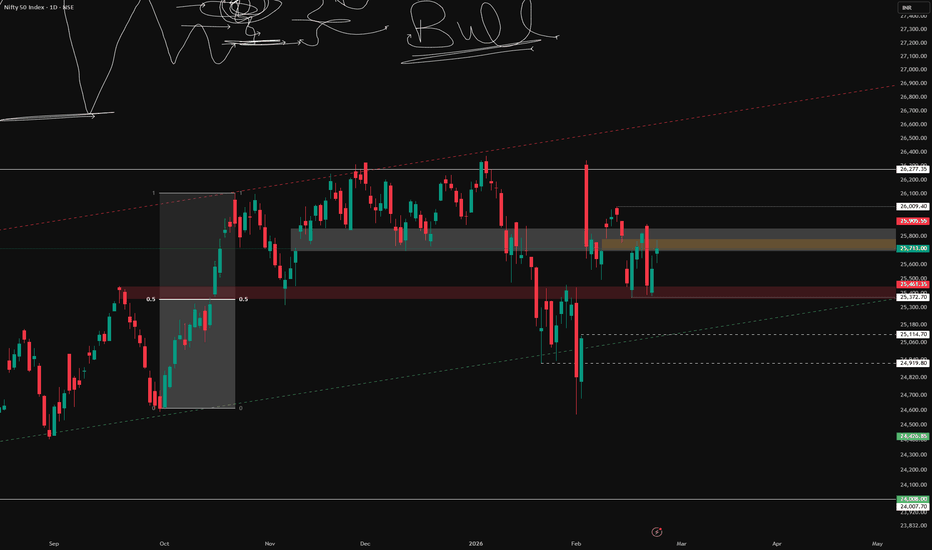
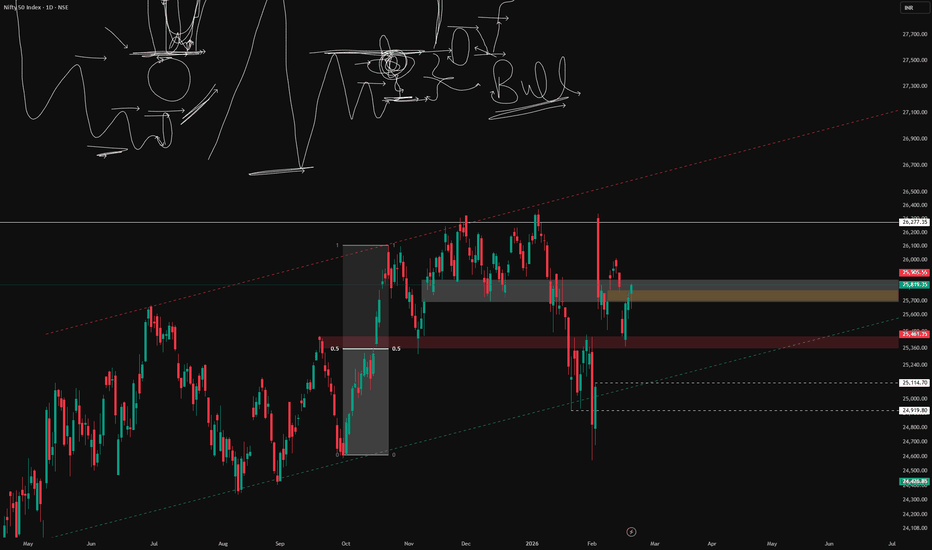
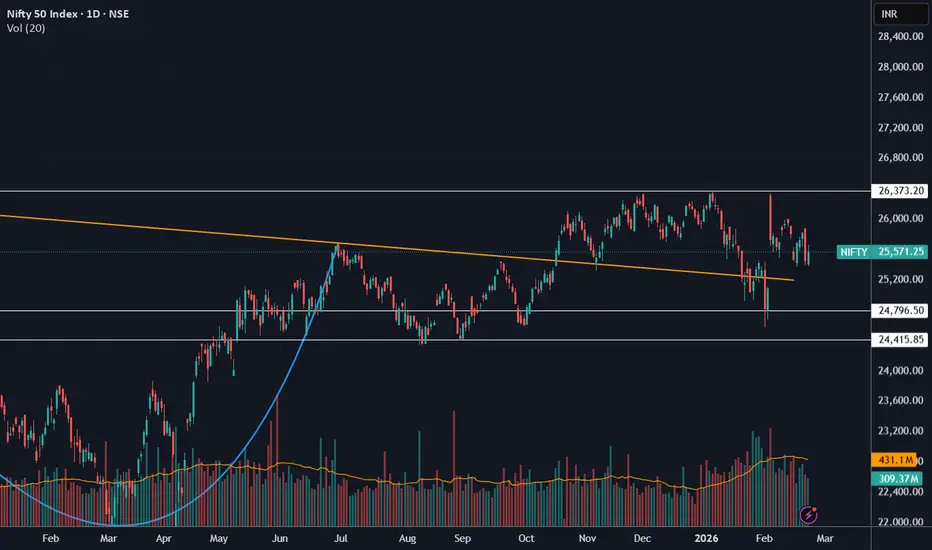
NIFTY Weekly UpdateNIFTY is expected to trade in the range of 24800-26380 levels for the upcoming week. 26380 has been acting as a strong resistance since last few months, and I expect this will continue for the week. A close above this level(26400), will fuel the rally. On the downside, a breach of 24800 levels, likley to take NIFTY to its next support level of 24400.
Last Hope Of Asian paintNSE:ASIANPAINT
Last hope of Asian paint is near to break or make.
weekly time frame shows negative price action totally
daily time frame have also but in that time frame show spinning tops with high volume 2 times but price still not break his first near resistance around 2460.
If weekly down move continue then target is 1850 and also that price have support line.
Upside also limited area near to 2600.
please do your own research before taking any trade.
i am not financial advisor
risk is real stay practical
please feel free to ask any questions
ONGCONGC
Price above all EMA on weekly and daily chart shows its strength.
Recently it closes above its weekly/monthly range and price sustain above the level.
May have little hurdle near 290-300 but then it moves above 300
QoQ shows improving
Rest sectorial stocks like BPCL, IOC, MGL etc are showing showing strong moves.
NB: I am not a Registered analyst, do take advice from your financial advisor prior trade.
IGB 10Y Weekly UpdateIndia Goverment Bonds 10Y for the coming week are expected to trade in the range of 6.65%-6.78%. 6.65% has been acting as a crucial support since last few weeks and it expected to remain the same. If it breaches, this level, it likely to find support at 6.60%, which acted as resistance in the earlier range bound motion. On the upside, if it breaches 6.75% level,it may find resistance at 6.88% levels.
EUR/USD – Tactical Short
1H Supply Repricing Within Established Bearish Order Flow
Execution Timeframe: 5M | Risk Model: Intraday Tactical Allocation
I. Market Context & Structural Bias
EUR/USD remains in a clearly defined 1H bearish auction structure, characterized by sequential lower highs and lower lows. The latest expansion leg has printed a fresh 1H lower low, confirming downside initiative and continuation order flow.
The current upward move is a corrective repricing phase into previously identified 1H supply. The retracement lacks impulsive breadth and displays overlapping structure — consistent with liquidity rebalance rather than structural reversal.
From a flow perspective, the market is repricing to facilitate further distribution.
Directional Bias: Bearish while below the most recent 1H lower high.
No structural evidence currently supports higher-timeframe reversal.
II. Trade Thesis
This is a continuation trade within an established bearish regime.
The working assumption:
• The recent 1H impulse created inefficiency.
• The current retracement is seeking resting liquidity within supply.
• Upon liquidity completion, initiative sellers are expected to reassert control.
• External sell-side liquidity below the 1H lower low remains magnetized.
We are positioning for continuation, not calling a top.
III. Execution Framework (Confirmation-Based Participation)
Capital deployment is conditional, not anticipatory.
We require the following on 5M:
• Internal liquidity sweep into 1H supply
• Inability to sustain trade higher (auction inefficiency)
• Clear 5M bearish MSS
• Displacement candle confirming initiative sell-side participation
Without displacement, there is no confirmation of active distribution.
This converts location into validated structural opportunity.
IV. Trade Construction
Entry:
• Short exposure initiated only upon confirmed 5M bearish MSS post-liquidity sweep.
Risk Definition:
• Hard stop above the 5M structural high that defines the MSS.
• Invalidation must remain structural and binary.
Primary Objective:
• Prior 1H lower low (external liquidity pool).
Extended Objective:
• Continuation through the 1H low toward resting liquidity aligned with 4H value reference (POC region).
Asymmetry Requirement:
• Minimum 3:1 R multiple to justify capital allocation.
If projected R:R compresses below threshold, the trade is declined.
V. Risk Allocation & Portfolio Considerations
• Position sizing: 25–50 bps of total book (scaled based on realized volatility).
• Correlation check against USD index and risk sentiment proxies before entry.
• No pyramiding unless downside momentum confirms expansion.
• Partial de-risking may occur near 2R if tape transitions to balance.
Execution discipline supersedes conviction.
VI. Failure Conditions
The thesis is invalidated under any of the following:
• Sustained acceptance above 1H supply.
• Bullish 5M MSS within the zone.
• Strong impulsive continuation through supply indicating active higher-timeframe accumulation.
If supply fails, short exposure is mechanically unjustified.
VII. Professional Assessment of Edge
This setup offers structural alignment across timeframes:
• Higher-timeframe directional control
• Premium location entry
• Defined structural invalidation
• Clear external liquidity objective
• Favorable asymmetry profile
Edge is derived from alignment, confirmation, and disciplined risk deployment — not narrative bias.
Executive Summary
We are tactically positioning for continuation within an established 1H bearish order-flow regime. Participation is conditional upon 5M structural failure and downside displacement confirming active distribution.
Risk is tightly defined.
Reward is external liquidity below the 1H low.
Execution is rules-based, not discretionary.
This is a flow-aligned continuation framework appropriate for controlled intraday capital deployment.
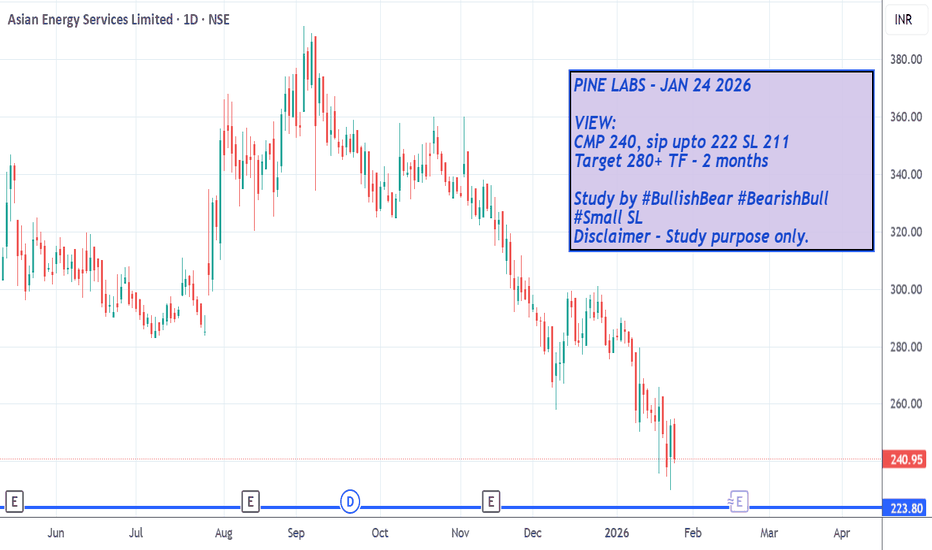
ASIAN ENERGY APPROACHES SUPPORT ZONEASIAN energy chart pattern shows stock is kissing its strong support zone.
one more risk reward study.
Few strong candles hints activity on this stock is happening. Watch out for the bounce.
Last candle is red candle, if green candle with volume is seen enter with small risk.
BTC Reversal or still bearish (13/02/2026).BTC is trading in a parallel channel.
Major Trend :- Bearish
Minor Trend :- Range Bound.
A bearish scalp trade can be taken upto the support levels of the channel. With a SL being a candle closing above the channel.
If there are halt candle near the resistance levels and a BO occurs, a 1000 points trade in BTC can be taken and trailed upto the upper levels if the trend line resistance is also breached.
Actually, there are good targets on the upper side with good RR.
Bullish Plan
Entry :- Close above 67600
SL :- 66800
Target :- 68350, 71460.
R:R = 1:1 and 1:4.5 (considering Target 2).
As per the plan, BTC will give a double BO i.e. 20 EMA (4H) and Resistance Zone.
Wait for the price action. BTC is in a sideway to volatile zone.
Enter with a proper SL and trail target on the upper side.
On the Bearish side, there is limited targets or a scalp trade.
Happy Trading.
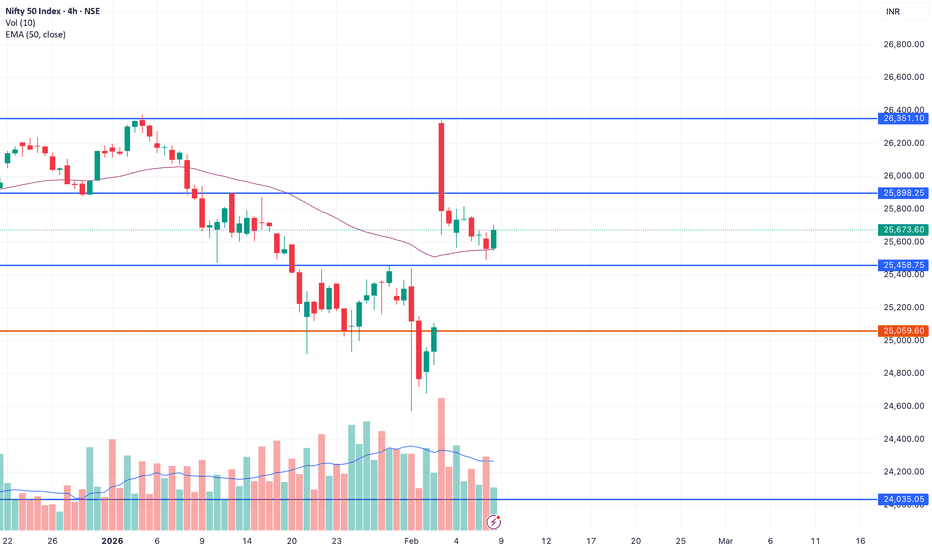
NIFTY50 // BULLISH ENGULFING // 4HR TFHey folks,
I am looking here at the 4hr TF of Nifty 50 with EMA 50.
A visible Bullish engulfing on the 4hr tf has formed today above 50EMA, confirming the support of the moving average.
I know it is not a perfect bullish engulfing some of you might say, because of current 4hr candle open was not below previous one close. But in Chart analysis there is a rule that you to be versatile and flexible regarding these patterns, so it can be said that the two said price points are marginally close to consider this a engulfing.
Also, seeing little angle of the previous candle lower wick ( a good long one) it can be interpreted that the buy orders absorbed the good qty of sellers.
thus, I am going for a small long position in Nifty CE for next 4hrs candles till expiry of 10feb.
NIFTY 10FEB 26000CE.
Now just hoping for the "TRUMP" element to stay put down over the weekend.🤞🏼
:) Thanks. Happy Trading.
NIFTY will get even weaker below 25750As we can see NIFTY remained negative to sluggish thorought the day exactly as analysed and it’s been 3 days now and expected to remain the unless it breaks and sustains below 25750 levels that will make him even weaker leading him towards immediate demand zone which can show signs of rejection hence we can expect another negative day if our criteria’s are met. So plan your trades accordingly and keep watching everyone
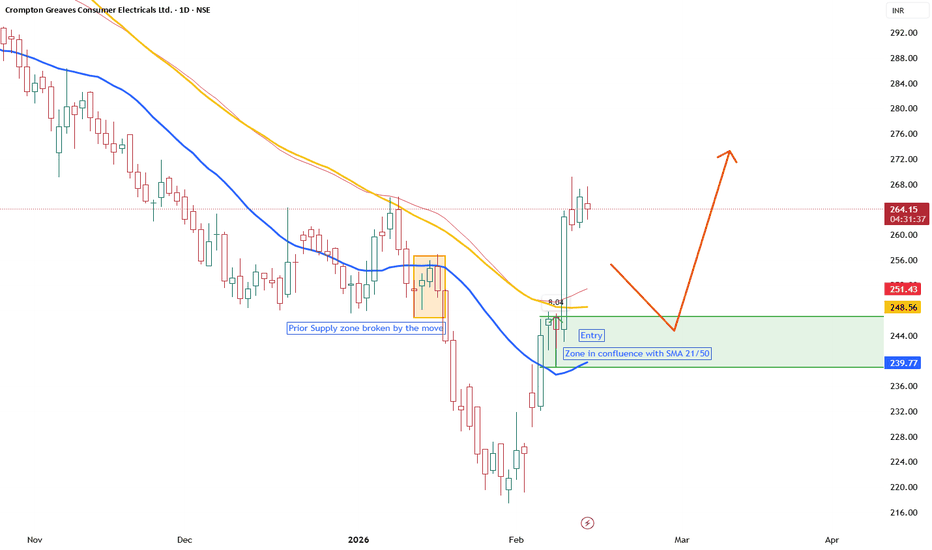
Crompton Greaves Consumer Electricals Ltd – Long Trade SetupPrice action has recently broken above a prior supply zone, confirming bullish momentum. The current structure shows a healthy retracement opportunity into a strong demand area which is in confluence with the 21-day and 50-day SMAs.
- Confirmation: Prior supply zone broken, trend structure intact
- Bias: Long, expecting continuation after retest
- Invalidation: Close below ₹239.76 would weaken the setup
This trade idea is based on supply-demand dynamics, moving average confluence, and structural breakout. A dip into the highlighted zone offers a favorable risk-reward entry for continuation of the bullish move.
Hindustan Copper – Breakout, Retest & Bullish Continuation SetupNSE:HINDCOPPER
Hindustan Copper has delivered a powerful breakout followed by healthy consolidation near highs — indicating strength rather than exhaustion.
Technical Observations
Breakout zone: ₹570–₹590 area (now acting as support)
Current structure: Flag-type consolidation near highs
Volume: Expansion during breakout, contraction during pullback (healthy)
EMA alignment: 21 EMA > 50 EMA (bullish structure intact)
Momentum is cooling slightly but price is not breaking down — this indicates accumulation.
Bullish Continuation:
If price sustains above ₹590–₹600 zone → Possible move towards ₹650–₹680 and beyond.
Invalidation:
Daily close below ₹560 weakens structure.
PCBL: Reversal Structure and Key LevelsThe stock of PCBL has experienced a significant decline from the ₹437 level, followed by a notable recovery from a major support zone, often referred to by traders as a discount or value area. Recent price behaviour indicates the possibility of a trend reversal supported by multiple technical factors.
After a prolonged down move, the stock has reacted strongly from a key bottom support level.
On the weekly chart, the formation of an inverted hammer at this zone adds weight to the expectation of a potential reversal, as this pattern often appears near the end of extended downtrends.
A bullish MACD crossover has been observed on the weekly timeframe, signalling a possible shift in medium‑term momentum. On the daily chart, the RSI has moved above 60, reflecting strengthening bullish sentiment without reaching extremely overbought conditions.
Based on previous price action, an immediate supply zone near ₹341 may act as the first area where sellers could reappear.
Price behaviour around this level will be important for assessing the sustainability of the recent bounce.
Key Levels:
Immediate Supply / Resistance Zone: ₹341
Major Support Zone: ₹255
Disclaimer: This analysis is intended solely for educational and informational purposes. It does not constitute financial advice or a recommendation to buy, sell, or hold any security. Market participants should evaluate risks independently and consult a licensed financial professional before making investment decisions.
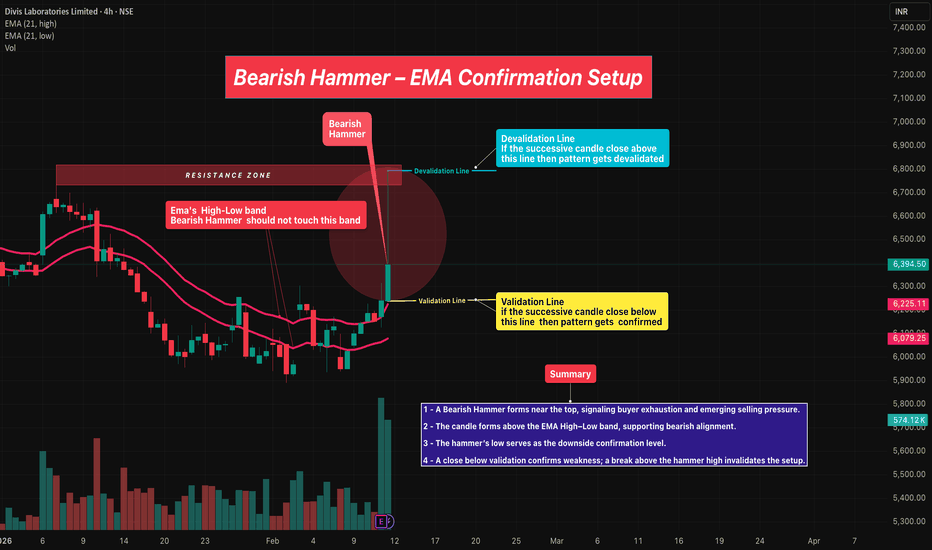
Bearish Hammer – EMA Confirmation Setup🧭 Overview
The Bearish Hammer pattern appears near the top of an upward move and signals potential buyer exhaustion. When combined with EMA High–Low band alignment, it provides a structured approach to identify early downside pressure.
⸻⸻⸻⸻⸻⸻⸻⸻⸻⸻⸻⸻⸻⸻
📘 Concept
A Bearish Hammer forms after an advance, where price attempts to move higher but faces strong rejection. The long upper wick reflects selling pressure entering the market.
To increase reliability, this setup is combined with the EMA High–Low band:
• The hammer should form above the EMA band.
• The EMA band should not touch the hammer body.
This alignment strengthens bearish bias within the broader structure.
⸻⸻⸻⸻⸻⸻⸻⸻⸻⸻⸻⸻⸻⸻
📊 Chart Explanation
1️⃣ A Bearish Hammer forms near the top of the move, indicating buyer exhaustion.
2️⃣ The candle appears above the EMA High–Low band, supporting bearish alignment.
3️⃣ The hammer’s low acts as the validation line for downside confirmation.
4️⃣ A close below the validation line confirms weakness.
5️⃣ A break above the hammer high acts as the devalidation level and cancels the setup.
⸻⸻⸻⸻⸻⸻⸻⸻⸻⸻⸻⸻⸻⸻
📝 Summary
Bearish Hammer near highs signals early selling pressure.
EMA band alignment improves structure clarity.
Close below the hammer low confirms the setup.
Break above hammer high invalidates the pattern.
⸻⸻⸻⸻⸻⸻⸻⸻⸻⸻⸻⸻⸻⸻
⚠️ Disclaimer
📘 For educational purposes only.
🙅 Not SEBI registered.
❌ Not a buy/sell recommendation.
🧠 Purely a learning resource.
📊 Not Financial Advice.
Chambal fert 1D TF, 9 feb, showing reversal signs#chamblfert #chambalfert
Currently trading at pe of 9 vs pe of industrial pe 23.
It is almost half of it and considering it's monopoly and legacy if it trades towards pe of 40. Stock price has lot of potential to reach towards ath.
Giving dividend of 10 rs annual.
Technical levels are plotted on charts.
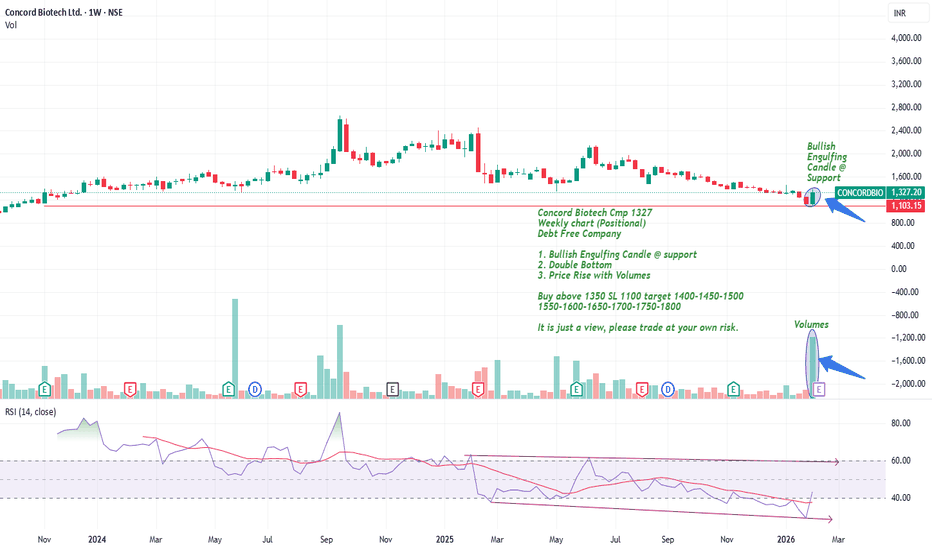
Concord Biotech Cmp 1327 Bullish Engulfing Candle @ supportConcord Biotech Cmp 1327
Weekly chart (Positional)
Debt Free Company
1. Bullish Engulfing Candle @ support
2. Double Bottom
3. Price Rise with Volumes
Buy above 1350 SL 1100 target 1400-1450-1500
1550-1600-1650-1700-1750-1800
It is just a view, please trade at your own risk.