Long
Long
 Long
Long
 Long
Long
 Short
Short
 Long
Long
 Long
Long
 Long
Long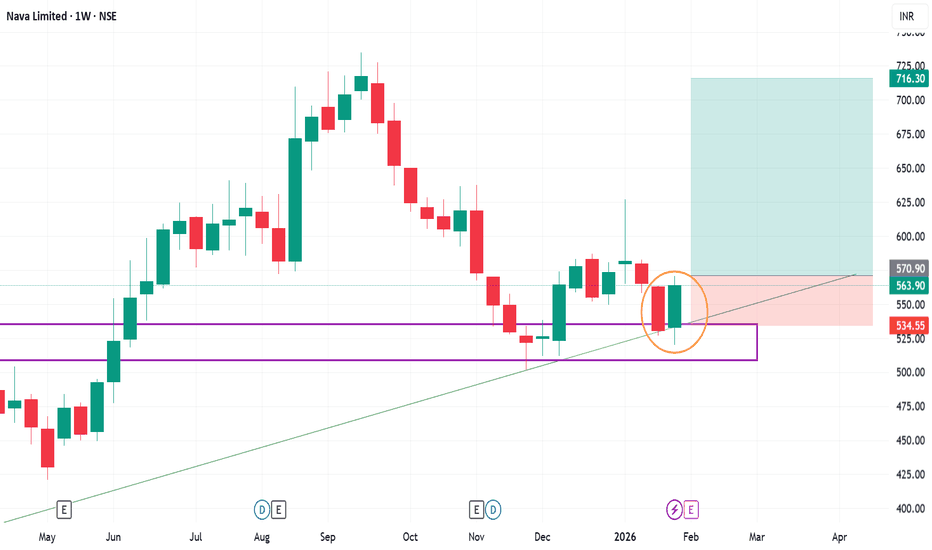
 Short
Short
 Long
Long
Long 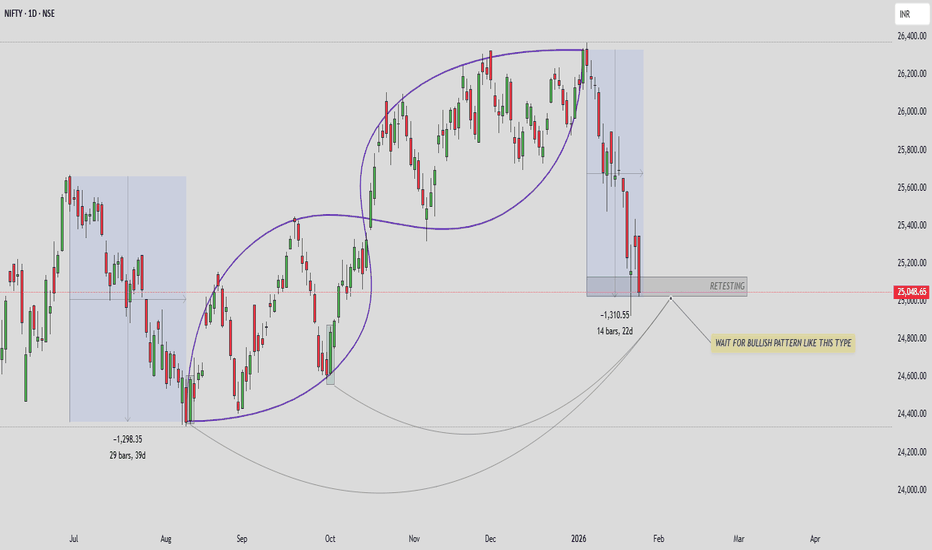
 Long
Long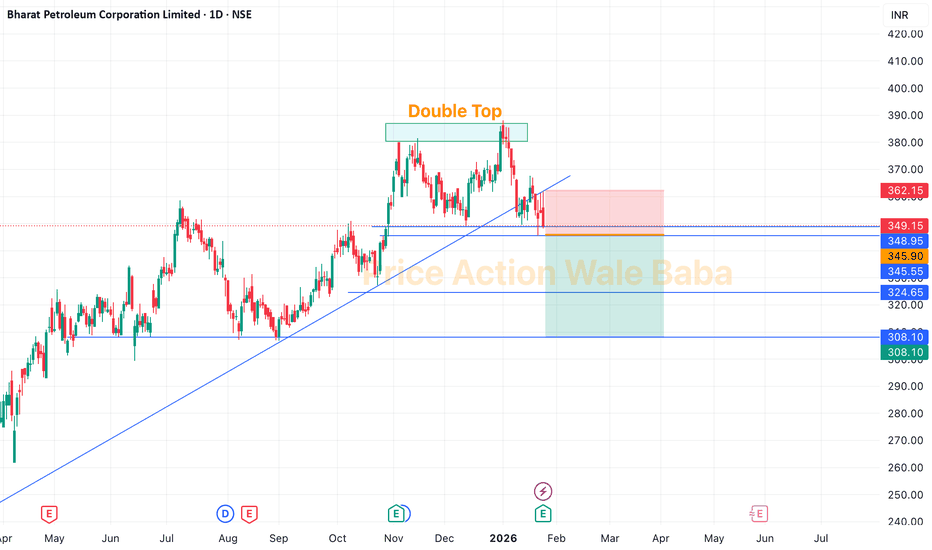
NIFTY Faces Pressure: Can 24,300 Hold?NIFTY has turned weak after falling around 2.5% on the weekly chart. The index has made a double top near 26,250, which usually means the market is finding it hard to move higher from that area.
On the weekly chart, the candles look bearish. NIFTY is currently holding near an important support around 25,000 (50 EMA). If this level breaks, the market may move lower towards 24,300 and even 23,900.
On the daily chart, NIFTY is trading below all major moving averages (20, 50, 100 & 200 EMA). In the past, whenever NIFTY stayed below these averages, it usually corrected further. Right now, there is no strong support before 24,600.
On the monthly chart, a double top is visible again, showing weakness at higher levels. However, there is decent support near 24,300–24,240, which is also close to the monthly 20 EMA.
Momentum is also weakening. RSI is showing bearish divergence on weekly and monthly charts, which suggests upside strength is fading.
Resistance Levels :- 25,200 – 25,300, 25,500, 26,250
Support Levels :- 24,987, 24,600, 24,300 – 24,240, 23,900
Overall View
As long as NIFTY stays below 25,500, the trend remains weak. Market direction will become clearer near the 24,300 support zone. SUPREMEIND – STWP Equity Snapshot 📊 SUPREMEIND – Technical & Educational Snapshot
Ticker: NSE: SUPREMEIND
Sector: 🧪 Chemicals / Plastics
CMP: 3,500.80 ▲ (+4.15% | 22 Jan 2026)
Learning Rating: ⭐⭐⭐⭐☆ (Neutral–Range with Recovery Bias)
Chart Pattern Observed: 📊 Range Structure with Recovery from Demand
Candlestick Pattern Observed: Bullish Engulfing
📊 Technical Snapshot
SUPREMEIND is attempting a short-term stabilisation after a sharp corrective phase, with the latest daily candle showing a strong bullish response from lower demand zones. RSI is placed near 52.5, indicating neutral momentum with early signs of internal strength but no overbought pressure yet. Stochastic is around the mid-zone, suggesting recovery from oversold conditions rather than trend exhaustion. Bollinger Bands remain wide, reflecting elevated volatility and a market still adjusting after the decline, while price continues to trade below major supply zones — keeping the broader structure range-bound with recovery bias. MACD remains subdued, highlighting that momentum improvement is still developing rather than fully established. Price is currently interacting near the CPR band, which is relatively wide, typically associated with range-bound or two-sided price action. As long as price remains within or below the CPR zone, upside moves may face supply pressure, while sustained acceptance above the CPR pivot would be required to signal any meaningful directional shift.
📊 Volume Analysis
🔹 Current Volume: ~536K
🔹 Average Volume (20-period): ~252K ✅
💥 Volume is running at more than 2× the recent average, confirming active participation during the rebound from demand.
💡 Interpretation: Higher-than-average volume near support zones suggests genuine buying interest and supply absorption. However, for any sustained move toward upper range resistance, similar volume expansion will be required near higher levels to confirm acceptance.
🔑 Key Levels – Daily Timeframe
Support Areas: 3373 | 3258 | 3194
Resistance Areas: 3552 | 3616 | 3731
These are zones where price has paused or reacted earlier.
What’s Catching Our Eye: Sharp demand-led rebound with strong participation.
What to Watch For: Acceptance above CPR and nearby resistance.
Failure Zone: Loss of the recent demand base.
Risks to Watch: Overhead supply and wide CPR.
What to Expect Next: Range-bound move with recovery bias.
Bullish Case: Sustained Demand absorption may support recovery.
Bearish Case: Failure to hold Demand base risks deeper reversion.
Momentum Case: Strong Rebound momentum, needs follow-through.
STWP Equity Snapshot – SUPREMEIND
Intraday Setup:
Entry: 3,500.8
Invalidation level: 3,237.11
Reference 1: 3,817.23
Reference 2: 4,028.18
Swing Setup (Hybrid Model – 2–5 days):
Entry: 3,500.8
Invalidation level: 3,151.67
Reference 1: 4,199.06
Reference 2: 4,722.75
STWP View: Momentum: Strong | Trend: Range | Risk: High |Volume: High
Learning Note: Focus on structure, risk per trade and clean reviews – not prediction.
Disclaimer:
Educational view only. Not a Buy/Sell recommendation. Please consult a SEBI-registered advisor before making any decision. STWP is not responsible for trading decisions based on this post.
💬 Did this help you read the chart better?
🔼 Boost | ✍️ Comment | 🔁 Share with a learner
👉 Follow STWP for clean chart-reading insights
🚀 Stay Calm. Stay Clean. Trade With Patience.
 Long
Long
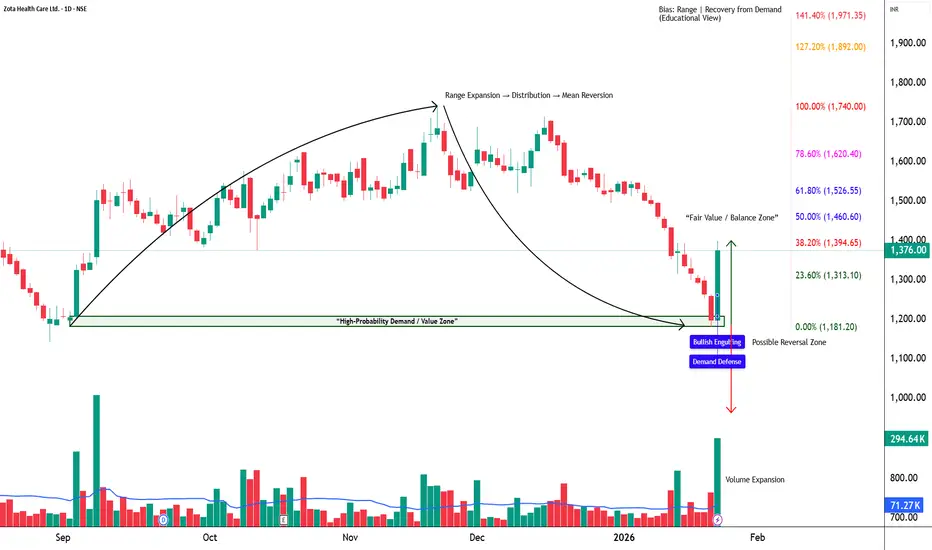
ZOTA - STWP Equity Snapshot📊 STWP Equity Snapshot – Zota Health Care Ltd
(Educational | Chart-Based Interpretation)
Market Structure
ZOTA witnessed a sharp corrective phase from higher levels, followed by a strong rebound from a well-defined demand zone. The recent candle stands out as a decisive bullish reaction, indicating aggressive buying interest after prolonged selling pressure. Despite the strength of the bounce, price is still trading within a broader range, and the larger trend structure has not yet shifted into a clear uptrend.
Demand–Supply Structure
Price moved deeply into a historical demand zone where buyers stepped in with conviction. The strong bullish candle suggests absorption of selling pressure and short-term buyer dominance. However, overhead supply zones remain active, meaning the current move should be viewed as a recovery from demand rather than a confirmed breakout. Sustained strength is required for further range expansion.
Key Levels – Daily Timeframe
Immediate demand zones are placed near 1376, followed by lower structural supports around 1290 and 1250. These are areas where buyers have previously defended price. On the upside, resistance zones are visible near 1451, 1526, and 1652, where selling pressure has historically emerged. These levels act as reaction zones and help define the current range.
What the Chart is Saying
Momentum has improved significantly after the recent bullish expansion, supported by strong volume participation. RSI is recovering from lower levels, indicating improving internal strength, but it is still not in a trending zone. The structure remains range-bound, suggesting that price may consolidate or oscillate between demand and supply zones before showing directional clarity.
CPR Impact
ZOTA is currently interacting with a wide CPR structure, which typically signals indecision and range-bound behavior. Earlier price action stayed below CPR resistance, reinforcing the lack of strong directional bias. For any sustained bullish shift, price would need to show acceptance above the CPR pivot with follow-through. Until then, the CPR structure supports a cautious, range-based view.
Additional Structure Observations
The rebound candle carries added significance as it formed with an open equal to the low, indicating immediate buyer control and minimal intraday selling pressure. This move was supported by clear volume expansion, suggesting participation beyond short-term traders and pointing toward stronger hands absorbing supply near demand. Short-term moving averages are attempting to turn up, reflecting improving momentum, while price remains below longer-term averages, keeping the broader structure neutral. RSI has recovered from lower levels but is still below bullish expansion zones, indicating support without trend confirmation. Additionally, the projected wide CPR for the next session reinforces the probability of consolidation or two-sided activity rather than immediate directional continuation. Overall, the move reflects strength from demand, but structural acceptance above nearby supply is still required for confirmation.
Intraday Reference Levels (Structure-Based)
The reference price zone near 1400 acts as a short-term decision area. Weakness below this zone may expose price toward lower demand regions around 1290. On the upside, reaction zones near 1450 and above are areas where price may pause or face selling pressure. These are observational levels, not predictions.
Swing Reference Levels (Hybrid Model | 2–5 Days)
For the short swing perspective, the 1400 zone remains the structural reference. Failure to hold demand increases downside risk toward deeper support zones. If strength sustains, higher range-expansion zones above previous resistance come into focus, but only as conditional possibilities within the broader range.
Final Outlook (Condition-Based)
Momentum is strong in the short term, supported by volume expansion. The trend remains range-bound, with no confirmed directional control yet. Risk remains high due to the counter-trend nature of the recovery and nearby supply zones. Volume is elevated, indicating participation, but structure confirmation is still pending.
💡 STWP Learning Note
Strong rebounds from demand show intent — not confirmation.
Let structure and acceptance guide bias, not candle size.
📘 STWP Approach
Observe price. Respect risk.
Trade structure, not excitement.
⚠️ Disclaimer
This post is shared strictly for educational and informational purposes.
It is not investment advice or a recommendation.
Please consult a SEBI-registered financial advisor before making any financial decision.
🚀 Stay Calm. Stay Clean. Trade With Patience.