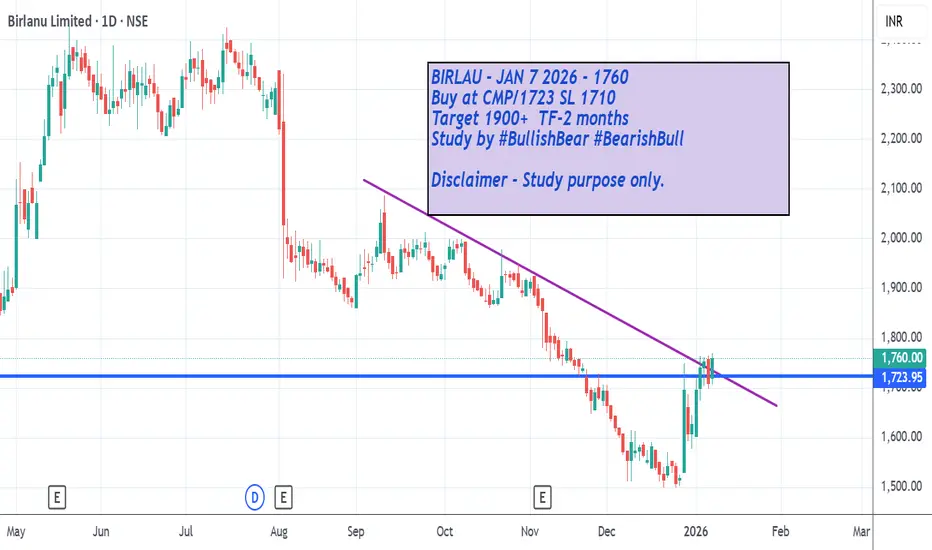
TREND LINE BREAKOUTBIRLANU has clearly trendline breakout. Simple chart, self explained study. Can make 1900+ with less risk.Longby SKGSpaceUpdated 0
PINE LABS HINTS UPMOVENegative ROE and ROCE over past years indicate the business wasn’t profitable for shareholders for some time. Profit margins were also low. But technically should perform well in upcoming days.. Recent candlesticks pattern hints stock can pick up from now.Longby SKGSpaceUpdated 5
ASIAN ENERGY APPROACHES SUPPORT ZONEASIAN energy chart pattern shows stock is kissing its strong support zone. one more risk reward study. Few strong candles hints activity on this stock is happening. Watch out for the bounce. Last candle is red candle, if green candle with volume is seen enter with small risk.Longby SKGSpaceUpdated 20
BTC Reversal or still bearish (13/02/2026).BTC is trading in a parallel channel. Major Trend :- Bearish Minor Trend :- Range Bound. A bearish scalp trade can be taken upto the support levels of the channel. With a SL being a candle closing above the channel. If there are halt candle near the resistance levels and a BO occurs, a 1000 points trade in BTC can be taken and trailed upto the upper levels if the trend line resistance is also breached. Actually, there are good targets on the upper side with good RR. Bullish Plan Entry :- CLongby TheMamboMomentumUpdated 293
NIFTY50 // BULLISH ENGULFING // 4HR TFHey folks, I am looking here at the 4hr TF of Nifty 50 with EMA 50. A visible Bullish engulfing on the 4hr tf has formed today above 50EMA, confirming the support of the moving average. I know it is not a perfect bullish engulfing some of you might say, because of current 4hr candle open was not below previous one close. But in Chart analysis there is a rule that you to be versatile and flexible regarding these patterns, so it can be said that the two said price points are marginally closeLongby kakarot_UIUpdated 0
NIFTY will get even weaker below 25750As we can see NIFTY remained negative to sluggish thorought the day exactly as analysed and it’s been 3 days now and expected to remain the unless it breaks and sustains below 25750 levels that will make him even weaker leading him towards immediate demand zone which can show signs of rejection hence we can expect another negative day if our criteria’s are met. So plan your trades accordingly and keep watching everyone by Kaushalfin3
Crompton Greaves Consumer Electricals Ltd – Long Trade SetupPrice action has recently broken above a prior supply zone, confirming bullish momentum. The current structure shows a healthy retracement opportunity into a strong demand area which is in confluence with the 21-day and 50-day SMAs. - Confirmation: Prior supply zone broken, trend structure intact - Bias: Long, expecting continuation after retest - Invalidation: Close below ₹239.76 would weaken the setup This trade idea is based on supply-demand dynamics, moving average confluence, and structuLongby the_sailor_trader12
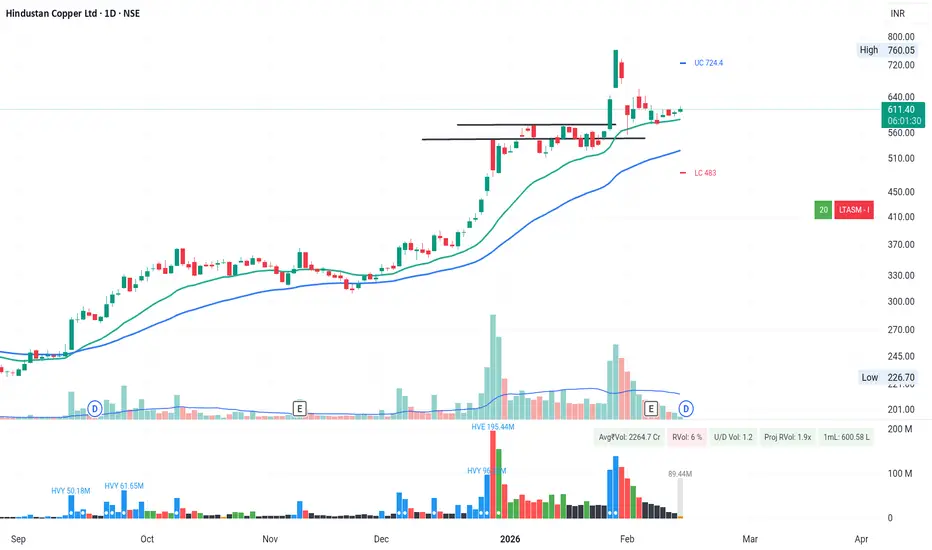
Hindustan Copper – Breakout, Retest & Bullish Continuation SetupNSE:HINDCOPPER Hindustan Copper has delivered a powerful breakout followed by healthy consolidation near highs — indicating strength rather than exhaustion. Technical Observations Breakout zone: ₹570–₹590 area (now acting as support) Current structure: Flag-type consolidation near highs Volume: Expansion during breakout, contraction during pullback (healthy) EMA alignment: 21 EMA > 50 EMA (bullish structure intact) Momentum is cooling slightly but price is not breaking down — this indicatesby Jothe_Vallal225
PCBL: Reversal Structure and Key LevelsThe stock of PCBL has experienced a significant decline from the ₹437 level, followed by a notable recovery from a major support zone, often referred to by traders as a discount or value area. Recent price behaviour indicates the possibility of a trend reversal supported by multiple technical factors. After a prolonged down move, the stock has reacted strongly from a key bottom support level. On the weekly chart, the formation of an inverted hammer at this zone adds weight to the expectatioLongby NiftyNotion6
Bearish Hammer – EMA Confirmation Setup🧭 Overview The Bearish Hammer pattern appears near the top of an upward move and signals potential buyer exhaustion. When combined with EMA High–Low band alignment, it provides a structured approach to identify early downside pressure. ⸻⸻⸻⸻⸻⸻⸻⸻⸻⸻⸻⸻⸻⸻ 📘 Concept A Bearish Hammer forms after an advance, where price attempts to move higher but faces strong rejection. The long upper wick reflects selling pressure entering the market. To increase reliability, this setup is combined with the EMShortby MarketAlgoBot2
Chambal fert 1D TF, 9 feb, showing reversal signs#chamblfert #chambalfert Currently trading at pe of 9 vs pe of industrial pe 23. It is almost half of it and considering it's monopoly and legacy if it trades towards pe of 40. Stock price has lot of potential to reach towards ath. Giving dividend of 10 rs annual. Technical levels are plotted on charts. Longby manideepcs0243
Concord Biotech Cmp 1327 Bullish Engulfing Candle @ supportConcord Biotech Cmp 1327 Weekly chart (Positional) Debt Free Company 1. Bullish Engulfing Candle @ support 2. Double Bottom 3. Price Rise with Volumes Buy above 1350 SL 1100 target 1400-1450-1500 1550-1600-1650-1700-1750-1800 It is just a view, please trade at your own risk. Longby ABC_XYZ12348
VadilalVadilal has made a bottom out and ready ti move up. It is good to buy and hold for the short term. Buy on deep and hold till May-June to gain handsome profit. Targets are 6500-8000-9500Longby isagar_chauhan_1
Positional or Long Term Opportunity in ITCGo Long @ 327.8 for Targets of 357, 377, and 423 with SL 309.45 Reasons to go Long : 1. On Weekly timeframe If we draw Fibonacci retracement from the recent swing low (A) to the swing high (B) then the stock took support from the 0.5 Fibonacci level. 2. In addition to this, the stock formed a Bullish Engulfing Pattern (marked with a orange color) around 0.5 Fibonacci level. 3. Also there is a strong demand zone (marked with a purple color) from which the stock is taking support. Longby Nimish_Ghagare6
Cempro Zone-based chart analysis approach applied consistently across stocks, crypto, and forex, focusing on price structure—not predictions.Longby leninpresent2
NIFTY is still weak and can break below anytime sooner$ As we can see NIFTY had been weak throughout the day despite getting rejected from the demand zone and the only hope is because it could maintain itself above the demand zone else a massive sell off could have taken place so now as soon as NIFTY breaks below the demand zone, that would potentially act as a supply zone giving fuel to the fire and exceeding weakness so plan your trades accordingly and keep watching the important zones.by Kaushalfin1
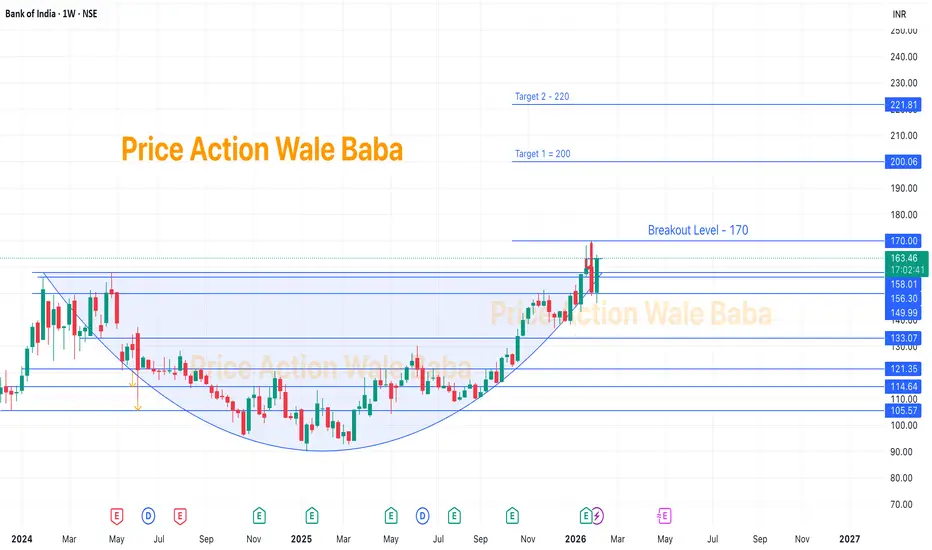
BankIndia - Rounding bottomBank of India has formed a rounding bottom pattern and also had a small breakout. It had made high of 170 and then come down for the resting. So, once it breaks and sustain above 170, you can buy and hold for the target of 200 and 220. Buy on every dips after breakout, it will give handsome amount of return.Longby isagar_chauhan_2
Signs of REVERSAL from our demand zone!? As we can see NIFTY managed to reverse exactly from our demand zone which was well anticipated but the holistic approach says we are still bearish following the global cues hence keep the bearish bias in long term, a short term reversal can be seen if NIFTY sustains itself above the demand zone so plan your trades accordingly and keep watching everyone.by Kaushalfin1
Positional or Longterm Opportunity in Triveni TurbineGo Long @ 506.5 for Targets of 619, 670, 721, and 818 with SL 462 Reasons to go Long : 1. On Weekly timeframe If we draw Fibonacci retracement from the recent swing low (A) to the swing high (B) then the stock took support from the 0.5 Fibonacci level. 2. In addition to this, the stock formed a Bullish Engulfing Pattern (marked with a orange color) around 0.5 Fibonacci level. 3. Also there is a strong demand zone (marked with a purple color) from which the stock is taking support. Longby Nimish_GhagareUpdated 2
Trent Ltd Cmp 3823 Bullish Engulfing Candle @ supportTrent Ltd Cmp 3823 dated 3-2-2026 Weekly chart (Positional) 1. Bullish Engulfing Candle @ support 2. RSI reversal Buy above 3900 Sl 3600 target 4000-4200-4400-4500 it is just a view, please trade at your own risk.Longby ABC_XYZ1234Updated 227
Resistance aheadPrice is near resistance zone. Volumes are not strong. RSI shows bearish divergence on weekly chart. Thus shorts can give good risk/reward at current priceShortby pareshnagore0
USA reduced TARIFF to 18%! Recovery for NIFTY!?Following the global cues, we can see SGX rose over 3 percent following the statement that USA has reduced tariff to 18 percent which will give temporary push to NIFTY but yet our supply zones will act as important zones hence we will trade based on rejection on your demand and supply zone so plan your trades accordingly and keep watching everyone.by Kaushalfin11
Positional or Longterm Opportunity in BEMLGo Long @ 1838.1 for Targets of 2008.7, 2179.3, 2349.9, and 2520.5 with SL 1667.5 Reasons to go Long : 1. On Weekly timeframe If we draw Fibonacci retracement from the recent swing low (A) to the swing high (B) then the stock took support from the 0.618 Fibonacci level. 2. In addition to this, the stock formed a Bullish Engulfing Pattern (marked with a orange color) around 0.618 Fibonacci level. 3. Also there is a strong demand zone (marked with a purple color) from which the stock is takingLongby Nimish_GhagareUpdated 1
Positional or Longterm Opportunity in HBL EngineeringGo Long @ 794.1 for Targets of 867.05, 940, 1012.95, and 1085.9 with SL 721.15 Reasons to go Long : 1. On Weekly timeframe If we draw Fibonacci retracement from the recent swing low (A) to the swing high (B) then the stock took support from the 0.382 Fibonacci level. 2. In addition to this, the stock formed a Bullish Engulfing Pattern (marked with a orange color) around 0.382 Fibonacci level. 3. Also there is a strong demand zone (marked with a purple color) from which the stock is taking suLongby Nimish_GhagareUpdated 3
 LongLong
 Long
 Long
 Long
 Long
 Long

 Long
 Short
 Long
 Long
 Long
 Long
 Long
 Long
 Long
 Long
 Short
 Long
 Long