 Long
Long
 Long
Long
 Long
Long
Nifty FMCG: A Crucial Technical SetupNifty FMCG has formed a large Head & Shoulders pattern on the daily chart, developing over the 2022–2026 period.
The pattern consists of:
Left Shoulder: Formed around 2023–24
Head: A higher peak formed during 2024
Right Shoulder: Developed during 2025
Neckline: Around the 52,000–53,000 zone
After failing to sustain above the right-shoulder region, the index entered a prolonged decline and has now moved toward a major long-term rising support trendline.
Why the current level is important
The blue trendline on the chart has been developing for several years and currently comes close to the 45,000–46,000 zone. The index is now testing this support area.
This creates an important technical situation:
If support holds → FMCG stocks could see a relief bounce, with the index potentially attempting to reclaim nearby resistance levels.
If support breaks decisively → the long-term structure could weaken further, and the completed Head & Shoulders pattern may become more relevant from a bearish technical perspective.
The key point
The index is currently sitting at a make-or-break technical zone. Rather than assuming that the support will hold, traders can watch for price confirmation—such as a strong reversal candle, higher low, or sustained move back above nearby resistance.
In simple words:
“Nifty FMCG has completed a multi-year Head & Shoulders formation and is now testing a crucial 4-year support trendline. The next few sessions could determine whether this support triggers a bounce or breaks, potentially confirming further weakness.”
Important: A chart pattern is a technical framework, not a guarantee of future price movement.  Long
Long
 Long
Long
 Long
Long
Gold Under Pressure — Sellers Remain in ControlXAUUSD remains under short-term bearish pressure, with the post-Fed environment and H1 structure still favoring sellers.
Gold continues to face headwinds after the Fed raised rates by 25 basis points, while elevated Treasury yields and a firm dollar keep the broader environment challenging for the metal.
On H1, price remains below the descending trendline, and the latest recovery was rejected before buyers could change the bearish structure. The 4,335–4,345 area remains the key resistance.
As long as this zone holds, I favor SELL setups on rebounds, with 4,235–4,250 as the main downside area to watch.  Short
Short
 Long
Long
 Long
Long
 Long
Long
 Long
Long
 Long
Long
XAUUSD: Liquidity Sweep into Supply Zone –Bearish Continuation ?Market Overview
Gold (XAUUSD) on the 1-hour timeframe has completed a corrective pull-back into a strong higher-timeframe bearish structure. Price broke down sharply from an earlier consolidation range, establishing a clear Break of Structure (BOS) to the downside.
Technical Breakdown
Break of Structure (BOS): Price aggressively impulsed downward from the prior consolidation block, shifting medium-term momentum bearish.
Liquidity Sweep & Trendline Resistance: The recent upward retracement swept liquidity above recent short-term highs and tested a descending trendline originating from the previous consolidation high.
Supply Zone Tap: Price expanded directly into the marked Supply Zone (4,330 - 4,360), reacting sharply with selling pressure.
CHoCH (Change of Character): Prior minor higher highs shifted momentum back down, signaling lower-timeframe distribution within the supply block.
Trade Plan
Bias: Bearish / Short
Entry Zone: 4,330 – 4,345 (Supply Zone Re-test)
Stop Loss (SL): 4,365 (Above Supply Zone & Liquidity Highs)
Take Profit (TP): 4,280 (Target Level / Support Low). Short 
VA Tech Wabag Ltd. — Bullish Breakout Setup - Timeframe: 1DayVA Tech Wabag is showing a potential bullish breakout from a descending trendline resistance. The stock is trading near ₹2,278, with strong bullish momentum and increasing volume.
The RSI is around 69, indicating strong momentum but also caution near overbought territory.
🔹 Entry: ₹2,320–₹2,350, preferably after a daily candle closes above resistance.
🔹 Stop Loss: ₹2,160 (daily closing basis)
🎯 Target 1: ₹2,450
🎯 Target 2: ₹2,550
🎯 Target 3: ₹2,650
Trade Logic:
Breakout above the descending trendline may signal trend continuation.
Strong volume supports the bullish setup.
RSI near 70 suggests momentum is strong, but a pullback is possible.
A sustained move above ₹2,320 could open the way toward higher targets.
⚠️ Invalidation: A sustained move below ₹2,160 would weaken the bullish setup.
Disclaimer: This is a technical analysis idea, not a guaranteed trade recommendation.
Its only for Educational Purpose No Buy or Sell recommendation.
#VAWABAG #VAtechWabag #NSE #SwingTrading #Breakout #TechnicalAnalysis #StockMarketIndia #TradingView  Long
Long
 Long
Long
Dixon Technologies Elliott Wave Analysis: Will It Collapse?Dixon Analysis: Will It Collapse?
Welcome back to WaveTalks... Stories of what the Market Whispers, straight from the mouth of an Elliottician, your old friend.
If you haven't watched Comex Gold collapse from the $4,400 mark straight down to $4,275 the exact moment the Federal Reserve rate decision unfolded, you are missing the real action. The market always leaves clues.
Speaking of clues, as a trader, Aug 24, 2026, was unforgettable. The stock plummeted 500 points in a single session. A big shoutout to follower Akshay, who was keenly watching what would unfold next.
My warnings started on Aug 16, 2026 when stock was hovering close under 14000 mark...
This was the precise warning shared on X: Check the Snapshot of the tweet
Be extremely careful once price reaches 14,850 - 15,000; review the scenario there. A failure at that top end can pull price back to the 13,650s. Falling below 13,500–13,645 opens the possibility of the fall getting extended to the downside.
Now, the data proves it: Elliott Wave works.
Let’s break down the structure from the 9,600 bottom.
The Elliott Wave Breakdown
Wave A (Impulsive):
Unfolded from the 9,600 bottom to the highs of 11,440.
Wave B (Corrective):
Formed a complex running double-three correction, terminating at 11,285.
Wave C (Explosive):
A 5-wave impulsive sequence that topped out exactly at 14,983.
Remember that double top near 14,970 - 14,980 when I asked: *Will Dixon Collapse?* Here is your answer.
The Current Downside Structure:
From the 14,983 peak, Dixon began a new impulse downside (Possible Scenario )
Waves 1 to 4: Completed.
Wave 4 High: Struck today, Sep 17, 2026, at 13,495.
Alternate Wave 4 can unfold as a Triangle if Stock consolidates for next few days but strictly holding below 13500
What's Next:
One final leg down - Wave 5 to conclude the bearish sequence from the 14,983 top.
Trading Strategy & Key Levels:
Line in the Sand (Invalidation Level): 13500
Aggressive Traders:
Look for short opportunities as long as the price holds below 13,500.
Conservative Traders:
Plan bearish setups only on a clean break below the 13,000 - 13,050 zone.
Wave 5 Targets Downside
Primary Target:
12250’s (62% Fibonacci projection of Wave 1-3 distance in the current Impulsive sequence downside from the highs of 14983).
Extended Targets:
If 12,250 fails to hold, the next logical support clusters sit at 11,700 and 11,300.
#WaveTalks
Market Whispers! Can You Hear Them?
Regards,
Abhishek H. Singh
SEBI Registered Research Analyst (INH000030092)  Short
Short
 Short
Short
Long 
INDIGO Filled GapChart Breakdown & Technical Context:
Recent Correction: INDIGO has experienced a sharp decline from its recent highs above the 5,400 level. During this fall, it sliced right through its immediate strong support (the upper shaded zone). According to the principle of polarity, this broken support is now expected to act as overhead resistance.
Current Positioning: The price is currently resting inside a crucial historical demand/support zone (the lower shaded box), trading near the 4,795 mark.
The "Gap Fill" Logic: The lowest horizontal dashed line marked on the chart (around the 4,377 level) represents a major pending gap/liquidity void. In technical analysis, unfilled gaps often act as a magnet for price. If the current support zone fails to hold, the market could drop swiftly to fill this gap.
Trading Scenarios & Action Plan:
🔴 Bearish Breakdown (Gap Fill Target):
If we see a decisive daily candle close below this lower demand box, it will signal strong bearish continuation. The immediate downside target would be the horizontal line at 4,377 to complete the gap fill.
🟢 Bullish Rejection (Relief Bounce):
Since the price is currently sitting inside a strong historical support area, we cannot rule out a bounce. If a clear bullish reversal candlestick pattern (such as a Hammer or Bullish Engulfing) forms within this zone, it could trigger a relief rally. The primary upside target would be a retest of the upper shaded box (previous support turned resistance).
Conclusion:
This is a strict "Wait and Watch" area. It is highly recommended to wait for price action confirmation—either a confirmed breakdown to play the gap fill, or a clear reversal signal to trade the bounce.
Disclaimer: This analysis is for educational purposes only and does not constitute financial advice. Always use proper risk management.  Long
Long
AYE FINANCE — A CONTRACTION, WORTH WATCHING.Daily chart | Educational study only
AYE Finance has spent the last several weeks consolidating after a strong advance from the April lows.
At first glance, it looks like a simple sideways range. But the more interesting part is what is happening inside that range.
The structure
The upper end of the base has repeatedly attracted supply, while the lows inside the range have gradually moved higher.
That gives the structure ascending-triangle characteristics: resistance remains broadly in the same area, while buyers appear willing to step in progressively higher on each pullback.
The stock is still inside the base, so there is no confirmed breakout yet. What is interesting is that the structure appears to be getting tighter.
The contraction is the interesting part
The swings inside the base appear to be progressively shrinking.
The first pullback was relatively deep.
The next was shallower.
The latest contraction is tighter again.
That gives the chart VCP-like characteristics.
The basic idea behind volatility contraction is straightforward: as a base matures, aggressive supply can gradually reduce. If fewer holders are willing to sell at progressively lower prices, the swings often become quieter and tighter.
That is what makes this chart worth monitoring.
The rounded contractions
Another interesting feature is the character of the lows.
Instead of repeated sharp V-shaped reversals, several of the pullbacks have developed more gradually and formed rounded contractions.
That suggests orderly consolidation rather than panic liquidation.
It doesn't guarantee a positive resolution, but the character of the pullbacks can be just as important as their direction.
Volume
Volume has generally moderated through much of the consolidation, apart from a few obvious expansion days, including earnings-related activity.
That is broadly constructive for a developing base.
What matters more from here is whether participation expands meaningfully when the range eventually resolves.
Recent average trading activity also does not suggest an extremely illiquid counter, so the tightening cannot simply be dismissed as price becoming quiet because nobody is participating.
Market context matters
The broader market backdrop deserves serious attention here.
The candle from two sessions ago was particularly ugly across multiple indices and sectors. Several sectors slipped below their 50-DMA, breadth deteriorated sharply, and the technical structure of many individual stocks was damaged.
So far, we have not seen meaningful follow-through to that weakness.
But no immediate follow-through does not mean the risk has disappeared. Further selling can still emerge, and damaged breadth often takes time to repair.
That makes this an environment where analysing an individual chart in isolation can be misleading.
Even when a stock-specific setup looks constructive, absolute caution and disciplined risk management are imperative. Position sizing, stop discipline and respect for overall market breadth matter as much as the individual setup.
What I would watch
Not a target.
Not an entry.
Just behaviour.
Does price eventually leave the base with strong participation and hold the move?
Or does it lose the sequence of higher lows and fall back deeper into the range?
Either outcome provides information.
Until then, this remains a developing consolidation with tightening price action near the upper part of the base.
The structure is interesting, but given the current broader-market backdrop, confirmation matters more than anticipation.
Takeaway
The most interesting bases are often the boring ones.
After a strong move, a stock that stops advancing, absorbs supply, forms progressively smaller contractions and continues to hold higher lows deserves attention.
But no stock operates in a vacuum.
The important part is not predicting the breakout. It is watching whether price, volume and the broader market eventually confirm that demand has taken control.
Disclaimer: This post is for educational and chart-study purposes only. It is not investment advice or a recommendation to buy or sell any security. I am not a SEBI-registered Research Analyst or Investment Adviser. Please conduct your own research, manage risk appropriately and consult a SEBI-registered professional before making any investment or trading decision.  Long
Long
RELIANCE: Falling Wedge Bullish Reversal at Strong Support ₹1469Technical Analysis
Pattern Formation : The 1-Day chart of Reliance Industries Limited (RELIANCE) displays a multi-month Falling Wedge pattern. Lower highs and lower lows are gradually narrowing toward a technical apex, indicating seller exhaustion.
Support Zone: Price action is testing a major Strong Support Area around ₹1,200 – ₹1,210. This zone aligns with past macro swing lows and includes a recorded False Breakout / Liquidity Sweep (under ₹1,200), signaling strong institutional buying defense.
Accumulation / Spring: The chart highlights a rounded accumulation curve (green shade) emerging from the lower trendline of the wedge, forming a potential "spring" structure near the ₹1,200 zone.
Resistance & Targets:
Immediate Resistance: ₹1,372 (Intermediate Horizontal Resistance Band).
Primary Target: ₹1,469 (Upper Resistance Zone / Measured Move Target).
Fundamental Drivers
Energy & Petrochemicals: Stable refining margins and expansion into green energy initiatives (solar, hydrogen, and gigafactories) provide long-term balance sheet stability.
Consumer Businesses (Retail & Telecom): Steady ARPU growth in Jio Platforms alongside consistent revenue expansion in Reliance Retail continue to drive core earnings growth.
Balance Sheet Flexibility: Strong institutional capital access and investment grade ratings maintain defensive strength despite broader market volatility.
Trading Idea Summary
Current Price: ₹1,244.00
Accumulation Zone: ₹1,210 – ₹1,240
Stop Loss: Below ₹1,195 (daily candle close)
Target 1: ₹1,372.40
Target 2: ₹1,469.50
Risk-to-Reward: 1:3.5+
Disclaimer
This post is for educational and informational purposes only and does not constitute financial or investment advice. Technical chart patterns and fundamental data are subject to market risks. Please perform your own research or consult a certified financial advisor before making any trading decisions.
 Long
Long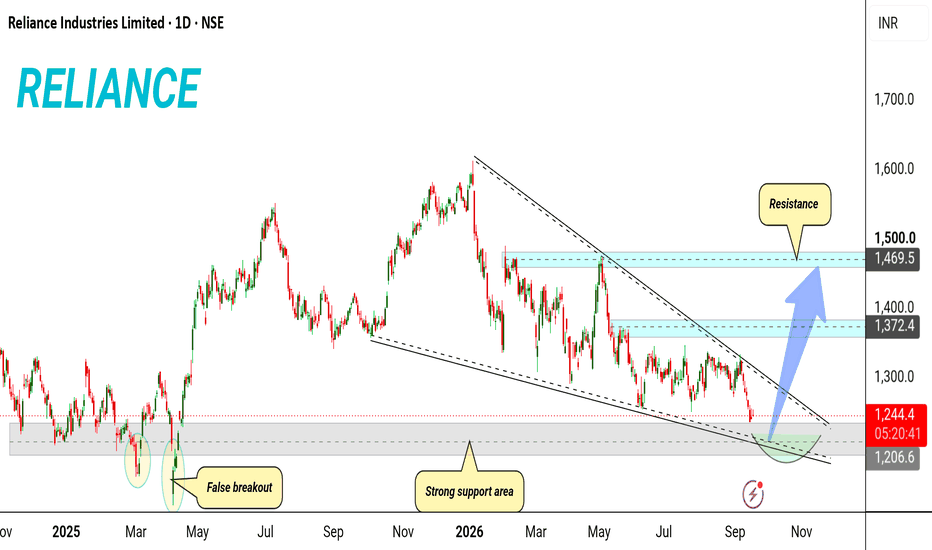
XAUUSD — Internal Supply Sell Before FOMC
Gold is trading around $4,326 after a corrective recovery from the recent sell-side liquidity sweep. Despite the bounce, H1 price remains beneath the descending HTF trendline, and the broader sequence of lower highs continues to favor bearish delivery.
Macro risk is concentrated around today’s FOMC decision. Markets are pricing roughly a 92% probability of at least a 25 bp Fed hike, while the U.S. dollar remains near multi-week highs. Gold has recovered modestly ahead of the announcement, but a hawkish Fed message could reinforce yield pressure on the metal.
Oil has eased after an unexpected rise in U.S. inventories, although Brent remains above $100 and Middle East supply disruptions continue to keep inflation risk elevated.
SMC View
The H1 structure remains bearish below dynamic supply. The recent bullish MSS explains the current corrective repricing, but it has not yet broken the broader bearish structure.
Price is now moving back toward the $4,395-$4,405 Internal Supply area. This is the nearest mitigation zone and the main location where sellers may attempt to regain control.
The $4,385–$4,405 Premium Bearish OB remains the higher resistance zone if FOMC volatility drives a deeper liquidity sweep.
Main Trading Scenario
Sell Priority: $4,395-4,405
Condition: Wait for price to retrace into Internal Supply and show bearish rejection, failed acceptance above the zone, or a lower-timeframe bearish MSS/CHOCH.
Entry: $4,395-4,405 after confirmation
SL: Above $4,355 and the rejection structure
TP1: $4,280–$4,295
TP2: $4,252–$4,268
Key Zones to Watch
$4,395-$4,405 — Premium Bearish OB
$4,330–$4,345 — Main Internal Supply
$4,283–$4,318 — FVG / mitigation area
$4,252–$4,268 — Internal SSL
HTF descending trendline — Dynamic resistance
Above $4,355 — Immediate sell setup weakens
Prime Gold View
The sell bias remains favored while Gold stays beneath Internal Supply and the HTF bearish trendline.
A confirmed rejection from $4,395-$4,405 could reopen delivery toward the exposed sell-side liquidity below. With the FOMC decision approaching, sharp two-sided liquidity sweeps are possible, so the reaction after mitigation matters more than anticipating the first move.
No confirmation, no trade. Long 


