 Short
Short
 Long
Long
XAUUSD — 4,371 Opens the Recovery XAUUSD — 4,371 Opens the Recovery
Gold is sitting in a very important decision area right now. Price is trading around 4,346, just below the short-term resistance zone, while the market waits for the Fed rate decision. This is not a clean bullish reversal yet, but the chart is starting to show that buyers are trying to build a recovery from the lower side of the structure.
From the SMC view, the larger trend is still damaged. Gold dropped strongly from the late-August high, then moved inside a bearish correction channel. That tells me sellers still have control in the bigger picture. But price is now trying to push out from the lower part of that channel, and that is why this area deserves attention.
The key short-term level is 4,361 - 4,371. If gold can break and hold above this zone, it would show that the current bounce is not just a weak reaction from the lows. It would open the path back toward the bearish FVG around 4,430 - 4,455. This is the first real test for buyers.
For newer traders, the idea is simple: gold may recover in the short term, but that does not mean the full trend has turned bullish. When price is still below major supply, every rally must be tested carefully. A move into FVG or OB can become a rejection zone if sellers step back in.
My main view is bullish for a corrective recovery while gold stays above the 4,326 - 4,330 support area. This level matters because price is holding near the 100-day SMA, and buyers are trying to defend that base. If the market respects this support and breaks above 4,371, the next target becomes 4,430 - 4,455.
Above that, the bigger resistance is 4,480 - 4,515. This is marked as a Bearish OB / BSL Raid zone on the chart. If gold reaches that area, I would be very careful with late buying because sellers may use that liquidity to push price lower again.
The wider bullish recovery only becomes stronger if gold reclaims 4,505 and holds above it. Until then, I still treat this as a recovery move inside a larger bearish structure. The 200-day SMA around 4,540 also remains a major ceiling for the broader trend.
If gold fails to break 4,361 - 4,371 and loses 4,326, then the recovery idea becomes weak. In that case, price may return toward the lower part of the channel around 4,280 - 4,300, where buyers may try to react again.
Key Price Zones to Watch
Current reaction area: 4,340 - 4,350
First breakout resistance: 4,361 - 4,371
Main support / 100-day SMA area: 4,326 - 4,330
Bearish FVG / mitigation zone: 4,430 - 4,455
Bearish OB / BSL raid zone: 4,480 - 4,515
Major upper resistance / 200-day SMA area: 4,540 - 4,560
HTF Premium PD Array: 4,600 - 4,635
Lower demand if support fails: 4,280 - 4,300
Bullish confirmation: clean reclaim above 4,371
Stronger recovery confirmation: hold above 4,505
Invalidation: clean break and hold below 4,326
Do you think gold can reclaim 4,371 before the Fed decision, or does the market still need one more sweep lower before buyers step in?
Long 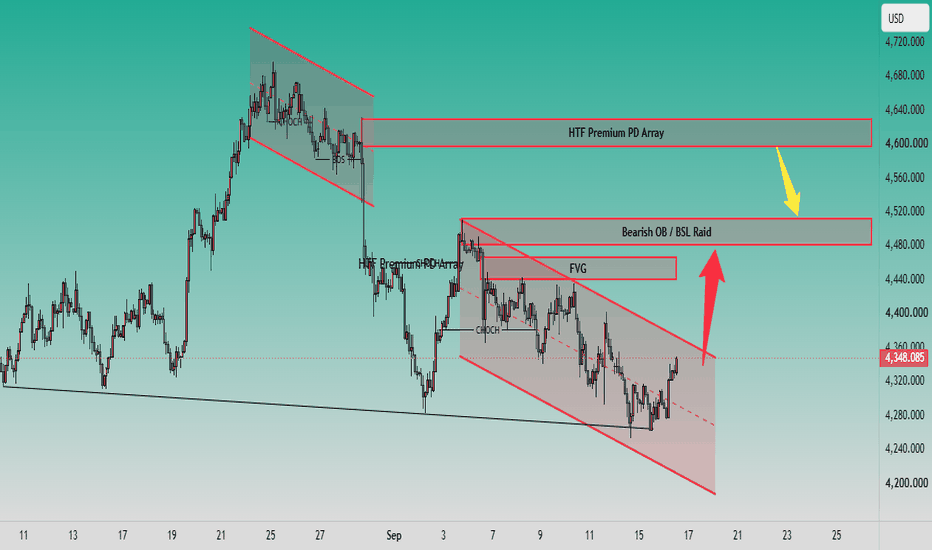
XAUUSD — Sell the H1 Fibonacci RetestFundamental Analysis
Gold remains under pressure ahead of the September 15–16 Fed meeting. Markets are pricing roughly a 92% probability of a 25 bp rate hike, while a firmer U.S. dollar and rising Treasury yields continue to raise the opportunity cost of holding gold.
The macro backdrop is also being complicated by oil prices above $100 and renewed Middle East supply concerns. U.S. Treasury yields have pushed to fresh multi-year highs, with the 10-year recently moving above 5%, reinforcing the higher-for-longer pressure on precious metals.
Technical Analysis
On the H1 chart, XAUUSD is trading near 4,277 after rebounding from the 4,253.64 low but failing to establish a sustained bullish structure.
Price remains below the broader bearish structure, while the latest Fibonacci retracement identifies 4,293–4,305 as the most attractive short-term sell area. This zone combines the 0.618–0.786 retracement, previous structure, and nearby H1 imbalance.
A deeper recovery could test 4,318, but acceptance above that level would weaken the immediate bearish setup.
If sellers defend the Fibonacci zone, price may rotate back toward 4,278, followed by 4,268–4,270 and eventually the 4,253–4,255 liquidity low.
Important Key Levels
4,378–4,390 — Major H1 FVG
4,305–4,318 — Upper resistance
4,293–4,305 — Main sell zone
4,278 — First downside pivot
4,268–4,270 — Lower demand
4,253–4,255 — Main liquidity target
Trading Scenario
Main Sell Setup
Entry: 4,293–4,305
Stop Loss: 4,322
Take Profit 1: 4,278
Take Profit 2: 4,268–4,270
Take Profit 3: 4,253–4,255
Sell Condition
Wait for price to retrace into 4,293–4,305 and show bearish confirmation. A rejection wick, bearish engulfing candle, failed reclaim above 4,305, or H1 close back below 4,293 may confirm renewed seller pressure.
A sustained break above 4,318–4,322 would invalidate the immediate sell idea.
Overall View
The H1 bias remains bearish while XAUUSD trades below 4,318. With price already near lower support, chasing shorts around 4,277 offers poor positioning. The preferred plan is to wait for a corrective rebound into 4,293–4,305, then look for confirmation toward 4,278, 4,268, and potentially a retest of the 4,253 liquidity low.
The Fed decision is now the main volatility risk, and the tone of the policy statement may be as important as the expected rate hike itself.
Do you expect gold to retest 4,293–4,305 before sellers attack 4,253 again? Short 
 Education

 Education

 Education

Education

Global Financial MarketsGlobal financial markets are systems where people, companies, and governments buy and sell financial assets across the world. They help move money from those who have extra funds to those who need funds.
Main Types of Global Financial Markets:
Stock Markets – Buying and selling shares of companies (e.g., NYSE, NSE).
Bond Markets – Governments and companies borrow money by issuing bonds.
Foreign Exchange (Forex) Markets – Trading currencies like USD, EUR, INR.
Commodity Markets – Trading gold, oil, wheat, etc.
Money Markets – Short-term borrowing and lending.
Derivatives Markets – Contracts based on assets like stocks or currencies.
Importance:
Provide funds for business growth
Support international trade
Create investment opportunities
Help manage financial risks
Affect global economies
Example:
If the US stock market falls sharply, markets in Asia and Europe may also be affected because markets are connected globally.
 Education

 Education

GOLD US SESSION — 4300 HOLDS, BULLISH REBOUNDGold has shown a strong recovery from the 4,285 support zone, reclaiming the 4,300 area with strong bullish momentum. However, price is now approaching the first resistance around 4,340, so the US session should focus on how price reacts at key zones rather than chasing the move.
📌 MAIN SCENARIO
The immediate key area is 4,317–4,340. If Gold holds above 4,317 after a pullback and buyers continue to defend this zone, the recovery can extend toward 4,399.
If price reaches 4,340 and shows a clear rejection, a short-term scalp back toward 4,317 → 4,285 can develop. Therefore, the preferred approach is to buy confirmed pullbacks while 4,285 remains protected, while remaining flexible around 4,340 resistance.
🔑 KEY LEVELS
🔴 4,443 — Major resistance / upper target
🔴 4,399 — Key resistance
🔴 4,340 — Immediate resistance / reaction zone
🟢 4,317 — Short-term support / pullback area
🟢 4,285 — Major support / bullish invalidation area
🟢 4,224 — Deeper support if 4,285 fails
🎯 PREFERRED SCENARIO
Gold has recovered strongly above 4,300.
Watch 4,317–4,340 for the first US-session setup.
If 4,317 holds after a pullback → look for Buy confirmation.
A successful break and hold above 4,340 opens the way toward 4,399.
If 4,340 rejects strongly → consider a short scalp toward 4,317 / 4,285.
A break below 4,285 would invalidate the immediate bullish recovery setup.
🟢 BIAS
BULLISH — BUY THE CONFIRMED PULLBACK.
The key shift is the strong recovery from 4,285 and reclaim of 4,300. For the US session, Emma's approach is simple: don't chase the impulse — wait for the pullback, confirmation, and reaction at the key zone. Long 
Long 
 Long
Long
 Long
Long
Short 
Coforge Consolidates After Sharp CorrectionHighlights
* Coforge is currently trading around the ₹1,545–₹1,560 zone after a significant correction from its recent highs. The stock remains under short-term pressure, but price action is beginning to stabilize near an important support region.
* The ₹1,520–₹1,540 zone is the immediate support area. If this region holds, Coforge could attempt a technical recovery. Below this, ₹1,470–₹1,500 becomes the stronger medium-term demand zone. A decisive breakdown below ₹1,470 would materially weaken the structure.
* On the upside, ₹1,590–₹1,610 is the first important resistance zone. A sustained move above ₹1,610 could trigger a recovery towards ₹1,650–₹1,680. The more important resistance remains around ₹1,700–₹1,730, and reclaiming this area would significantly improve the medium-term technical outlook.
* Momentum indicators remain weak following the recent decline. RSI has moved towards the lower end of its neutral range, while MACD continues to reflect negative momentum. The stock is also struggling around its shorter-term moving averages, suggesting that confirmation is required before calling a meaningful reversal.
* The daily chart continues to show a corrective lower-high structure, but the ₹1,500–₹1,540 region has the potential to develop into a base. Formation of a higher low in this area followed by a breakout above ₹1,610 would be the first meaningful indication that buyers are regaining control.
* Fundamentally, Coforge continues to demonstrate strong underlying business momentum. Q1 FY27 revenue increased approximately 35% YoY to around ₹4,106 crore, while the company's executable order book expanded substantially. Large deal wins continue to provide strong revenue visibility despite uncertainty surrounding discretionary technology spending.
* The major near-term development is the leadership transition following chairman O.P. Bhatt's resignation after Advent International became the controlling shareholder. The change introduces some governance and ownership-transition uncertainty, but Advent's backing could also support Coforge's longer-term acquisition-led expansion and global growth strategy.
Takeaway
Coforge is currently in a corrective phase, but the ₹1,500–₹1,540 region is emerging as an important technical support area. Holding this zone and subsequently crossing ₹1,610 could trigger a recovery towards ₹1,650–₹1,680, followed by ₹1,700–₹1,730 if momentum strengthens.
A sustained move above ₹1,730 would provide much stronger confirmation that the correction has ended and the broader uptrend is resuming. Conversely, a decisive breakdown below ₹1,500, particularly ₹1,470, would weaken the setup and could result in another leg lower.
For now, Coforge looks more like a fundamentally strong stock undergoing a technical correction than a structurally broken stock, but price confirmation above ₹1,610 is required before the setup becomes convincingly bullish again.
Long 
TORNTPHARM: Classic Cup and Handle Breakout1. The Macro Perspective: The Cup and Handle Formation
I am taking a LONG bias on Torrent Pharmaceuticals Ltd. (TORNTPHARM) on the daily (1D) timeframe. This is a quintessential "Cup and Handle" continuation pattern, which is one of the most reliable structures for identifying a continuation of a primary uptrend. The "Cup" represents a prolonged period of consolidation where supply was systematically absorbed, and the "Handle" acts as the final low-volatility shakeout before the explosive move higher.
2. The Educational Setup: Defining the Structure
To understand the technical validity behind this launch, look at the two distinct phases:
The Cup (Rounding Bottom): This formation indicates that the stock has finished its corrective phase and buyers have regained control. The rounded bottom shows a gradual return of demand.
The Handle: Following the cup, the stock consolidated in a tight range (the handle). This is crucial, as it allows the stock to digest the previous gains and reset the momentum indicators for the next leg up.
The Breakout Line: The black horizontal resistance line drawn at approximately 4,500 served as the "neckline" of the pattern. A decisive close above this level effectively confirms the completion of the pattern.
3. Current Price Action: Breakout Confirmation
The price has officially cleared the handle and is currently trading at 4,655.90. This breakout indicates that the structural pressure has been released. The market is now shifting from accumulation to active markup. The breakout is visually confirmed by the recent price action pushing above the previous resistance, signaling that the momentum is now firmly in the hands of the bulls.
Note: Always verify your EOD data to ensure the breakout holds through the final market close.
4. The Trade Plan: Entries, Targets, and Risk Management
Entry Strategy: Momentum is currently strong. For those who missed the initial breakout, a high-probability strategy is to look for a "retest" entry. If the price pulls back slightly to retest the 4,500 – 4,550 zone, it provides an excellent risk-to-reward opportunity as old resistance becomes new support.
Take Profit (Targets): In a Cup and Handle pattern, we use a measured move strategy based on the depth of the cup. Projecting the height of the cup upward from the breakout point, our primary target sits in the 5,000 to 5,200 zone over the medium term.
Invalidation (Stop Loss): This bullish thesis is invalidated if the stock fails to sustain its breakout and drops back into the handle or cup. A hard stop loss should be placed below the handle, specifically around the 4,200 to 4,250 level. A close back inside the handle would signal a failure of the pattern.
5. Time Horizon:
Because this technical setup captures a clean structural continuation pattern on the 1-Day chart, this is a high-alpha swing trade designed to capture the next phase of the trend. Let the trend run!  Long
Long
MANCREDIT: Weekly Macro Resistance Breakout1. The Macro Perspective: The Structural Breakout
I am taking a LONG bias on Mangal Credit & Fincorp Ltd. (MANCREDIT) on the macro weekly (1W) timeframe. When analyzing market structure on a finance sector stock, horizontal resistance breakouts are critical for initiating the next leg of a secular markup. Following a corrective phase, the stock consolidated, effectively absorbing overhead supply.
2. The Educational Setup: Horizontal Resistance
To understand the technical validity behind this move, look closely at how the price structure interacted with the core boundary:
The 203.84 Resistance Ceiling: The definitive line in the sand for a bullish structural shift was the horizontal resistance line drawn at 203.84. This level established a significant supply zone that capped upward momentum for months.
3. Current Price Action: Breakout and Volatility Expansion
The structural pressure cooker has officially exploded. Institutional buyers have stepped in with clear conviction. The stock printed a powerful weekly expansion candle that has decisively obliterated the 203.84 resistance, currently trading strong at 214.85. The stock has officially transitioned into a breakout phase, signaling potential for further upward momentum.
Note: Always wait for the final weekly close to confirm the strength of the breakout.
4. The Trade Plan: Entries, Targets, and Risk Management
Entry Strategy: Momentum is strong. Chasing an extended breakout candle carries a minor risk of a mean-reversion pullback. Look to scale into long positions on a structural pullback to retest the broken 200.00 to 204.00 prior resistance zone. Letting old historical resistance prove itself as a concrete new support floor provides an unmatched risk-to-reward ratio.
Targets: By utilizing a classical measured move strategy based on the structural consolidation, we can project upside targets. Our primary structural macro target sits comfortably in the 240.00 to 250.00 zone over the coming quarters.
Risk Management: A breakout thesis is invalidated if the price fails to hold its newly claimed structural floor and collapses back inside the breakout zone. A hard stop loss should be placed safely below the recent breakout, specifically around the 190.00 to 195.00 level.
5. Time Horizon:
Because this technical setup captures a clear structural phase transition and a major horizontal breakout on the 1-Week chart, this is a position trade designed to capture a sustained markup phase. Let the trend run!  Long
Long
GVPIL: Massive Macro Cup & Handle Breakout and Textbook Retest1. The Macro Perspective: The Deep Washout and the Cup
I am taking a LONG bias on GE Power India Ltd. (GVPIL) on the weekly (1W) timeframe.
When analyzing pure market structure, the most lucrative macro trends are born from deep, exhausting accumulation phases. Look at the massive structural development spanning this entire chart. After a massive initial run-up established a historical ceiling at the solid black 578.30 line, the stock was technically exhausted. It suffered a brutal, agonizing markdown phase, crashing all the way down into the 200s. This deep correction successfully washed out weak hands and forced mass retail capitulation. However, heavy institutional capital stepped in to establish a concrete floor. Over the last year, the stock quietly carved out an enormous "Cup" (Rounding Bottom) accumulation phase, systematically marching right back up to challenge the scene of the crime.
2. The Educational Setup: The Structural Handle
To understand the sheer strength of this current setup, look at how the price transitioned from accumulation back into a markup phase right at the historical ceiling:
The Springboard: When the price finally reached the ultimate 578.30 macro neckline, it didn't suffer a massive double-top rejection. Instead, institutional buyers aggressively defended the structure. I have drawn the exact geometry of this "Handle" formation. The stock pulled back and found perfect dynamic support right on the rising 20 SMA (the middle blue line of the Bollinger Bands), trapping short sellers and storing immense kinetic energy for the launch.
The Breakout: That springboard exploded, shattering the 578.30 ceiling with massive, full-bodied green momentum expansion candles and violently piercing the upper Bollinger Band to initiate a new macro trend.
3. Current Price Action: The Ultimate Confirmation
In technical analysis, breaking a major resistance line is only half the battle. The most lucrative entries occur when a stock proves it can defend its newly claimed territory. Look at the current red weekly candle on the far right. After an explosive vertical run into the 700s, the stock is taking a healthy, necessary breather. To amateur traders, massive red candles look like a failed rally. To structural traders, this is a textbook "Break and Retest." The stock is pulling back to digest its gains. By holding its ground here, that old, heavy historical resistance is officially being flipped into a brand-new, indestructible structural launchpad.
4. The Trade Plan: Entries, Targets, and Risk Management
Entry Strategy: Chasing vertical green expansion candles is dangerous, which is exactly why we wait for moments like this. The highest-probability, lowest-risk entry involves stepping down to a daily timeframe to catch this structural pullback. Look for bullish reversal candles to form as the price works its way into the 580.00 to 620.00 breakout zone. Buying the retest of a multi-year macro ceiling offers a phenomenal risk-to-reward ratio.
Take Profit (Targets): We use measured structural targets based on the depth of the macro base. By taking the depth of the massive Cup (roughly 350+ points from the ~220 floor up to the 578.30 ceiling) and projecting it upward from the breakout line, our primary structural macro target sits comfortably in the 900.00 to 950.00 zone. The massive 1,000.00 psychological mark acts as the ultimate macro magnet.
Invalidation (Stop Loss): A break-and-retest thesis is only valid if the new floor holds. A hard stop loss should be placed safely below the recent handle consolidation and the 20 SMA, around the 450.00 to 480.00 level. A definitive weekly close completely back inside the old accumulation base and breaking below the moving average would act as a massive warning sign of a failed macro breakout and a severe bull trap.
5. Time Horizon:
Because this technical setup is built on a 1-Week chart capturing a massive structural phase transition and a textbook macro retest, this is a medium-to-longer-term position trade designed to capture a secular markup phase over the coming months. Let the macro trend run!  Long
Long
GLAND has explosively broken out of a multi-year macro base1. The Macro Perspective: The Deep Washout and Multi-Year Accumulation
I am taking a LONG bias on Gland Pharma Limited (GLAND) on the weekly (1W) timeframe.
When analyzing pure market structure, the most powerful and sustainable secular trends are born from grueling, exhaustive accumulation phases. Look at the massive structural development spanning this entire chart. After a massive historical markdown phase, the stock spent over two years locked in a brutal macro accumulation base. This prolonged sideways grinding acts as a massive washing machine—it completely exhausts and washes out weak, impatient retail traders, allowing strong-handed institutional buyers to quietly absorb all available liquidity at heavily discounted prices.
2. The Educational Setup: The Ultimate Structural Ceiling and Launchpad
To understand the sheer technical validity of this macro breakout, look at the precise mechanics aligning right before the launch:
The Absolute Concrete Ceiling: By adjusting our horizontal resistance line to the absolute peak of the structural highs at 2,094.65, we define the ultimate macro battlefield. Sellers repeatedly swatted the price down from this exact pivot point over the last two years, creating a heavy, undeniable historical supply zone.
The 20 SMA Defense: Notice how the price behaved beneath this ultimate ceiling over the last few months. Instead of suffering another deep collapse, institutional buyers aggressively stepped in, reclaiming the weekly 20 SMA (the middle blue line of your Bollinger Bands) and establishing a series of higher lows. By chopping sideways right below the massive resistance and letting the moving average catch up, the stock created a perfect, tightly coiled structural launchpad.
3. Current Price Action: Volatility Expansion and Pure Markup
Look at the most recent weekly candle on the far right. The high-level pressure cooker has absolutely exploded. Buyers have stepped in with massive conviction, printing a powerhouse of a green weekly expansion candle backed by a heavy institutional volume spike. This single vertical thrust has effortlessly obliterated the 2,094.65 multi-year ceiling, pushing the price well into the 2,300s. Furthermore, the price has violently pierced and is riding entirely outside the upper Bollinger Band, snapping the bands wide open. By decisively clearing this ultimate accumulation block, GLAND has officially initiated a highly aggressive new secular markup phase into pure price discovery.
4. The Trade Plan: Entries, Targets, and Risk Management
Entry Strategy: Macro momentum is exceptionally strong right now near 2,331.00. Chasing a massive vertical weekly candle closing entirely outside the upper Bollinger Band always carries a severe risk of an agonizing short-term mean-reversion pullback as the stock naturally breathes. The highest-probability, lowest-risk entry involves stepping down to a daily timeframe and waiting for the initial vertical excitement to cool off. Look to place limit orders to catch a potential structural pullback to perfectly retest the 2,050.00 to 2,120.00 broken resistance zone. Letting old historical resistance prove itself as a concrete new support floor offers a phenomenal risk-to-reward ratio.
Take Profit (Targets): Because the stock is breaking out of a massive multi-year structure, we use a measured move strategy based on the depth of the macro base. By taking the core depth of this consolidation (roughly 800 points from the ~1,300 structural floors up to the 2,094.65 absolute ceiling) and projecting it upward from the breakout point, our primary structural macro target sits comfortably in the 2,850.00 to 2,900.00 zone. The ultimate psychological round number of 2,500.00 will act as the immediate macro magnet.
Invalidation (Stop Loss): An explosive macro breakout thesis is completely invalidated if the stock crashes back deep inside the old consolidation boundaries. A hard stop loss should be placed safely below the breakout zone and the rising weekly 20 SMA, around the 1,750.00 to 1,850.00 level. A definitive weekly close completely back below the moving average would confirm a massive failed breakout and a severe macro bull trap.
5. Time Horizon:
Because this technical setup is built on a 1-Week chart capturing a massive structural phase transition and an ultimate macro base breakout, this is a medium-to-longer-term position trade designed to capture a secular markup phase over the coming months. Let the macro trend run!  Long
Long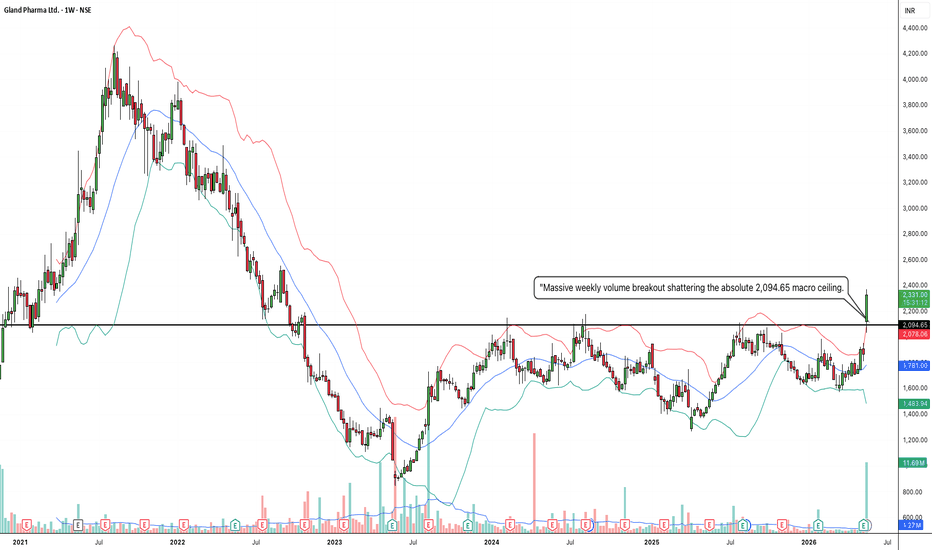
KPRMILL: Weekly Descending Channel Breakout & Earnings Catalyst1. The Macro Perspective: The Descending Channel Formation
I am taking a LONG bias on K.P.R. Mill Limited (KPRMILL) on the macro weekly (1W) timeframe.
When analyzing pure market structure on a textile sector leader, extended markdown phases often form classical corrective patterns before the primary trend resumes. Following a peak, the stock entered a prolonged structural correction, carving out a well-defined Descending Channel visible on the chart. This multi-month digestion phase allowed institutional capital to systematically accumulate shares at lower valuations. Fundamentally, this technical momentum is supported by their recent Q4 FY26 earnings report, where consolidated net profit jumped 11 percent year-on-year to ₹227.17 crore. Furthermore, their sugar business division demonstrated strong performance with a 10% YoY revenue growth. Documenting these classical accumulation bases makes the charting workflow highly repeatable and easy to understand for anyone analyzing momentum shifts.
2. The Educational Setup: The Channel Boundaries
To understand the technical validity behind this macro launch, look closely at how the price structure interacted with its core boundaries:
The Upper Resistance Trendline: The definitive line in the sand for a bullish structural shift was the solid black descending resistance line connecting the lower highs. This level established a dynamic supply zone that systematically capped upward momentum over the past year.
The Lower Support Trendline: During the consolidation, buyers consistently stepped in at the lower bounds, forming a parallel descending support line. The price action oscillated cleanly between these two boundaries, gradually flushing out weak hands and building immense kinetic energy.
3. Current Price Action: Breakout and Volatility Expansion
Look at the most recent weekly candle on the far right of the chart. The structural pressure cooker has officially exploded. Institutional buyers have stepped in with undeniable conviction. The stock printed a strong green expansion candle that has decisively obliterated the upper channel resistance, currently trading strong near 1,103.20. The stock has officially transitioned out of its macro corrective phase and into a highly explosive markup trend.
Note: Always ensure your exchange's End of Day (EOD) data files have fully synchronized before confirming the final weekly close shape, as evening data shifts can occasionally alter the visual confirmation of these critical breakouts.
4. The Trade Plan: Entries, Targets, and Risk Management
Entry Strategy: Macro momentum is exceptionally strong with the stock trading out in the open above the pivotal breakout line. Chasing an extended weekly breakout candle carries a minor risk of a lower-timeframe mean-reversion pullback. The highest-probability entry strategy involves waiting for the initial vertical excitement to cool off. Look to scale into long positions on a potential structural pullback to perfectly retest the broken descending trendline prior resistance zone. Letting old historical resistance prove itself as a concrete new support floor provides an unmatched risk-to-reward ratio.
Take Profit (Targets): By utilizing a classical measured move strategy based on the width of the descending channel, we can project upside targets. Taking the approximate width of the channel (roughly 200-250 points) and projecting it upward from the breakout point, our primary structural macro target sits comfortably in the 1,300.00 to 1,350.00 zone over the coming months.
Invalidation (Stop Loss): An explosive macro breakout thesis is completely invalidated if the price fails to hold its newly claimed structural support and collapses back inside the core of the channel boundaries. A hard stop loss should be placed safely below the recent lower-timeframe swing lows, specifically around the 940.00 to 960.00 level. A definitive weekly close completely back below 940.00 would act as a severe warning sign of a failed macro breakout and a major bull trap.
5. Time Horizon:
Because this technical setup captures a clear structural phase transition and a major diagonal breakout on the 1-Week chart, this is a longer-term position trade designed to capture a rapid momentum markup phase over the coming weeks and months. Let the macro trend run!  Long
Long


