KPRMILL: Weekly Descending Channel Breakout & Earnings Catalyst1. The Macro Perspective: The Descending Channel Formation
I am taking a LONG bias on K.P.R. Mill Limited (KPRMILL) on the macro weekly (1W) timeframe.
When analyzing pure market structure on a textile sector leader, extended markdown phases often form classical corrective patterns before the primary trend resumes. Following a peak, the stock entered a prolonged structural correction, carving out a well-defined Descending Channel visible on the chart. This multi-month digestion phase allowed institutional capital to systematically accumulate shares at lower valuations. Fundamentally, this technical momentum is supported by their recent Q4 FY26 earnings report, where consolidated net profit jumped 11 percent year-on-year to ₹227.17 crore. Furthermore, their sugar business division demonstrated strong performance with a 10% YoY revenue growth. Documenting these classical accumulation bases makes the charting workflow highly repeatable and easy to understand for anyone analyzing momentum shifts.
2. The Educational Setup: The Channel Boundaries
To understand the technical validity behind this macro launch, look closely at how the price structure interacted with its core boundaries:
The Upper Resistance Trendline: The definitive line in the sand for a bullish structural shift was the solid black descending resistance line connecting the lower highs. This level established a dynamic supply zone that systematically capped upward momentum over the past year.
The Lower Support Trendline: During the consolidation, buyers consistently stepped in at the lower bounds, forming a parallel descending support line. The price action oscillated cleanly between these two boundaries, gradually flushing out weak hands and building immense kinetic energy.
3. Current Price Action: Breakout and Volatility Expansion
Look at the most recent weekly candle on the far right of the chart. The structural pressure cooker has officially exploded. Institutional buyers have stepped in with undeniable conviction. The stock printed a strong green expansion candle that has decisively obliterated the upper channel resistance, currently trading strong near 1,103.20. The stock has officially transitioned out of its macro corrective phase and into a highly explosive markup trend.
Note: Always ensure your exchange's End of Day (EOD) data files have fully synchronized before confirming the final weekly close shape, as evening data shifts can occasionally alter the visual confirmation of these critical breakouts.
4. The Trade Plan: Entries, Targets, and Risk Management
Entry Strategy: Macro momentum is exceptionally strong with the stock trading out in the open above the pivotal breakout line. Chasing an extended weekly breakout candle carries a minor risk of a lower-timeframe mean-reversion pullback. The highest-probability entry strategy involves waiting for the initial vertical excitement to cool off. Look to scale into long positions on a potential structural pullback to perfectly retest the broken descending trendline prior resistance zone. Letting old historical resistance prove itself as a concrete new support floor provides an unmatched risk-to-reward ratio.
Take Profit (Targets): By utilizing a classical measured move strategy based on the width of the descending channel, we can project upside targets. Taking the approximate width of the channel (roughly 200-250 points) and projecting it upward from the breakout point, our primary structural macro target sits comfortably in the 1,300.00 to 1,350.00 zone over the coming months.
Invalidation (Stop Loss): An explosive macro breakout thesis is completely invalidated if the price fails to hold its newly claimed structural support and collapses back inside the core of the channel boundaries. A hard stop loss should be placed safely below the recent lower-timeframe swing lows, specifically around the 940.00 to 960.00 level. A definitive weekly close completely back below 940.00 would act as a severe warning sign of a failed macro breakout and a major bull trap.
5. Time Horizon:
Because this technical setup captures a clear structural phase transition and a major diagonal breakout on the 1-Week chart, this is a longer-term position trade designed to capture a rapid momentum markup phase over the coming weeks and months. Let the macro trend run!  Long
Long
NIFTY_MIDSML_HLTH: Explosive Dual-Breakout and Macro Continuatio1. The Macro Perspective: The Deep Washout and Accumulation
I am taking a LONG bias on the Nifty MidSmall Healthcare Index (NIFTY_MIDSML_HLTH) on the weekly (1W) timeframe.
When analyzing pure market structure, patience reveals the highest probability setups. Months ago, this index established a massive historical ceiling directly at the 45,257.90 level. What followed was a brutal, highly volatile markdown phase that successfully washed out all the weak hands, dragging the price all the way down to the 36,849.65 support floor. However, instead of entering a secular bear market, the index initiated a methodical, multi-month process of accumulation, carving out a massive base and systematically grinding its way back up toward historical supply.
2. The Educational Setup: The Power of the Tightening Handle
To understand the sheer strength of this current breakout, look at how the price systematically digested supply on the right side of the curve using a Volatility Contraction Pattern (VCP):
The Structural Floor: During the recovery, the index established a rock-solid mid-level support zone near 41,136.85. Buyers aggressively defended this line, refusing to let the structure break down.
The Descending Lid: As the price approached the ultimate 45,257.90 resistance, it formed a series of lower highs, marked perfectly by your descending trendline. This created a tight, compressing wedge or "Handle." Moving sideways and compressing under a descending lid stores immense kinetic energy because both buyers and sellers are squeezed into a corner, placing their stop losses just outside the contracting range.
3. Current Price Action: Blue Sky Territory
Look at the most recent weekly candle on the far right. The pressure cooker has exploded. Buyers have effortlessly shattered both the descending diagonal trendline and the ultimate 45,257.90 horizontal macro resistance, surging past 47,200. By clearing this final historical ceiling, the index has officially entered "Blue Sky Territory" (pure price discovery). There is absolutely zero historical overhead supply left.
4. The Trade Plan: Entries, Targets, and Risk Management
Entry Strategy: Momentum is exceptionally strong right now. Chasing a massive weekly expansion candle always carries a higher risk of immediate drawdown as early buyers take partial profits. The highest-probability, lowest-risk entry involves stepping down to a daily timeframe and placing limit orders to catch a potential structural pullback to retest the 45,000.00 to 45,300.00 breakout zone. Letting that old, heavy resistance prove itself as a new, indestructible support floor offers a phenomenal risk-to-reward ratio.
Take Profit (Targets): Because the asset is in pure price discovery, we use measured structural targets. By taking the depth of the massive macro base (roughly 8,400 points from the 36,849 floor to the 45,257 ceiling) and projecting it upward from the breakout line, our primary structural target sits near the 53,600.00 macro extension zone. Immediate psychological milestones are 50,000.00 and 52,000.00.
Invalidation (Stop Loss): A trade thesis is only valid if the new market structure holds. A hard stop loss should be placed safely below the recent weekly pivot inside the wedge, around the 43,500.00 to 44,000.00 level. A definitive weekly close completely back below the 45,257.90 line would act as an early warning sign of a failed macro breakout (a "bull trap").
5. Time Horizon:
Because this technical setup is built on a 1-Week chart capturing a massive structural completion into fresh price discovery, this is a medium-to-longer-term position outlook designed to play out over the coming weeks to months. Let the macro trend run! CNXCOMMODITIES: The Macro Staircase and Explosive Blue Sky Break1. The Macro Perspective: The Great Washout and Recovery
I am taking a LONG bias on the Nifty Commodities Index (CNXCOMMODITIES) on the weekly (1W) timeframe.
When analyzing pure market structure on a macro timeframe, patience reveals the absolute highest probability setups. Looking back at the left side of the chart, the index suffered a brutal, highly volatile markdown phase that successfully washed out all the weak hands, dragging the price all the way down to establish a concrete floor at 7,672.30. However, instead of bleeding into a secular bear market, the index initiated a methodical, multi-month process of accumulation. It carved out a massive rounding bottom, slowly absorbing overhead supply and grinding its way back up the chart.
2. The Educational Setup: Conquering the Stepping Stones
To understand the sheer strength of this current breakout, look at how the price systematically dismantled historical resistance on the right side of the curve by building a "Staircase" or "Step-Up Bases":
Base 1 (9,083.40): The index first had to conquer the mid-level pivot at 9,083.40. Notice how once it broke above this line, it chopped sideways, flipping it into a new support floor.
Base 2 (9,864.70): The index then rallied to the major historical resistance at 9,864.70. It pulled back to form a higher low, storing kinetic energy, before pushing through.
The Final Boss (10,078.00): As the index approached the ultimate macro ceiling at 10,078.00, it naturally faced selling pressure. But notice the weekly candlesticks—buyers refused to let the index collapse back to the lower bases. They formed a tight, high-level consolidation right under the resistance line, willingly absorbing shares at premium prices.
3. Current Price Action: Blue Sky Territory
Look at the most recent weekly candle on the far right. The pressure cooker has finally exploded. Buyers have effortlessly shattered the 10,078.00 macro resistance, printing a massive, full-bodied green expansion candle. By clearing this final historical ceiling, the Nifty Commodities index has officially entered "Blue Sky Territory" (pure price discovery). There is absolutely zero historical overhead supply left. Every single investor who has bought and held this index is now in profit, meaning natural selling pressure evaporates.
4. The Trade Plan: Entries, Targets, and Risk Management
Entry Strategy: Momentum is exceptionally strong right now near 10,398.70. Chasing a massive weekly expansion candle always carries a higher risk of immediate intraday drawdown. The highest-probability, lowest-risk entry involves stepping down to a daily timeframe and placing limit orders to catch a potential minor structural pullback to retest the 10,000.00 to 10,100.00 breakout zone. Letting that ultimate resistance prove itself as a new, indestructible support floor offers a phenomenal risk-to-reward ratio.
Take Profit (Targets): Because the index is in pure price discovery, we use measured structural targets. By taking the depth of the massive macro recovery (roughly 2,400 points from the 7,672 base to the 10,078 ceiling) and projecting it upward from the breakout line, our primary macro extension target sits comfortably in the 12,400.00 to 12,500.00 zone. Immediate psychological milestones are 11,000.00 and 11,500.00.
Invalidation (Stop Loss): A trade thesis is only valid if the new market structure holds. A hard stop loss should be placed safely below the previous stepping stone and recent pivot, around the 9,600.00 to 9,700.00 level. A definitive weekly close completely back below the 9,864.70 line would act as an early warning sign of a failed macro breakout (a "bull trap").
5. Time Horizon:
Because this technical setup is built on a 1-Week chart capturing a massive structural completion into fresh price discovery, this is a medium-to-longer-term position outlook designed to play out over the coming weeks to months. Let the macro trend run!  Long
Long
GESHIP: Textbook Break & Retest of Massive Macro Structure1. The Macro Perspective: Completing the Cup
I am taking a LONG bias on Great Eastern Shipping Co. Ltd. (GESHIP) on the weekly (1W) timeframe.
When zooming out on this chart, we see a massive structural narrative playing out. The stock set a major macro top near the 1437.50 level in mid-2024. After that, it went through a prolonged, deep correction, flushing out weak hands before slowly grinding its way back up. This massive "U-shape" price action forms a classic rounding bottom or "Cup" pattern. The real magic, however, happens at the breakout line.
2. The Educational Setup: Old Ceilings Become New Floors
The absolute best risk-to-reward setups do not happen by chasing the initial breakout pump. They happen on the retest.
The Breakout: GESHIP recently smashed through the 1437.50 historical resistance with immense momentum.
The Retest: Instead of continuing straight up, the stock exhausted briefly and pulled back. To an amateur, this looks like a failed breakout. But to a structural trader, this is the exact entry trigger we wait for. The price perfectly tagged the 1437.50 level from above. Buyers aggressively stepped in right at this line, officially confirming that the old, heavy resistance ceiling has flipped into a rock-solid support floor.
3. Current Price Action: The Bollinger Expansion
Look at the current weekly candle. We are seeing a powerful bullish rejection of lower prices right at our new support floor. Furthermore, if you look at the Bollinger Bands, this push is forcing the upper red band to expand outward. A successful retest combined with an expanding upper band is the ultimate confirmation that the next impulsive leg of the macro uptrend has begun.
4. The Trade Plan: Entries, Targets, and Risk Management
Entry Strategy: Momentum traders can look for entries near the current market price (1576.80) to capture the confirmed continuation bounce. A slightly safer approach would be stepping down to a daily chart to catch any minor intraday pullbacks toward the 1500.00 to 1520.00 zone.
Take Profit (Targets): With the stock breaking out of a massive multi-year base into fresh blue-sky territory, the momentum can carry it significantly higher. The next major psychological milestones are the 1750.00 level, followed by 1800.00. Ultimately, this macro structure points toward the 2000.00 mark.
Invalidation (Stop Loss): The entire thesis relies on the 1437.50 level holding as support. A stop loss should be placed safely below the recent retest wick and the 20-SMA dynamic support, around the 1350.00 to 1380.00 level. A definitive weekly close back below the 1437.50 line would act as an early warning sign of a failed macro breakout (a "bull trap").
5. Time Horizon:
Because this technical setup is built on a 1-Week chart capturing a major structural transition and continuation, this is a medium-to-longer-term position trade designed to play out over the coming weeks to months.  Long
Long
PIRAMALFIN: Explosive Box Breakout with Massive Volume Confirmat1. The Structural Perspective: The Consolidation Box
I am taking a LONG bias on Piramal Finance Limited (PIRAMALFIN) on the daily (1D) timeframe.
When analyzing price action, extended periods of sideways movement are incredibly important. For months, PIRAMALFIN has been trapped in a massive consolidation "box" or channel. The price ping-ponged perfectly between the hard support floor at 1701.05 and the heavy resistance ceiling at 1913.20. In technical analysis, the longer a stock consolidates sideways, the more explosive the eventual breakout will be. Energy was being tightly coiled.
2. The Educational Setup: The Shakeout and Volatility Squeeze
To understand the mechanics of this aggressive breakout, look at the Bollinger Bands leading up to the move:
The Squeeze: Throughout March and April, the upper and lower Bollinger Bands pinched tightly together. This volatility squeeze indicates that the market was reaching an equilibrium, preparing for a massive directional move.
The Shakeout (Bear Trap): Just before the breakout, notice how the price briefly dipped, testing the lower boundary and shaking out weak hands. Once the sellers were exhausted, institutional buyers stepped in with immense force.
3. Current Price Action: The Breakout and Volume Anomaly
Look at the massive green breakout candle that shattered the 1913.20 ceiling. There are two massive confirmations here:
Bollinger Expansion: The price is actively riding and pushing the upper red Bollinger Band outward, confirming a sudden and violent volatility expansion.
Volume Confirmation: Look at the volume indicator at the bottom of the chart. The volume bar on the breakout day is absolutely massive—an undeniable anomaly compared to the previous months of trading. This proves that this breakout isn't retail noise; it is driven by heavy institutional accumulation.
4. The Trade Plan: Entries, Targets, and Risk Management
Entry Strategy: The stock has just experienced a massive surge and is currently trading near 1998.60. Chasing extended daily candles carries higher risk. The highest-probability entry would be placing limit orders to catch a potential daily pullback to retest the 1913.20 breakout line. Letting that old heavy resistance prove itself as a new support floor offers a phenomenal risk-to-reward ratio.
Take Profit (Targets): With the stock breaking out of a multi-month box on historic volume, it enters a strong markup phase. The immediate psychological targets are 2100.00 and 2200.00.
Invalidation (Stop Loss): A trade is only valid if the breakout holds. A stop loss should be placed safely below the breakout candle's origin and the 20-SMA dynamic support, around the 1840.00 to 1850.00 level. A daily close back inside the consolidation box (below 1913.20) would invalidate the immediate bullish momentum.
5. Time Horizon:
Because this technical setup is built on a 1-Day chart capturing a high-momentum volume breakout, this is a short-to-medium-term swing trade designed to play out over the coming days to weeks.  Long
Long
 Long
Long
J&KBANK: Weekly Macro Base Breakout & Earnings Catalyst1. The Macro Perspective: The Multi-Month Accumulation BaseI am taking a LONG bias on Jammu & Kashmir Bank Ltd. (J&KBANK) on the macro weekly (1W) timeframe.When analyzing pure market structure on a PSU bank, extended accumulation bases are critical for initiating the next leg of a secular markup. Following a steep corrective phase, the stock entered a massive structural consolidation spanning over a year, forming a wide rounding base. This digestion phase absorbed overhead supply and allowed institutional capital to quietly accumulate shares. Fundamentally, this fierce technical momentum aligns flawlessly with the bank's record-breaking Q4 FY26 results. The bank posted its highest-ever annual net profit of ₹2,363.47 crore for FY26, with Q4 net profit surging 36.5% YoY to ₹797.81 crore. Asset quality has also seen significant improvement, with the Gross NPA ratio dropping to 2.50% in Q4FY26. Documenting these classical accumulation bases makes the charting workflow highly repeatable for anyone analyzing long-term momentum shifts.
2. The Educational Setup: Horizontal Resistance & Structural FloorsTo understand the technical validity behind this macro launch, look closely at how the price structure interacted with its core boundaries:The 143.30 Resistance Ceiling: The definitive line in the sand for a bullish structural shift was the solid red horizontal resistance line drawn exactly at 143.30. This level established a massive supply zone that systematically capped upward momentum over the past year.The Structural Floors: During the consolidation, buyers established clear, stepped structural floors near 98.85, 112.88, and 127.51, marked by the white horizontal lines. This persistent defense at higher lows built immense kinetic energy for the eventual breakout.
3. Current Price Action: Breakout and Volatility ExpansionLook at the most recent weekly candle on the far right of the chart. The structural pressure cooker has officially exploded. Institutional buyers have stepped in with undeniable conviction. The stock printed a strong green expansion candle that has decisively obliterated the 143.30 multi-month ceiling, currently trading incredibly strong near 147.72. The stock has officially transitioned out of macro accumulation and into a highly explosive markup trend into fresh territory.Note: Because this is a weekly timeframe, ensure all end-of-week data has fully synchronized before officially confirming the final shape of the breakout candle.
4. The Trade Plan: Entries, Targets, and Risk ManagementEntry Strategy: Macro momentum is exceptionally strong with the stock trading vertically out in the open above the pivotal breakout line. Chasing an extended weekly breakout candle carries a minor risk of a lower-timeframe mean-reversion pullback. The highest-probability, lowest-risk entry strategy involves stepping down to the daily timeframe and waiting for the initial vertical excitement to cool off. Look to scale into long positions on a potential structural pullback to perfectly retest the broken 140.00 to 144.00 prior resistance zone. Letting old historical resistance prove itself as a concrete new support floor provides an unmatched risk-to-reward ratio.
Take Profit (Targets): By utilizing a classical measured move strategy based on the structural depth of the accumulation base, we can project upside targets. Taking the approximate depth of the macro base (roughly 45 points from the 98.85 floor up to the 143.30 ceiling) and projecting it upward from the breakout point, our primary structural macro target sits comfortably in the 185.00 to 190.00 zone over the coming months.
Invalidation (Stop Loss): An explosive macro breakout thesis is completely invalidated if the price fails to hold its newly claimed structural floor and collapses back inside the core of the base boundaries. A hard stop loss should be placed safely below the recent stepped support and lower-timeframe swing lows, specifically around the 125.00 to 127.00 level. A definitive weekly close completely back below 125.00 would act as a severe warning sign of a failed macro breakout and a major bull trap.
5. Time Horizon:Because this technical setup captures a clear structural phase transition and a major horizontal breakout on the 1-Week chart, this is a long-term position trade designed to capture a sustained secular markup phase over the coming months and quarters. Let the macro trend run!  Long
Long
IDEAFORGE: Weekly Macro Base Breakout & Earnings Catalyst1. The Macro Perspective: The Multi-Month Accumulation Base
I am taking a LONG bias on ideaForge Technology Limited (IDEAFORGE) on the macro weekly (1W) timeframe.
When analyzing pure market structure on a defence and drone technology stock, extended accumulation bases are critical for initiating the next leg of a secular markup. Following a steep corrective phase from its all-time highs, the stock entered a massive structural consolidation spanning several months, forming a wide rounding base. This digestion phase absorbed overhead supply and allowed institutional capital to quietly accumulate shares. Fundamentally, this fierce technical momentum aligns flawlessly with the company's recent Q4 FY26 results and strategic moves. The company recorded a consolidated net profit after tax (PAT) of ₹60.95 crore in the January to March quarter of the financial year ended 2025-26. The company posted a net loss of ₹25.92 crore in the same period a year ago. Furthermore, the board of directors approved a proposal to raise up to Rs 500 crore through a qualified institutional placement (QIP), preferential allotment, or private placement. Documenting these classical accumulation bases makes the charting workflow highly repeatable for anyone analyzing long-term momentum shifts.
2. The Educational Setup: Horizontal Resistance
To understand the technical validity behind this macro launch, look closely at how the price structure interacted with its core boundaries:
The 889.45 Resistance Ceiling: The definitive line in the sand for a bullish structural shift was the solid red horizontal resistance line drawn exactly at 889.45. This level established a massive supply zone that systematically capped upward momentum over the past quarters.
The Structural Floor: During the consolidation, buyers established clear support near the 650.00 to 700.00 zones, marking higher lows in recent weeks. This persistent defense built immense kinetic energy for the eventual breakout.
3. Current Price Action: Breakout and Volatility Expansion
Look at the most recent weekly candle on the far right of the chart. The structural pressure cooker has officially exploded. Institutional buyers have stepped in with undeniable conviction. The stock printed a strong green expansion candle that has decisively obliterated the 889.45 multi-month ceiling, currently trading incredibly strong near 945.00 (+11.85%). The stock has officially transitioned out of macro accumulation and into a highly explosive markup trend into fresh territory.
Note: Because this is a weekly timeframe, ensure all end-of-week data has fully synchronized before officially confirming the final shape of the breakout candle.
4. The Trade Plan: Entries, Targets, and Risk Management
Entry Strategy: Macro momentum is exceptionally strong with the stock trading vertically out in the open above the pivotal breakout line. Chasing an extended weekly breakout candle carries a minor risk of a lower-timeframe mean-reversion pullback. The highest-probability, lowest-risk entry strategy involves stepping down to the daily timeframe and waiting for the initial vertical excitement to cool off. Look to scale into long positions on a potential structural pullback to perfectly retest the broken 880.00 to 895.00 prior resistance zone. Letting old historical resistance prove itself as a concrete new support floor provides an unmatched risk-to-reward ratio.
Take Profit (Targets): By utilizing a classical measured move strategy based on the structural depth of the accumulation base, we can project upside targets. Taking the approximate depth of the macro base (roughly 240 points from the 650.00 floor up to the 889.45 ceiling) and projecting it upward from the breakout point, our primary structural macro target sits comfortably in the 1,120.00 to 1,140.00 zone over the coming months.
Invalidation (Stop Loss): An explosive macro breakout thesis is completely invalidated if the price fails to hold its newly claimed structural floor and collapses back inside the core of the base boundaries. A hard stop loss should be placed safely below the recent lower-timeframe swing lows, specifically around the 800.00 to 820.00 level. A definitive weekly close completely back below 800.00 would act as a severe warning sign of a failed macro breakout and a major bull trap.
5. Time Horizon:
Because this technical setup captures a clear structural phase transition and a major horizontal breakout on the 1-Week chart, this is a long-term position trade designed to capture a sustained secular markup phase over the coming months and quarters. Let the macro trend run!  Long
Long
INOXINDIA: Weekly Macro Base Breakout & Earnings Catalyst1. The Macro Perspective: The Multi-Month Accumulation BaseI am taking a LONG bias on INOX India Limited (INOXINDIA) on the macro weekly (1W) timeframe
When analyzing pure market structure on a cryogenic storage and capital goods leader, extended accumulation bases are critical for initiating the next leg of a secular markup. Following a steep corrective phase from its initial highs, the stock entered a massive structural consolidation spanning several months, carving out a wide rounding base. This digestion phase absorbed overhead supply and allowed institutional capital to quietly accumulate shares. Fundamentally, this fierce technical momentum aligns flawlessly with the company's record-breaking financial performance. The company reported its highest-ever Q4 Revenue of ₹475 crore, registering a strong 24.2% YoY growth, while adjusted PAT for FY26 increased by 19.3% YoY to ₹261 crore. Furthermore, INOX India has secured multiple orders worth ₹322 crore since April 2026 across its key business segments, underscoring the continued confidence of global majors as well as domestic customers. Documenting these classical accumulation bases makes the charting workflow highly repeatable for anyone analyzing long-term momentum shifts.
2. The Educational Setup: Horizontal ResistanceTo understand the technical validity behind this macro launch, look closely at how the price structure interacted with its core boundaries:
The 1,454.80 Resistance Ceiling: The definitive line in the sand for a bullish structural shift was the solid yellow horizontal resistance line drawn exactly at 1,454.80. This level established a massive supply zone that systematically capped upward momentum over the past year.
The Structural Floor: During the consolidation, buyers established clear support near the 920.00 to 950.00 zones, marking the structural floor of the base. This persistent defense built immense kinetic energy for the eventual breakout.
3. Current Price Action: Breakout and Volatility Expansion
Look at the most recent weekly candle on the far right of the chart. The structural pressure cooker has officially exploded. Institutional buyers have stepped in with undeniable conviction. The stock printed a towering, full-bodied green expansion candle that has decisively obliterated the 1,454.80 multi-month ceiling, currently trading incredibly strong near 1,571.70 (+5.23% on the session). The stock has officially transitioned out of macro accumulation and into a highly explosive markup trend into fresh territory.
Note: Because this is a weekly timeframe, ensure all end-of-week data has fully synchronized before officially confirming the final shape of the breakout candle.
4. The Trade Plan: Entries, Targets, and Risk Management
Entry Strategy: Macro momentum is exceptionally strong with the stock trading vertically out in the open above the pivotal breakout line. Chasing an extended weekly breakout candle carries a minor risk of a lower-timeframe mean-reversion pullback. The highest-probability, lowest-risk entry strategy involves stepping down to the daily timeframe and waiting for the initial vertical excitement to cool off. Look to scale into long positions on a potential structural pullback to perfectly retest the broken 1,440.00 to 1,460.00 prior resistance zone. Letting old historical resistance prove itself as a concrete new support floor provides an unmatched risk-to-reward ratio.
Take Profit (Targets): By utilizing a classical measured move strategy based on the structural depth of the accumulation base, we can project upside targets. Taking the approximate depth of the macro base (roughly 500 points from the 950.00 floor up to the 1,454.80 ceiling) and projecting it upward from the breakout point, our primary structural macro target sits comfortably in the 1,900.00 to 1,950.00 zone over the coming months.
Invalidation (Stop Loss): An explosive macro breakout thesis is completely invalidated if the price fails to hold its newly claimed structural floor and collapses back inside the core of the base boundaries. A hard stop loss should be placed safely below the recent lower-timeframe swing lows, specifically around the 1,280.00 to 1,300.00 level. A definitive weekly close completely back below 1,280.00 would act as a severe warning sign of a failed macro breakout and a major bull trap.
5. Time Horizon:Because this technical setup captures a clear structural phase transition and a major horizontal breakout on the 1-Week chart, this is a long-term position trade designed to capture a sustained secular markup phase over the coming months and quarters. Let the macro trend run!  Long
Long
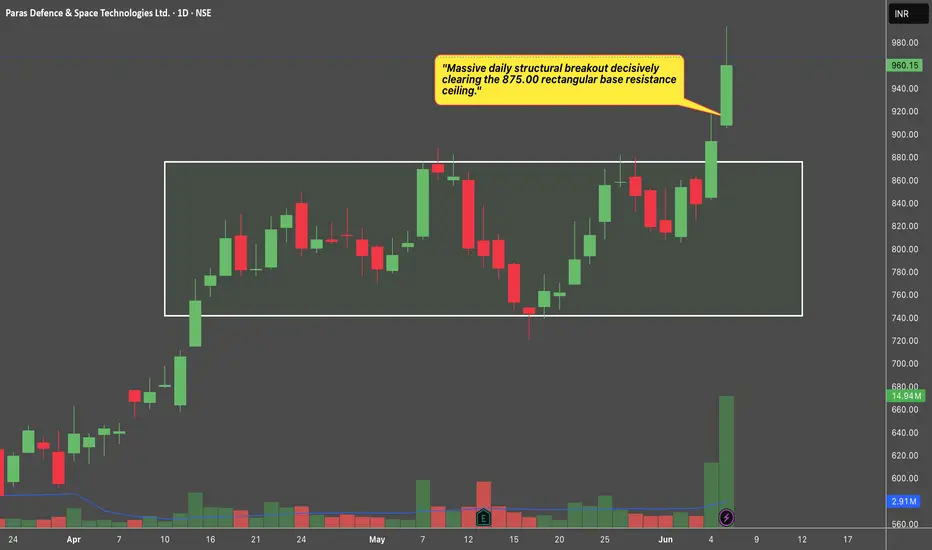
PARAS: Daily Rectangular Base Breakout & Fundamental Catalyst1. The Macro Perspective: The Rectangular Consolidation Base
I am taking a LONG bias on Paras Defence & Space Technologies Ltd. (PARAS) on the daily (1D) timeframe
When analyzing pure market structure on a high-growth defence and aerospace stock, extended accumulation bases are critical for absorbing supply before initiating the next leg of a secular markup. Following a prior run-up, the stock entered a massive structural consolidation phase spanning several weeks, carving out a highly defined rectangular Darvas Box. This digestion phase flushed out weak hands and allowed institutional capital to quietly accumulate shares at steady valuations. Fundamentally, this fierce technical momentum aligns flawlessly with the company's strong Q4 FY26 results, where consolidated PAT surged 75% YoY to ₹34.5 crore and revenue jumped 54.5% YoY to ₹170 crore. Furthermore, the company recently secured a high-precision ₹52.82 crore contract from BEL for electro-optics supply, underscoring robust demand. Documenting these classical accumulation bases makes the charting workflow highly repeatable for anyone analyzing momentum shifts.
2. The Educational Setup: Horizontal Resistance & Structural Support
To understand the technical validity behind this macro launch, look closely at how the price structure interacted with its core boundaries:
The 875.00 Resistance Ceiling: The definitive line in the sand for a bullish structural shift was the top of the rectangular box drawn near 875.00. This level established a solid supply zone that systematically capped upward momentum over the consolidation period.
The 745.00 Structural Support: During the consolidation, buyers established clear support near the 745.00 zone, marked by the lower boundary of the box. The price action oscillated cleanly between these two boundaries, gradually building immense kinetic energy.
3. Current Price Action: Breakout and Volatility Expansion
Look at the most recent daily candle on the far right of the chart. The structural pressure cooker has officially exploded. Institutional buyers have stepped in with undeniable conviction, backed by a massive volume expansion. The stock printed a towering, full-bodied green expansion candle that has decisively obliterated the 875.00 ceiling, currently trading incredibly strong near 960.15 (+7.42% on the session) after hitting an intraday high of 994.00. The stock has officially transitioned out of accumulation and into a highly explosive markup trend into fresh territory.
Note: Always ensure your exchange's End of Day (EOD) data files have fully synchronized before confirming the final daily close shape, as evening data synchronization delays can occasionally alter the visual confirmation of these critical breakout wicks.
4. The Trade Plan: Entries, Targets, and Risk Management
Entry Strategy: Momentum is exceptionally strong with the stock trading vertically out in the open above the pivotal breakout line. Chasing an extended daily breakout candle carries a minor risk of a short-term mean-reversion pullback. The highest-probability, lowest-risk entry strategy involves waiting for the initial vertical excitement to cool off. Look to scale into long positions on a potential structural pullback to perfectly retest the broken 860.00 to 880.00 prior resistance zone. Letting old historical resistance prove itself as a concrete new support floor provides an unmatched risk-to-reward ratio.
Take Profit (Targets): By utilizing a classical measured move strategy based on the structural depth of the rectangular base, we can project upside targets. Taking the approximate depth of the base (roughly 130 points from the 745.00 floor up to the 875.00 ceiling) and projecting it upward from the breakout point, our primary structural target sits comfortably in the 1,000.00 to 1,020.00 zone over the coming weeks.
Invalidation (Stop Loss): An explosive breakout thesis is completely invalidated if the price fails to hold its newly claimed structural floor and collapses back inside the core of the base boundaries. A hard stop loss should be placed safely below the mid-line of the consolidation box, specifically around the 800.00 to 810.00 level. A definitive daily close completely back below 800.00 would act as a severe warning sign of a failed breakout and a major bull trap.
5. Time Horizon:
Because this technical setup captures a clear structural phase transition and a textbook rectangular box breakout on the 1-Day chart, this is a high-alpha swing trade designed to capture a rapid momentum markup phase over the coming weeks. Let the trend run!  Long
Long
NRBBEARING: Monthly Macro Range Breakout1. The Macro Perspective: The Multi-Year Accumulation Base
I am taking a LONG bias on NRB Bearings Ltd. (NRBBEARING) on the macro monthly (1M) timeframe
When analyzing pure market structure on an auto-components manufacturer, extended accumulation bases are critical for initiating the next leg of a secular markup. Following a corrective phase, the stock entered a massive structural consolidation spanning nearly two years, carving out a wide, high-precision base. This digestion phase absorbed overhead supply and allowed institutional capital to quietly accumulate shares.
2. The Educational Setup: Horizontal Resistance & Structural Floor
To understand the technical validity behind this macro launch, look closely at how the price structure interacted with its core boundaries:
The 343.20 Resistance Ceiling: The definitive line in the sand for a bullish structural shift was the solid black horizontal resistance line drawn at 343.20. This level established a massive supply zone that systematically capped upward momentum over the past two years.
The Structural Floor: During the consolidation, the stock established a clear structural floor near the 180.00 to 200.00 zones, marking the low point before beginning a methodical climb to form the right side of the base. This persistent defense built immense kinetic energy for the eventual breakout.
3. Current Price Action: Breakout and Volatility Expansion
Look at the most recent monthly candle on the far right of the chart. The structural pressure cooker has officially exploded. Institutional buyers have stepped in with undeniable conviction, backed by a monumental volume expansion. The stock printed a towering, full-bodied green expansion candle that has decisively obliterated the 343.20 macro ceiling, currently trading incredibly strong near 385.65 (+24.01% on the session). The stock has officially transitioned out of macro accumulation and into a highly explosive markup trend into fresh territory.
Note: Because this is a monthly timeframe, ensure all end-of-month data has fully synchronized before officially confirming the final shape of the breakout candle. Always wait for the final close to ensure no false breakout wicks appear.
4. The Trade Plan: Entries, Targets, and Risk Management
Entry Strategy: Macro momentum is exceptionally strong with the stock trading vertically out in the open above the pivotal breakout line. Chasing an extended monthly breakout candle carries a minor risk of a lower-timeframe mean-reversion pullback. The highest-probability, lowest-risk entry strategy involves stepping down to the daily timeframe and waiting for the initial vertical excitement to cool off. Look to scale into long positions on a potential structural pullback to perfectly retest the broken 340.00 to 350.00 prior resistance zone. Letting old historical resistance prove itself as a concrete new support floor provides an unmatched risk-to-reward ratio.
Take Profit (Targets): By utilizing a classical measured move strategy based on the structural depth of the accumulation base, we can project upside targets. Taking the approximate depth of the macro base (roughly 160 points from the 180.00 floor up to the 343.20 ceiling) and projecting it upward from the breakout point, our primary structural macro target sits comfortably in the 500.00 to 550.00 zone over the coming quarters.
Invalidation (Stop Loss): An explosive macro breakout thesis is completely invalidated if the price fails to hold its newly claimed structural floor and collapses back inside the core of the base boundaries. A hard stop loss should be placed safely below the recent lower-timeframe swing lows, specifically around the 270.00 to 290.00 level. A definitive monthly close completely back below 270.00 would act as a severe warning sign of a failed macro breakout and a major bull trap.
5. Time Horizon:
Because this technical setup captures a clear structural phase transition and a major horizontal breakout on the 1-Month chart, this is a long-term position trade designed to capture a sustained secular markup phase over the coming months and quarters. Let the macro trend run!  Long
Long
EMCURE: Textbook Step-Up Base and Explosive Macro Continuation1. The Macro Perspective: The Deep Washout and Recovery
I am taking a LONG bias on Emcure Pharmaceuticals Limited (EMCURE) on the weekly (1W) timeframe.
When analyzing a chart for a major position trade, we want to see how the stock handles historical supply. Months ago, EMCURE established a major historical ceiling at the 1568.75 level. It then underwent a brutal, deep correction, washing out all the weak hands. However, the stock didn't die; it initiated a methodical, multi-month rounding recovery, systematically absorbing overhead supply until it finally reclaimed that original 1568.75 crime scene.
2. The Educational Setup: The Power of the Step-Up Base
The absolute most bullish thing a stock can do after a major macro breakout is pause.
The Breakout & Hold: After decisively breaking above the 1568.75 macro ceiling, the stock did not immediately go parabolic (which often leads to a crash). Instead, it built a "Step-Up Base."
The New Launchpad: It spent several weeks chopping sideways in a tight, controlled range, successfully flipping the old 1568.75 resistance into a new macro floor, and establishing a new local resistance line at 1667.70. This sideways digestion phase allowed moving averages to catch up, transferred shares from early profit-takers to long-term institutional holders, and stored massive kinetic energy.
3. Current Price Action: Blue Sky Territory
Look at the most recent weekly candle on the far right. The pressure cooker has exploded. Buyers have effortlessly shattered the 1667.70 continuation resistance, and the stock is closing near its absolute highs. By clearing this final consolidation zone, EMCURE has officially entered "Blue Sky Territory" (pure price discovery). There is absolutely zero historical overhead supply left to act as resistance, meaning selling pressure naturally evaporates.
4. The Trade Plan: Entries, Targets, and Risk Management
Entry Strategy: The stock is currently experiencing extreme upside momentum near 1793.20. Chasing a massive weekly expansion candle always carries a higher risk of immediate drawdown. The highest-probability, lowest-risk entry involves stepping down to a daily timeframe and placing limit orders to catch a potential minor structural pullback to retest the 1667.70 to 1700.00 breakout zone. Letting that newly broken ceiling prove itself as the newest step on the staircase offers a phenomenal risk-to-reward ratio.
Take Profit (Targets): Because the stock is in pure price discovery, we can use measured structural targets. By taking the depth of the massive macro correction (roughly 600+ points from the ~900 lows to the 1568 neckline) and projecting it upward, our primary macro target sits near the 2100.00 to 2200.00 zone. Immediate psychological milestones are 1900.00 and 2000.00.
Invalidation (Stop Loss): A trade thesis is only valid if the new market structure holds. A hard stop loss should be placed safely below the recent step-up base, around the 1480.00 to 1500.00 level. A definitive weekly close completely back below the original 1568.75 macro line would invalidate the breakout and signal a major structural failure.
5. Time Horizon:
Because this technical setup is built on a 1-Week chart capturing a major structural continuation into fresh price discovery, this is a medium-to-longer-term position trade designed to play out over the coming weeks to months. Let the macro trend run!  Long
Long
SAILIFE: The Perfect Macro Staircase and Blue Sky Breakout1. The Macro Perspective: The Launchpad and the Climb
I am taking a LONG bias on Sai Life Sciences (SAILIFE) on the weekly (1W) timeframe.
When analyzing pure market structure, some of the most reliable and powerful trends do not go straight up in a single volatile line; they climb stairs. Look at the massive structural development on this chart. The stock built its initial macro launchpad below the solid black 794.45 line. Once it successfully broke out of that foundational base, it initiated a textbook, methodical markup phase that clearly displays heavy institutional footprints.
2. The Educational Setup: Conquering the Stepping Stones
To understand the sheer strength of this current trend, look at how the price systematically digests historical supply and builds a "Staircase" on the right side of the curve:
The Step-Up Bases: Every time the stock experienced a momentum thrust, it refused to give back its gains. Instead, it chopped sideways to build a new, higher floor.
The Structural Checkpoints: Look at your horizontal black lines. The stock rallied, paused to build a base under 935.70, broke out, built another tight flag under 978.10, broke out, and then consolidated to form its most recent high-level base under the 1,072.40 ceiling. Consolidating tightly directly underneath resistance acts like a pressure cooker, gracefully transferring shares from impatient retail traders to strong-handed institutional buyers.
3. Current Price Action: Blue Sky Territory
Look at the most recent weekly candles on the far right. The high-level pressure cooker has finally exploded. Buyers have effortlessly shattered the 1,072.40 ceiling, printing massive, full-bodied green expansion candles and surging past 1,120. By clearing this final historical accumulation step, SAILIFE has officially entered "Blue Sky Territory" (pure price discovery). There is absolutely zero historical overhead supply left. Every single investor who has bought and held this stock is now in profit, meaning natural selling pressure evaporates.
4. The Trade Plan: Entries, Targets, and Risk Management
Entry Strategy: Momentum is exceptionally strong right now near 1,126.30. Chasing a massive weekly expansion candle always carries a higher risk of an immediate intraday drawdown as the stock naturally breathes. The highest-probability, lowest-risk entry involves stepping down to a daily timeframe and placing limit orders to catch a potential minor structural pullback to retest the 1,070.00 to 1,080.00 breakout zone. Letting that old heavy resistance prove itself as a new, indestructible support floor offers a phenomenal risk-to-reward ratio.
Take Profit (Targets): Because the stock is in pure price discovery, we use measured structural targets. By taking the depth of the recent step-up base (roughly 135 points from the 935.70 floor to the 1,072.40 ceiling) and projecting it upward from the breakout line, our primary macro extension target sits comfortably in the 1,200.00 to 1,210.00 zone. Immediate psychological milestones are 1,150.00 and 1,250.00.
Invalidation (Stop Loss): A trade thesis is only valid if the new market structure holds. A hard stop loss should be placed safely below the previous stepping stone, around the 960.00 to 970.00 level. A definitive weekly close completely back below the 978.10 line would act as an early warning sign of a failed macro breakout and severe structural weakness.
5. Time Horizon:
Because this technical setup is built on a 1-Week chart capturing a massive structural staircase into fresh price discovery, this is a medium-to-longer-term position trade designed to play out over the coming weeks to months. Let the macro trend run!  Long
Long
ACMESOLAR: Daily Cup & Handle Breakout1. The Macro Perspective: The Massive Cup Formation
I am taking a LONG bias on ACME Solar Holdings Ltd. (ACMESOLAR) on the daily (1D) timeframe.
When analyzing pure market structure on a renewable energy sector player, extended accumulation patterns like the classical Cup and Handle are essential to absorb supply and build kinetic energy. Following its previous peak in Q3 2025, the stock underwent a prolonged rounding correction, carving out the massive "Cup" structure visible on the chart. This multi-month digestion phase allowed institutional capital to systematically accumulate shares at lower valuations. Documenting these classical accumulation bases makes the charting workflow highly repeatable for anyone analyzing momentum shifts. Fundamentally, this fierce technical momentum aligns seamlessly with the continued acceleration and capital inflows within the green energy sector.
2. The Educational Setup: The Handle and Resistance
To understand the technical validity behind this macro launch, look closely at how the price structure interacted with its core boundaries:
The 320.20 Resistance Ceiling: The definitive line in the sand for a bullish structural breakout was the solid black horizontal resistance line drawn at 320.20. This level marked the absolute lip of the cup formation, acting as a heavy supply zone that systematically rejected the initial breakout attempt in late April.
The Handle Formation: Following that initial rejection at the 320.20 ceiling, the price experienced a healthy, localized rounding pullback throughout May. This tight, shallow correction formed the "Handle" of the pattern, squeezing volatility and allowing the daily moving averages to catch up and act as a dynamic launchpad.
3. Current Price Action: Breakout and Volatility Expansion
Look at the massive daily candle on the far right of the chart. The structural pressure cooker has officially exploded. Institutional buyers have stepped in with undeniable conviction. The stock printed a towering, full-bodied green expansion candle that has vertically surged to close at 334.75 (+8.97% on the session). This explosive thrust has decisively obliterated the 320.20 macro ceiling. The stock has officially transitioned out of accumulation and into a highly explosive markup trend into fresh blue-sky territory.
4. The Trade Plan: Entries, Targets, and Risk Management
Entry Strategy: Momentum is exceptionally strong with the stock trading vertically out in the open above the breakout line. Chasing an extended daily breakout candle carries a minor risk of a short-term mean-reversion pullback. The highest-probability entry strategy involves waiting for the initial vertical excitement to cool off. Look to scale into long positions on a potential structural pullback that perfectly retests the broken 315.00 to 325.00 prior resistance zone. Letting old historical resistance prove itself as a concrete new support floor provides an unmatched risk-to-reward ratio. Note: Always ensure your exchange's End of Day (EOD) data files have fully synchronized before confirming the final daily close shape, as evening data shifts can occasionally alter the visual confirmation of these critical retest wicks.
Take Profit (Targets): We use a classical measured move strategy based on the structural depth of the cup pattern. By taking the depth of the cup (roughly 110 points from the absolute structural floor near 210.00 up to the 320.20 ceiling) and projecting it upward from the breakout point, our primary structural macro target sits comfortably in the 425.00 to 435.00 zone over the coming weeks and months.
Invalidation (Stop Loss): An explosive breakout thesis is completely invalidated if the price fails to hold its newly claimed structural floor and collapses back inside the core of the handle boundary. A hard stop loss should be placed safely below the recent handle swing low, specifically around the 265.00 to 275.00 level. A definitive daily close completely back below 265.00 would act as a severe warning sign of a failed macro breakout and a major bull trap.
5. Time Horizon:
Because this technical setup is built on a 1-Day chart capturing a clear structural phase transition and a textbook cup and handle breakout, this is a high-alpha swing trade designed to capture a rapid momentum markup phase over the coming weeks. Let the trend run!  Long
Long
BELRISE: Textbook Break & Retest and Structural Continuation1. The Macro Perspective: The Deep Washout and Recovery
I am taking a LONG bias on Belrise Industries Limited (BELRISE) on the daily (1D) timeframe.
When analyzing pure market structure, we have to respect major historical pivot points. Look at the lower solid black horizontal line at 197.41. After establishing a heavy ceiling near this level months ago, the stock suffered a brutal, volatile markdown phase that dragged the price down into the 150s. However, instead of collapsing into a sustained bear trend, the stock continuously absorbed selling pressure, slowly carving out a massive rounding bottom and aggressively grinding its way right back up to conquer the 197.41 crime scene.
2. The Educational Setup: Conquering the Stepping Stones
To understand the sheer strength of this current setup, look at how the price systematically dismantled historical resistance by building a "Staircase":
The New Foundation: Once the stock cleared the 197.41 ceiling, it chopped sideways, perfectly testing it from above and flipping it into a rock-solid support floor.
The High-Level Base: Using 197.41 as its foundation, the stock rallied into the next major resistance zone at 224.41. Instead of suffering a deep rejection, buyers refused to let the structure break down. They formed a tight, high-level consolidation right under the resistance line, willingly absorbing shares at premium prices and acting like a pressure cooker.
3. Current Price Action: Flipping the Script
In technical analysis, breaking a resistance line is only half the battle. The most reliable setups occur when a stock proves it can defend its newly claimed territory. Look at the most recent daily candles on the far right. The pressure cooker finally exploded, and the stock decisively shattered the 224.41 ceiling.
The Retest: To amateur traders, the current red pullback candle looks like a failed rally. To structural traders, this is the exact trigger we wait for. The price is pulling back to perfectly test that 224.41 line from above. The old, heavy resistance ceiling is officially being flipped into a brand-new, rock-solid support floor.
4. The Trade Plan: Entries, Targets, and Risk Management
Entry Strategy: We are currently sitting right in the "golden entry" zone. The highest-probability, lowest-risk entry involves stepping in right here at the structural retest of the 224.00 to 225.00 zone. Letting that newly broken ceiling prove itself as an indestructible support floor offers a phenomenal risk-to-reward ratio.
Take Profit (Targets): We can find a measured technical target by taking the depth of the previous accumulation base (roughly 27 points from the 197.41 floor to the 224.41 ceiling) and projecting it upward from the breakout level. This gives us a primary structural target in the 250.00 to 255.00 zone.
Invalidation (Stop Loss): A trade thesis is only valid if the market structure holds. A hard stop loss should be placed safely below the breakout line and the recent consolidation pivots, around the 210.00 to 214.00 level. A definitive daily close completely back inside the old box and below 224.41 would invalidate the immediate "break and go" thesis and signal a potential bull trap.
5. Time Horizon:
Because this technical setup is built on a 1-Day chart capturing a major structural break and retest, this is a short-to-medium-term swing trade designed to capture the next explosive continuation phase. Let the structure dictate the trend!  Long
Long
FED DAY - REBOUND AT RESISTANCE — SELLING OPPORTUNITY?Gold is attempting a technical rebound from the lower boundary of the descending channel, but the broader H4 structure remains bearish. After falling toward the 4,250–4,280 area, price has started to recover and is currently around 4,325. However, this rebound is still developing below the descending trendline, meaning buyers have not yet produced the structural confirmation needed for a reversal.
From a macro perspective, today is dominated by the FOMC decision. Markets have priced in more than a 90% probability of a 25bp rate hike, while the U.S. 10Y yield recently moved above 5% and the USD remains firm. Higher yields and expectations of tighter monetary policy continue to create headwinds for non-yielding Gold.
The bigger catalyst, however, will be Fed forward guidance rather than the rate decision itself. With the hike largely priced in, a hawkish Fed — particularly signals that rates may remain higher for longer — could strengthen USD/yields and pressure Gold back toward the lower channel. Conversely, a less-hawkish message could trigger a stronger short-covering rebound.
Technically, the immediate resistance is around 4,340–4,360, where the rebound meets the descending trendline and the marked Demand zone. If Gold reaches this area and fails to break through, sellers could regain control and target 4,260–4,280, followed by the major 4,230–4,240 Supply zone.
Bearish Scenario — Preferred Bias
If Gold rebounds into 4,340–4,360 but remains below the descending trendline, the recovery can be treated as a corrective move. A rejection here could send price back toward 4,280, with a break potentially extending toward 4,230–4,240.
Bullish Scenario
A confirmed H4 breakout above 4,340–4,360 and the descending trendline would weaken the bearish structure. In that case, Gold could recover toward 4,390–4,420, with 4,450 as the next resistance.
At this stage, Lucas does not favor chasing the current rebound. The better confirmation is either a rejection from the trendline to follow the bearish flow, or a clean H4 breakout above the trendline before considering that sellers are losing control.
KEY LEVELS:
🔴 4,340–4,360 — Demand + descending trendline resistance
🔴 4,390–4,420 — Next recovery resistance
🟢 4,260–4,280 — Lower-channel target
🟢 4,230–4,240 — Major Supply
BIAS: BEARISH — WAIT FOR THE TRENDLINE REJECTION OR CONFIRMED BREAKOUT.  Short
Short
CNXPHARMA: Massive Box Consolidation and Explosive Macro Breakou1. The Macro Perspective: The Digestion Box
I am taking a LONG bias on the Nifty Pharma Index (CNXPHARMA) on the weekly (1W) timeframe.
When analyzing a healthy, sustainable macro trend, we want to see the market take time to digest its massive gains, especially as it approaches historical supply. Look at the structure on this chart. After a massive secular run, the index established a heavy historical ceiling directly at the 23,661.00 level. What followed was a deep correction, followed by a methodical recovery. However, instead of immediately trying to break the high (which often leads to a failed breakout), the index did the healthiest thing possible: it built a massive consolidation box (highlighted in green).
2. The Educational Setup: Consolidating at the Highs
The absolute best risk-to-reward setups occur when an asset consolidates just below major resistance.
The Pressure Cooker: For months, the index chopped sideways inside this wide accumulation box, violently shaking out impatient retail traders. By consistently holding the bottom of this box and pressing up against the dashed midline near 22,996.05, it stored immense kinetic energy.
Absorbing Supply: This prolonged sideways action directly under the ultimate 23,661.00 resistance is the ultimate footprint of institutional accumulation. They were willingly absorbing shares at premium prices, refusing to let the index enter a markdown phase.
3. Current Price Action: Blue Sky Territory
Look at the most recent weekly candle on the far right. After perfectly respecting the bounds of its accumulation base, the stored energy has been unleashed. Buyers have effortlessly shattered the ultimate 23,661.00 macro resistance, and the index is surging past 24,100. By clearing this final historical ceiling, Nifty Pharma has officially entered "Blue Sky Territory" (pure price discovery). There is zero historical overhead supply left to act as resistance.
4. The Trade Plan: Entries, Targets, and Risk Management
Entry Strategy: Momentum is exceptionally strong right now near 24,110.30. Chasing a massive weekly expansion candle always carries a higher risk of immediate drawdown. The highest-probability, lowest-risk entry involves stepping down to a daily timeframe and placing limit orders to catch a potential minor structural pullback to retest the 23,600.00 to 23,700.00 breakout zone. Letting that ultimate resistance prove itself as a new, indestructible support floor offers a phenomenal risk-to-reward ratio.
Take Profit (Targets): Because the index is in pure price discovery, we use measured structural targets. By taking the height of the green consolidation box (roughly 1,600 points from the ~21,400 base to the 23,000 top) and projecting it upward from the breakout line, our primary macro extension target sits comfortably in the 25,200.00 to 25,300.00 zone. Immediate psychological milestones are 24,500.00 and 25,000.00.
Invalidation (Stop Loss): A trade thesis is only valid if the new market structure holds. A hard stop loss should be placed safely below the top of the previous consolidation box and recent weekly pivot, around the 22,800.00 to 23,000.00 level. A definitive weekly close completely back below the 23,661.00 line would act as an early warning sign of a failed macro breakout (a "bull trap").
5. Time Horizon:
Because this technical setup is built on a 1-Week chart capturing a massive structural continuation into fresh price discovery, this is a medium-to-longer-term position outlook designed to play out over the coming weeks to months. Let the macro trend run!  Long
Long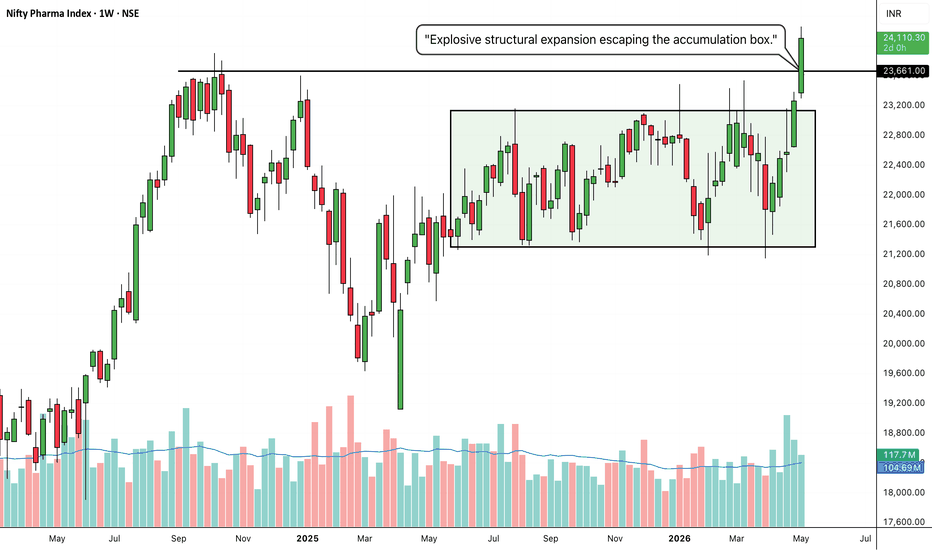
NIFTY_HEALTHCARE: The Macro Staircase and Explosive Blue Sky Bre1. The Macro Perspective: The Deep Washout and Recovery
I am taking a LONG bias on the Nifty Healthcare Index (NIFTY_HEALTHCARE) on the weekly (1W) timeframe.
When analyzing pure market structure on a macro timeframe, patience reveals the absolute highest probability setups. Looking back at the chart, the index suffered a brutal, highly volatile markdown phase that successfully washed out all the weak hands, dragging the price down to establish a concrete floor at 12,701.60. However, instead of bleeding into a secular bear market, the index initiated a methodical, multi-month process of accumulation. It carved out a massive, wide-ranging base, slowly absorbing overhead supply and grinding its way back up the chart.
2. The Educational Setup: Conquering the Stepping Stones
To understand the sheer strength of this current breakout, look at how the price systematically dismantled historical resistance on the right side of the curve by building a "Staircase" or "Step-Up Bases":
The Mid-Level Base (14,061.85): The index first had to conquer the major mid-level pivot at 14,061.85. Notice how once it broke above this line, it chopped sideways, perfectly testing it from above and flipping it into a rock-solid support floor.
The High-Level Consolidation: As the index approached the ultimate macro ceiling at 15,033.20, it naturally faced selling pressure. But notice the weekly candlesticks—buyers refused to let the index collapse back to the lower base. They formed a tight, high-level consolidation right under the resistance line (using the 14,061.85 floor as their ultimate defense), willingly absorbing shares at premium prices.
3. Current Price Action: Blue Sky Territory
Look at the most recent weekly candle on the far right. The pressure cooker has finally exploded. Buyers have effortlessly shattered the 15,033.20 macro resistance, printing a massive, full-bodied green expansion candle. By clearing this final historical ceiling, the Nifty Healthcare index has officially entered "Blue Sky Territory" (pure price discovery). There is absolutely zero historical overhead supply left. Every single investor who has bought and held this index is now in profit, meaning natural selling pressure evaporates.
4. The Trade Plan: Entries, Targets, and Risk Management
Entry Strategy: Momentum is exceptionally strong right now near 15,365.05. Chasing a massive weekly expansion candle always carries a higher risk of immediate intraday drawdown. The highest-probability, lowest-risk entry involves stepping down to a daily timeframe and placing limit orders to catch a potential minor structural pullback to retest the 15,000.00 to 15,100.00 breakout zone. Letting that ultimate resistance prove itself as a new, indestructible support floor offers a phenomenal risk-to-reward ratio.
Take Profit (Targets): Because the index is in pure price discovery, we use measured structural targets. By taking the depth of the massive macro recovery (roughly 2,300 points from the 12,701 floor to the 15,033 ceiling) and projecting it upward from the breakout line, our primary macro extension target sits comfortably in the 17,300.00 to 17,400.00 zone. Immediate psychological milestones are 16,000.00 and 16,500.00.
Invalidation (Stop Loss): A trade thesis is only valid if the new market structure holds. A hard stop loss should be placed safely below the breakout zone and recent structural pivot, around the 14,500.00 level. A definitive weekly close completely back below the 14,061.85 stepping stone would act as an early warning sign of a failed macro breakout and severe structural weakness.
5. Time Horizon:
Because this technical setup is built on a 1-Week chart capturing a massive structural completion into fresh price discovery, this is a medium-to-longer-term position outlook designed to play out over the coming weeks to months. Let the macro trend run!  Long
Long
EURUSD: The Pressure Is Building — A Bigger Drop Could Be NextEURUSD is still trading with a clear bearish bias , supported by both the current macro environment and the technical structure on the H1 chart.
From a macro perspective, the U.S. dollar continues to have the advantage. Markets are pricing a high probability of a 25-basis-point Fed rate hike , while elevated U.S. Treasury yields continue to support the dollar. EURUSD has consequently remained under pressure ahead of the Fed decision. The ECB’s recent tightening provides some support for the euro, but in the short term, Fed expectations and U.S. yields remain the stronger drivers for this pair.
Technically, the picture is particularly interesting. Following the strong sell-off, EURUSD has formed what looks like a symmetrical triangle on the H1 timeframe , with price becoming increasingly compressed between descending resistance and rising support. Because this pattern is developing after a strong bearish move , I see it more as a potential continuation structure than an early signal of reversal. Price also remains below the Ichimoku Cloud, reinforcing the broader bearish trend.
The key now is the lower boundary of the triangle. If EURUSD produces a clean bearish breakout , the compression could release into another strong selling wave, with the 1.1490 area becoming the next downside target. Until price breaks above the triangle and successfully reclaims the Ichimoku resistance, I continue to favor SELL opportunities and expect the broader downtrend to remain in control . Breakout Entry with Stop-Loss Below Swing LowEntering on a breakout past resistance with a Stop-Loss (SL) placed below the most recent handle swing low is a textbook risk-management strategy for Volatility Contraction Patterns (VCP).
Technical Evaluation of the Setup
Valid Contraction Mechanics (VCP): As annotated on image_65b662.png, the contractions tighten cleanly from **-20.97%** to **-15.32%**, **-11.65%**, and finally **-6.83%**. This progressive decay in depth confirms that overhead selling pressure is drying up systematically.
High Risk/Reward Ratio (R:R): Using the final **-6.83%** swing low (~₹4,500–4,520) as your stop-loss provides a tight risk anchor. This keeps your capital exposure minimal while positioning you for an expansion toward historical highs and beyond.
RS Line Holding Upper Bounds: The Relative Strength line in the lower window remains steady in positive green territory, confirming sustained market outperformance throughout this multi-month base building.
Key Execution Parameters
Breakout Entry Trigger: Daily close above **₹4,950–5,000** on expanding volume (confirming a clean clearing of the "Weak High").
Stop-Loss (SL): Daily close below **₹4,500** (just beneath the -6.83% handle low).
Initial Risk Distance: ~7–8% from breakout level.
Target 1: ₹5,400 (Measured Move of the Final Base)
Target 2: ₹5,800–6,000 (Macro Stage 2 Trend Continuation)
Verdict
It is a well-planned structure. The depth contraction symmetry is very clear, and anchoring your stop-loss to the -6.83% pivot point gives the trade a logical invalidation level without risking unnecessary downside.
Disclaimer: Educational purpose only. Not a recommendation to buy or sell securities. Please manage risk appropriately.  Long
Long
XAU/USD GOLD 1H — LIQUIDITY SWEEP DONE, IS THE NEXT BREAKOUT ?📊 Technical Analysis
Gold is showing a potential bullish reversal setup on the 1H chart after sweeping liquidity beneath the recent lows. Price has reclaimed the Key Level and is currently trading around 4,335.
🟢 Liquidity Sweep: Price dipped into the support area around 4,250, potentially clearing sell-side liquidity before bouncing.
🟡 Key Level: The 4,300–4,315 area is important. Holding above this zone would support the bullish scenario.
💎 Support Zone: Around 4,250–4,265. A sustained defense here keeps the reversal structure intact.
🚀 Bullish Target: 4,378–4,380, near the marked resistance/target area.
🔴 Invalidation: A decisive move below 4,232 would weaken this bullish setup.
🎯 Potential Scenario
Liquidity Sweep → Reclaim Key Level → Bullish continuation → Target 4,378–4,380
⚠️ This is a technical scenario, not a guarantee. Watch how price reacts around the key level and support zone before entering.
🔥 Catchy TradingView Title
🚀 GOLD LIQUIDITY SWEEP COMPLETE! 🔥 Bulls Eye 4,380 Next? 🐂💰 Long 
 Long
Long
Long