Chennai Petroleum Corporation Ltd - Breakout Setup, Move is ON..#CHENNPETRO trading above Resistance of 1521
Next Resistance is at 2509
Support is at 1144
Here is previous chart:
This weekly chart for Chennai Petroleum Corporation Limited displays a strong bullish breakout from a consolidation pattern, supported by significant volume and long-term trendline context.
Chart Overview
Timeframe & Asset: Chennai Petroleum Corporation Limited (1-Week Chart, NSE).
Current Price: 1,572.90 INR (+8.31% change shown on the chart header).
Key Technical Observations
Horizontal & Channel Breakout: The stock consolidated within a downward-sloping mini-channel (white lines) and horizontal consolidation zone before breaking out above 845.00 INR, marked by the yellow Breakout arrow.
Volume Expansion: The blue arrow highlights a substantial surge in trading volume during the initial breakout phase, confirming strong institutional buying conviction.
Support Levels:
845.00 INR (Yellow Line): The horizontal level corresponding to the initial breakout point and dynamic base support.
1,144.00 INR (Red Line): A major horizontal level (marked with a red arrow) that previously acted as resistance before flipping to become the primary structural support level on subsequent pullbacks.
Resistance Levels:
Resistance 1 (1,521.00 INR): A structural resistance level (green line) that the current price candle has tested and breached to trade at 1,572.90 INR.
Resistance 2 (2,509.00 INR): The long-term upside projection level marked near the top green line.
Long-Term Trend Lines: The solid blue lines form a multi-year ascending channel that defines the macro uptrend, with the price currently advancing along the upper expansion zone above this channel.
Conclusion & Current Price Action
The current price action reflects strong bullish momentum following the volume-backed breakout above 845.00 INR and a successful retest of the 1,144.00 INR support zone. The stock has recently cleared its immediate hurdle at Resistance 1 (1,521.00 INR).
A sustained weekly close above this Resistance 1 zone indicates room for extended upside toward the long-term upside projection level of 2,509.00 INR (Resistance 2). On any potential pullbacks, the 1,144.00 INR level will serve as the primary line of defense for buyers to keep the structural uptrend intact.
A parallel channel (also known as an ascending, descending, or horizontal channel) is a technical analysis pattern bounded by two parallel trendlines that encompass a security’s price action over time.
Structure & Mechanics
Main Components:
Trendline / Base Line: Connects a series of prominent reaction lows (in an uptrend) or reaction highs (in a downtrend).
Channel Line: Drawn parallel to the trendline, connecting the peaks (top boundary) or troughs (bottom boundary).
Price Movement: Price oscillates between the upper boundary (which acts as dynamic resistance) and the lower boundary (which acts as dynamic support).
Types of Channels
Ascending Channel (Bullish): Characterized by higher highs and higher lows. Indicates a steady uptrend where buying pressure dominates.
Descending Channel (Bearish): Characterized by lower highs and lower lows. Represents a controlled downtrend or corrective pullback.
Horizontal Channel (Consolidation): Moving sideways between static support and resistance lines, signaling market indecision or range-bound trading.
How Traders Use Parallel Channels
Trading Within the Range: Buying near the channel's lower boundary (support) and selling or shorting near the upper boundary (resistance).
Breakout Trading: A strong, high-volume candle breaking outside either boundary signals potential trend acceleration or continuation in the direction of the breakout (as seen in the charts provided previously).
Midline (50% Line): Often, a dashed line is drawn down the middle of the channel. Price reacting to this midline can confirm the channel's validity and act as interim support or resistance.
Disclaimer: This is for demonstration and educational purpose only. This is not buying or selling recommendations. I am not SEBI registered financial advisor. Please consult your financial advisor before taking any trade.  Long
Long
ARVIND: Massive Macro Squeeze and Explosive Trendline Breakout1. The Macro Perspective: The Floor and The Lid
I am taking a LONG bias on Arvind Limited (ARVIND) on the weekly (1W) timeframe.
When analyzing pure market structure, some of the most powerful moves come from prolonged periods of sideways consolidation. Look at the massive structural development on this chart. After a volatile period, the stock established an absolute concrete support floor at the solid black 290.60 line. However, every time buyers tried to push the price higher, sellers aggressively stepped in at lower and lower prices, creating the heavy descending trendline (the lid).
2. The Educational Setup: The Volatility Squeeze
To understand the sheer strength of this current breakout, look at how the price action compressed into an apex on the right side of the curve:
The Symmetrical Triangle: The stock was perfectly trapped between aggressive dip-buyers (forming the steep ascending trendline of higher lows) and motivated sellers (forming the descending trendline of lower highs).
The Pressure Cooker: This tightening geometric structure is the ultimate definition of volatility contraction. As the price gets squeezed into the apex of the triangle, it acts like a tightly coiled spring. It forces early buyers to hold through chop and frustrates short-sellers, storing immense kinetic energy for the inevitable expansion.
3. Current Price Action: The Spring Uncoils
Look at the most recent weekly candle on the far right. The pressure cooker has absolutely exploded. In a violent display of momentum, buyers have effortlessly shattered the descending trendline and sliced straight through the dashed 393.60 horizontal pivot. By clearing this massive structural squeeze with such a full-bodied green expansion candle, ARVIND has officially confirmed a macro trend reversal and initiated a brand-new markup phase.
4. The Trade Plan: Entries, Targets, and Risk Management
Entry Strategy: Momentum is exceptionally strong right now as the stock surges past 430.00. Chasing a massive, near-vertical weekly expansion candle out of a squeeze always carries a higher risk of an immediate intraday drawdown. The highest-probability, lowest-risk entry involves stepping down to a daily timeframe and placing limit orders to catch a potential minor structural pullback to retest the 395.00 to 405.00 breakout zone (the apex of the triangle). Letting that broken trendline prove itself as new support offers a phenomenal risk-to-reward ratio.
Take Profit (Targets): We can find a measured technical target by taking the widest part of the triangle's base (roughly 150 points from the 290.60 floor to the initial ~440 peak) and projecting it upward from the breakout point. Our primary macro extension target sits comfortably in the 540.00 to 550.00 zone. Immediate psychological milestones are 475.00 and 500.00.
Invalidation (Stop Loss): A trade thesis is only valid if the new market structure holds. A hard stop loss should be placed safely below the breakout zone and the steep ascending trendline, around the 360.00 to 370.00 level. A definitive weekly close completely back inside the triangle and below the 393.60 line would act as a massive warning sign of a failed macro breakout (a "bull trap").
5. Time Horizon:
Because this technical setup is built on a 1-Week chart capturing a massive structural squeeze and momentum thrust, this is a medium-to-longer-term position trade designed to capture the explosive markup phase. Let the new trend run!  Long
Long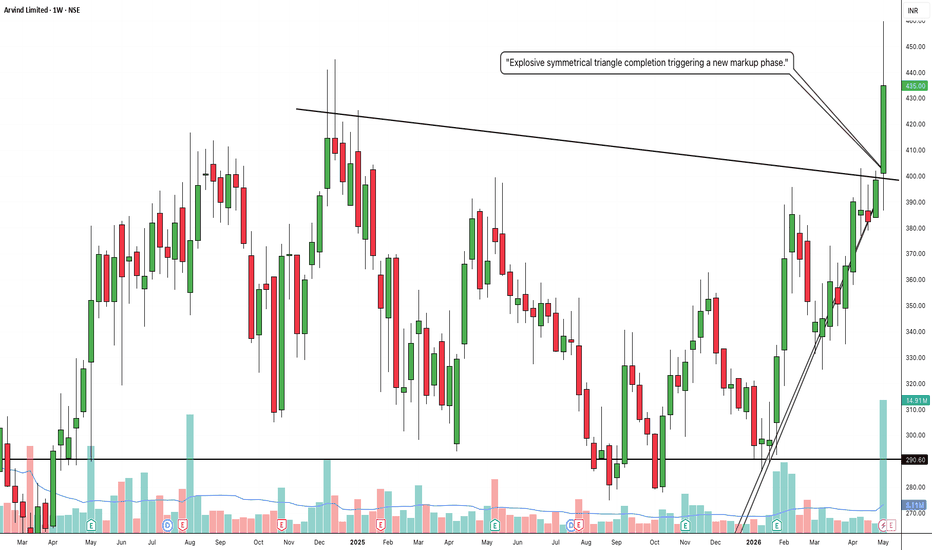
BBOX: Massive Multi-Level Breakout and Rounding Bottom Completio1. The Macro Perspective: The Deep Washout and Recovery
I am taking a LONG bias on Black Box Limited (BBOX) on the weekly (1W) timeframe.
When analyzing pure market structure, patience reveals the absolute highest probability setups. Look at the massive structural development on this chart. After a powerful prior run, the stock established a heavy historical ceiling directly at the 706.65 level. What followed was a brutal, highly volatile markdown phase that successfully washed out all the weak hands, dragging the price all the way down into the 300 zone. However, instead of bleeding into a secular bear market, the stock initiated a methodical, multi-month process of accumulation. It carved out a massive "Rounding Bottom," slowly absorbing overhead supply and systematically grinding its way back up the chart.
2. The Educational Setup: The Pressure Cooker Mid-Base
To understand the sheer strength of this current breakout, look at how the price systematically dismantled historical resistance on the right side of the curve:
The Digestion Phase: The stock didn't just V-shape recover directly to the highs. It rallied to the dashed 585.15 mid-level pivot and paused.
The High-Level Base: Notice how the stock spent nearly a year chopping sideways underneath this 585.15 line, establishing a higher floor in the 440-460 zone. Consolidating tightly for months directly underneath major structural resistance acts like a pressure cooker. It transfers shares from impatient retail bag-holders to strong-handed institutional buyers, storing immense kinetic energy before the next explosive leg higher.
3. Current Price Action: Blue Sky Territory
Look at the most recent weekly candles on the far right, accompanied by a massive surge in buying volume. The pressure cooker has absolutely exploded. In a violent display of momentum, buyers have effortlessly shattered the 585.15 mid-level resistance and the ultimate 706.65 macro ceiling in rapid succession. By clearing this final historical accumulation zone, BBOX has officially entered "Blue Sky Territory" (pure price discovery). There is absolutely zero historical overhead supply left. Every single investor who has bought and held this stock is now in profit, meaning natural selling pressure evaporates.
4. The Trade Plan: Entries, Targets, and Risk Management
Entry Strategy: Momentum is exceptionally strong right now near 748.40. Chasing massive, near-vertical weekly expansion candles always carries a higher risk of an immediate intraday drawdown. The highest-probability, lowest-risk entry involves stepping down to a daily timeframe and placing limit orders to catch a potential minor structural pullback to retest the 700.00 to 710.00 breakout zone. Letting that old heavy macro resistance prove itself as a new, indestructible support floor offers a phenomenal risk-to-reward ratio.
Take Profit (Targets): Because the stock is in pure price discovery, we use measured structural targets. By taking the depth of the massive macro recovery (roughly 400 points from the ~300 base to the 706.65 neckline) and projecting it upward from the breakout line, our primary macro extension target sits comfortably in the 1,100.00 to 1,110.00 zone. Immediate psychological milestones are 900.00 and 1,000.00.
Invalidation (Stop Loss): A trade thesis is only valid if the new market structure holds. A hard stop loss should be placed safely below the breakout zone and within the body of the previous week's momentum thrust, around the 620.00 to 640.00 level. A definitive weekly close completely back below the 585.15 dashed line would act as a massive warning sign of a failed macro breakout and severe structural weakness.
5. Time Horizon:
Because this technical setup is built on a 1-Week chart capturing a massive structural completion into fresh price discovery, this is a medium-to-longer-term position trade designed to play out over the coming weeks to months. Let the macro trend run!  Long
Long
 Long
Long
 Long
Long
 Long
Long
 Long
Long
 Long
Long
 Long
Long
 Long
Long
HAPPYFORGE: The Macro Staircase and Explosive Blue Sky Breakout1. The Macro Perspective: The Deep Washout and Bottom Accumulation
I am taking a LONG bias on Happy Forgings Limited (HAPPYFORGE) on the weekly (1W) timeframe.
When analyzing pure market structure, patience reveals the absolute highest probability setups. Looking at the macro picture, this stock suffered a brutal, highly volatile markdown phase that successfully washed out all the weak hands, dragging the price all the way down into the 800 zone. However, instead of bleeding into a secular bear market, the stock initiated a methodical, multi-month process of accumulation. It carved out a massive "Rounding Bottom," slowly absorbing overhead supply and systematically grinding its way back up the chart.
2. The Educational Setup: Conquering the Stepping Stones
To understand the sheer strength of this current breakout, look at how the price systematically dismantled historical resistance on the right side of the curve by building a "Staircase":
The Foundation: The stock first established a concrete floor at the solid black 1,000.45 level. Notice the massive accumulation volume cluster that occurred right as it conquered this psychological century mark.
The High-Level Base (The Handle): The stock then rallied into the heavy 1,369.95 historical resistance zone. Instead of suffering a deep rejection, buyers refused to let the structure break down. They chopped sideways, establishing a mid-level pivot at the dashed 1,241.50 line and a higher floor at 1,287.55. Consolidating tightly directly underneath major resistance acts like a pressure cooker, willingly absorbing shares at premium prices and storing immense kinetic energy.
3. Current Price Action: Blue Sky Territory
Look at the most recent weekly candle on the far right. The pressure cooker has finally exploded. Buyers have effortlessly shattered the 1,369.95 macro ceiling, printing a massive, full-bodied green expansion candle and surging into the 1,440s. By clearing this final historical accumulation zone, HAPPYFORGE has officially entered "Blue Sky Territory" (pure price discovery). There is absolutely zero historical overhead supply left. Every single investor who has bought and held this stock is now in profit, meaning natural selling pressure evaporates.
4. The Trade Plan: Entries, Targets, and Risk Management
Entry Strategy: Momentum is exceptionally strong right now near 1,443.60. Chasing a massive weekly expansion candle always carries a higher risk of an immediate intraday drawdown. The highest-probability, lowest-risk entry involves stepping down to a daily timeframe and placing limit orders to catch a potential minor structural pullback to retest the 1,370.00 to 1,380.00 breakout zone. Letting that old heavy resistance prove itself as a new, indestructible support floor offers a phenomenal risk-to-reward ratio.
Take Profit (Targets): Because the stock is in pure price discovery, we use measured structural targets. By taking the depth of the massive macro recovery (roughly 570 points from the ~800 base to the 1,369.95 neckline) and projecting it upward from the breakout line, our primary macro extension target sits comfortably in the 1,900.00 to 1,940.00 zone. Immediate psychological milestones are 1,600.00 and 1,750.00.
Invalidation (Stop Loss): A trade thesis is only valid if the new market structure holds. A hard stop loss should be placed safely below the recent dashed pivot line and accumulation floor, around the 1,200.00 to 1,220.00 level. A definitive weekly close completely back below the 1,287.55 line would act as an early warning sign of a failed macro breakout and severe structural weakness.
5. Time Horizon:
Because this technical setup is built on a 1-Week chart capturing a massive structural completion into fresh price discovery, this is a medium-to-longer-term position trade designed to play out over the coming weeks to months. Let the macro trend run!  Long
Long
PRIVISCL: The Macro Staircase and Explosive Blue Sky Breakout1. The Macro Perspective: Building the Staircase
I am taking a LONG bias on Privi Speciality Chemicals Limited (PRIVISCL) on the weekly (1W) timeframe.
When analyzing pure market structure in a powerful secular uptrend, we look for assets that prove their strength by digesting gains methodically. Stocks cannot go up in a straight line forever. Look at the massive structural development on the left side of this chart. After every major impulse leg, the stock paused and established a concrete floor. It built a rock-solid foundation at 2,213.85, exploded higher, and then did the exact same thing to establish the 2,587.70 level as its next major stepping stone. This is the ultimate footprint of institutional accumulation.
2. The Educational Setup: The Pressure Cooker Base
To understand the sheer strength of this current breakout, look at how the price behaved after hitting the ultimate 3,449.50 resistance line:
The High-Level Consolidation: Instead of suffering a deep, trend-ending correction, the stock used the 2,587.70 line as its ultimate structural defense. It chopped sideways in a massive, highly volatile range for months.
The Higher Low Launchpad: Notice how the stock refused to revisit the bottom of that base recently. Buyers stepped in aggressively at the dashed 2,785.45 pivot line, establishing a massive macro higher low. Consolidating in the upper half of a macro base acts like a pressure cooker, squeezing short-sellers and transferring shares to strong hands right beneath major resistance.
3. Current Price Action: Blue Sky Territory
Look at the most recent weekly candles on the far right. The pressure cooker has finally exploded. Buyers have effortlessly shattered the 3,449.50 macro ceiling, printing a massive, full-bodied green expansion candle. By clearing this final historical accumulation zone, PRIVISCL has officially entered "Blue Sky Territory" (pure price discovery). There is absolutely zero historical overhead supply left. Every single investor who has bought and held this stock is now in profit, meaning natural selling pressure evaporates.
4. The Trade Plan: Entries, Targets, and Risk Management
Entry Strategy: Momentum is exceptionally strong right now near 3,487.90. Chasing a massive weekly expansion candle always carries a higher risk of an immediate intraday drawdown. The highest-probability, lowest-risk entry involves stepping down to a daily timeframe and placing limit orders to catch a potential minor structural pullback to retest the 3,400.00 to 3,450.00 breakout zone. Letting that old heavy resistance prove itself as a new, indestructible support floor offers a phenomenal risk-to-reward ratio.
Take Profit (Targets): Because the stock is in pure price discovery, we use measured structural targets. By taking the depth of the recent macro base (roughly 860 points from the 2,587.70 floor to the 3,449.50 ceiling) and projecting it upward from the breakout line, our primary structural target sits comfortably in the 4,300.00 to 4,310.00 macro extension zone. Immediate psychological milestones are 3,800.00 and 4,000.00.
Invalidation (Stop Loss): A trade thesis is only valid if the new market structure holds. A hard stop loss should be placed safely below the recent weekly accumulation cluster and the dashed pivot line, around the 2,750.00 to 2,800.00 level. A definitive weekly close completely back below the 3,000 mark would act as an early warning sign of a failed macro breakout (a "bull trap").
5. Time Horizon:
Because this technical setup is built on a 1-Week chart capturing a massive structural completion into fresh price discovery, this is a medium-to-longer-term position trade designed to play out over the coming weeks to months. Let the macro trend run!  Long
Long
INGERRAND: Explosive Dual-Breakout and Macro Trend Reversal1. The Macro Perspective: The Squeeze and the Washout
I am taking a LONG bias on Ingersoll-Rand (India) Limited (INGERRAND) on the weekly (1W) timeframe.
When analyzing pure market structure, we want to look for areas where descending supply finally meets overwhelming demand. Look at the macro structure on this chart. For a prolonged period, the stock was trapped in a volatile markdown phase, consistently capped by a heavy descending trendline. Every time the stock tried to rally, sellers stepped in at a lower high, squeezing the price downward and washing out weak hands deep into the 3,000 zone. However, instead of collapsing into a permanent bear market, the stock found an absolute floor and began a volatile, but aggressive, process of bottom accumulation.
2. The Educational Setup: The Power of the Dual-Breakout
To understand the sheer strength of this current move, look at how the price attacked historical resistance on the right side of the curve:
The Diagonal Break: First, the stock generated enough kinetic energy to finally shatter the long-term descending trendline. Breaking a diagonal lid is the first major signal of a macro trend reversal, catching early short-sellers off guard.
The Horizontal Boss: Often, stocks will break a trendline only to fail at the next major horizontal resistance. Not this time. INGERRAND used the momentum from the trendline break to launch a direct assault on the ultimate solid black 4,235.50 horizontal ceiling.
3. Current Price Action: Blue Sky Territory
Look at the most recent weekly candle on the far right. The pressure cooker has completely exploded. Buyers have effortlessly shattered the 4,235.50 macro resistance, printing a massive, full-bodied green expansion candle and surging toward 4,600. By clearing both of these major resistance structures simultaneously, the stock has officially confirmed a macro trend reversal and entered "Blue Sky Territory" (pure price discovery). Historical overhead supply has been eliminated.
4. The Trade Plan: Entries, Targets, and Risk Management
Entry Strategy: Momentum is exceptionally strong right now near 4,575.30. Chasing a massive weekly expansion candle always carries a higher risk of immediate intraday drawdown. The highest-probability, lowest-risk entry involves stepping down to a daily timeframe and placing limit orders to catch a potential minor structural pullback to retest the 4,200.00 to 4,300.00 breakout zone. Letting that old heavy resistance prove itself as a new, indestructible support floor offers a phenomenal risk-to-reward ratio.
Take Profit (Targets): Because the stock is in pure price discovery, we use measured structural targets. By taking the depth of the massive macro accumulation base (roughly 1,200+ points from the ~3,000 lows to the 4,235.50 neckline) and projecting it upward from the breakout line, our primary macro extension target sits comfortably in the 5,400.00 to 5,500.00 zone. Immediate psychological milestones are 4,800.00 and 5,000.00.
Invalidation (Stop Loss): A trade thesis is only valid if the new market structure holds. A hard stop loss should be placed safely below the breakout zone and the recent structural pivot, around the 3,850.00 to 3,950.00 level. A definitive weekly close completely back below the 4,235.50 horizontal line and back inside the descending trendline would act as an early warning sign of a failed macro breakout (a "bull trap").
5. Time Horizon:
Because this technical setup is built on a 1-Week chart capturing a massive structural reversal into fresh price discovery, this is a medium-to-longer-term position trade designed to play out over the coming weeks to months. Let the macro trend run!  Long
Long
CROMPTON: Textbook Trend Reversal and Explosive Bottom Breakout1. The Macro Perspective: The Deep Washout and Trend Shift
I am taking a LONG bias on Crompton Greaves Consumer Electricals Ltd. (CROMPTON) on the daily (1D) timeframe.
When analyzing pure market structure, identifying the exact moment a stock transitions from a bear market to a bull market offers the highest risk-to-reward setups possible. Looking at the left side of this chart, the stock suffered a brutal, highly volatile markdown phase. However, capitulation eventually set in. The stock established an absolute concrete floor down near the 221.63 level. Instead of continuing to bleed, it initiated a methodical, multi-month process of bottom accumulation, allowing heavy institutional capital to quietly absorb shares at a massive discount.
2. The Educational Setup: Building the Launchpad
To understand the sheer strength of this current breakout, look at how the price systematically built a reversal structure on the right side of the curve:
The Higher Lows: The most important rule of a trend reversal is the cessation of lower lows. After establishing the 221.63 floor, buyers aggressively stepped in at the 252.20 level, establishing a massive structural higher low and proving a shift in institutional intent.
The Accumulation Ceiling: For months, the stock was capped by the heavy solid black resistance line at 271.45. By forming a higher low and compressing tightly up against this neckline, the stock acted like a pressure cooker, transferring shares from impatient retail bag-holders to strong-handed buyers.
3. Current Price Action: The Reversal Confirmed
Look at the most recent daily candles on the far right. The pressure cooker has exploded. Buyers have effortlessly shattered the 271.45 resistance ceiling, printing powerful, consecutive green expansion candles and surging into the 290s. By decisively clearing this accumulation zone, CROMPTON has officially confirmed a macro trend reversal. The markdown phase is over; the markup phase has begun.
4. The Trade Plan: Entries, Targets, and Risk Management
Entry Strategy: Momentum is exceptionally strong right now near 293.30. Chasing a massive daily expansion always carries a higher risk of an immediate intraday pullback. The highest-probability, lowest-risk entry involves placing limit orders to catch a potential minor structural retest of the 271.00 to 275.00 breakout zone. Letting that old heavy resistance prove itself as a new, indestructible support floor offers a phenomenal risk-to-reward ratio.
Take Profit (Targets): Because the stock is systematically working its way back up the historical chart, our primary structural target is the massive red macro resistance line sitting clearly at 315.70. If momentum carries through that zone, the ultimate historical gap fill and secondary target sits in the 340.00 to 350.00 region.
Invalidation (Stop Loss): A trade thesis is only valid if the new market structure holds. A hard stop loss should be placed safely below the breakout line and the recent dashed mid-line pivot, around the 260.00 to 264.00 level. A definitive daily close completely back inside the old accumulation box and below the 252.20 structural floor would completely invalidate the reversal thesis.
5. Time Horizon:
Because this technical setup is built on a 1-Day chart capturing a massive structural phase transition and bottom breakout, this is a medium-term swing trade designed to capture the new markup phase. Let the new trend run!  Long
Long
Sansera Engineering Ltd - Breakout Setup, Move is ON...#SANSERA trading above Resistance of 4049
Next Resistance is at 5253
Support is at 3501
Here are previous charts:
This weekly chart for Sansera Engineering Limited displays a strong bullish breakout from a consolidation pattern, supported by significant volume and long-term trendline context.
Chart Overview
Timeframe & Asset: Sansera Engineering Limited (1-Week Chart, NSE).
Current Price: 4,129.90 INR (+9.18% change shown on the chart header).
Key Technical Observations
Horizontal & Channel Breakout: The stock consolidated within a multi-year ascending channel (blue lines) before breaking out above 1,875.00 INR, marked by the yellow Breakout arrow.
Volume Expansion: The blue arrows highlight substantial surges in trading volume during the initial breakout and subsequent acceleration phases, confirming strong institutional buying conviction.
Support Levels:
1,875.00 INR (Yellow Line): The horizontal level corresponding to the initial channel breakout point and dynamic base support.
2,852.00 INR (Green Line): An earlier structural resistance level that previously defined Resistance 1 before converting into dynamic support.
3,501.00 INR (Red Line): A major horizontal support level (marked with a red arrow) that has held firmly during recent pullbacks to serve as the primary structural support.
Resistance Levels:
Resistance 1 (2,852.00 INR): An earlier structural resistance level that has since been surpassed and converted into support.
Resistance 2 (4,049.00 INR): A structural resistance level (green line) that the current price candle has tested and breached to trade at 4,129.90 INR.
Resistance 3 (5,253.00 INR): The long-term upside projection level marked near the top green line.
Long-Term Trend Lines: The solid blue lines form a multi-year ascending channel that defines the macro uptrend, with the price currently advancing well above the channel upper boundary into a strong extension phase.
Conclusion & Current Price Action
The current price action reflects strong bullish momentum following the volume-backed breakout above 1,875.00 INR and a successful retest of the 3,501.00 INR support zone. The stock has recently cleared its immediate hurdle at Resistance 2 (4,049.00 INR).
A sustained weekly close above this Resistance 2 zone indicates room for extended upside toward the long-term upside projection level of 5,253.00 INR (Resistance 3). On any potential pullbacks, the 3,501.00 INR level will serve as the primary line of defense for buyers to keep the structural uptrend intact.
A parallel channel (also known as an ascending, descending, or horizontal channel) is a technical analysis pattern bounded by two parallel trendlines that encompass a security’s price action over time.
Structure & Mechanics
Main Components:
Trendline / Base Line: Connects a series of prominent reaction lows (in an uptrend) or reaction highs (in a downtrend).
Channel Line: Drawn parallel to the trendline, connecting the peaks (top boundary) or troughs (bottom boundary).
Price Movement: Price oscillates between the upper boundary (which acts as dynamic resistance) and the lower boundary (which acts as dynamic support).
Types of Channels
Ascending Channel (Bullish): Characterized by higher highs and higher lows. Indicates a steady uptrend where buying pressure dominates.
Descending Channel (Bearish): Characterized by lower highs and lower lows. Represents a controlled downtrend or corrective pullback.
Horizontal Channel (Consolidation): Moving sideways between static support and resistance lines, signaling market indecision or range-bound trading.
How Traders Use Parallel Channels
Trading Within the Range: Buying near the channel's lower boundary (support) and selling or shorting near the upper boundary (resistance).
Breakout Trading: A strong, high-volume candle breaking outside either boundary signals potential trend acceleration or continuation in the direction of the breakout (as seen in the charts provided previously).
Midline (50% Line): Often, a dashed line is drawn down the middle of the channel. Price reacting to this midline can confirm the channel's validity and act as interim support or resistance.
Disclaimer: This is for demonstration and educational purpose only. This is not buying or selling recommendations. I am not SEBI registered financial advisor. Please consult your financial advisor before taking any trade.  Long
Long
 Long
Long
BHARATFORG: Textbook Break & Retest of Macro Structure1. The Macro Perspective: The Great U-Turn
I am taking a LONG bias on Bharat Forge Ltd. (BHARATFORG) on the weekly (1W) timeframe.
When analyzing a chart, structural horizontal lines tell us the story of supply and demand. Looking at the macro picture, BHARATFORG established a major historical ceiling at the 1739.40 level before undergoing a massive, multi-month correction. However, the stock eventually carved out a beautiful rounding bottom, slowly absorbing overhead supply and grinding its way back up. It finally shattered that 1739.40 ceiling, but the real trading opportunity didn't happen on the breakout—it happened on the pullback.
2. The Educational Setup: Old Ceilings Become New Floors
The absolute best risk-to-reward setups occur when a stock retests its breakout level.
The Breakout: BHARATFORG recently smashed through the 1739.40 resistance, hitting a local high near the 2000 psychological level.
The Retest & Confluence: Instead of going straight up, the stock exhausted and pulled back for two weeks. To an amateur, this looks like weakness. To a structural trader, this is the trigger. The price perfectly dropped back down to tag the 1739.40 level from above. Even better, the 20-period Simple Moving Average (the blue middle Bollinger Band) rose up to meet the price at this exact same spot. This dual-layer of support (horizontal + dynamic) created an unbreakable launchpad.
3. Current Price Action: The Rejection of Lower Prices
Look at the most recent weekly candle currently trading near 1881.60. After tapping that confluence zone, buyers aggressively stepped in, leaving a lower wick and driving the price heavily into the green. This officially confirms that the old, heavy resistance ceiling has flipped into a rock-solid support floor. The market has accepted these higher valuations.
4. The Trade Plan: Entries, Targets, and Risk Management
Entry Strategy: Momentum traders can look for entries near the current market price (1881.60) to capture the confirmed continuation bounce. A slightly safer approach would be stepping down to a daily chart to catch any minor intraday pullbacks toward the 1800.00 to 1820.00 zone, keeping your entry as close to the moving average as possible.
Take Profit (Targets): With the stock successfully defending its macro breakout and entering fresh territory, the immediate psychological target is a retest of the 2000.00 milestone. If the macro trend sustains, the stock enters pure price discovery with 2100.00 and 2200.00 as the next logical macro extensions.
Invalidation (Stop Loss): The entire thesis relies on the 1739.40 level holding as support. A stop loss should be placed safely below the recent retest wick and the 20-SMA dynamic support, around the 1650.00 to 1680.00 level. A definitive weekly close back below the 1739.40 line would act as an early warning sign of a failed macro breakout (a "bull trap").
5. Time Horizon:
Because this technical setup is built on a 1-Week chart capturing a major structural transition and continuation, this is a medium-to-longer-term position trade designed to play out over the coming weeks to months.  Long
Long
CGPOWER: Zooming In – Daily Consolidation at the Macro Breakout1. The Micro Perspective: Zooming into the Breakout
I am taking a LONG bias on CG Power & Industrial Solutions Ltd (CGPOWER), stepping down to the daily (1D) timeframe to optimize our entry mechanics after analyzing the massive weekly macro breakout.
When analyzing pure market structure, a weekly breakout tells us the direction, but the daily chart gives us our timing. Looking at this daily chart, we can see the absolute precision of the "Staircase" recovery. The stock used the 742.85 line as a launchpad, rallied to the 795.60 line, chopped sideways to build a pressure cooker base, and then exploded higher to challenge the ultimate historical ceiling at the red 859.50 line.
2. The Educational Setup: The High-Level Flag
To understand the sheer strength of this current setup, look at how the price is behaving after hitting the red macro ceiling:
No Deep Rejection: When a stock hits an all-time high or major historical resistance, amateur traders expect a massive, immediate rejection as bag-holders sell. Notice how that didn't happen here.
The Digestion Phase: Instead of selling off, the stock broke through and is now printing very tight, small-bodied daily candles right on top of the 859.50 line. This is a textbook high-level consolidation or "Bull Flag." The stock is peacefully digesting the massive gains from the prior thrust, allowing the moving averages to catch up, and transferring shares from weak hands to strong institutional buyers without giving up any ground.
3. Current Price Action: Storing Kinetic Energy
Look at the most recent daily candles on the far right. The volume has naturally contracted during this sideways pause (visible on the bottom panel), which is exactly what you want to see during a healthy consolidation. The market has officially accepted these higher valuations. By refusing to let the price collapse back into the 795.60 base, the stock is storing immense kinetic energy for the next markup phase into pure price discovery.
4. The Trade Plan: Entries, Targets, and Risk Management
Entry Strategy: This is the "golden entry" zone. The highest-probability, lowest-risk entry involves stepping in right here as the stock flags around the 850.00 to 860.00 level. Letting that red macro resistance prove itself as a new, indestructible support floor offers a phenomenal risk-to-reward ratio before the next momentum expansion.
Take Profit (Targets): We use measured structural targets. For a shorter-term daily swing, taking the depth of the previous base (roughly 65 points from the 795.60 floor to the 859.50 ceiling) projects an immediate target in the 920.00 to 925.00 zone. The larger macro target (from our weekly chart analysis) remains at the 1,175.00+ extension level. The 1,000.00 century mark will act as a major psychological magnet.
Invalidation (Stop Loss): A trade thesis is only valid if the market structure holds. A hard stop loss should be placed safely below the current daily flag and the recent momentum gap, around the 810.00 to 820.00 level. A definitive daily close completely back below the solid black 795.60 line would invalidate the immediate continuation thesis and signal a potential bull trap.
5. Time Horizon:
Because this technical setup is built on a 1-Day chart capturing a high-level consolidation flag after a major macro breakout, this is a short-to-medium-term swing trade designed to capture the imminent momentum continuation. Let the structure dictate the trend!  Long
Long
Sakar Healthcare Ltd - Breakout Setup, Move is ON...#SAKAR trading above Resistance of 1034
Next Resistance is at 1490
Support is at 866
Here are previous charts:
This weekly chart for Sakar Healthcare Ltd displays a strong bullish breakout from a consolidation pattern, supported by significant volume and long-term trendline context.
Chart Overview
Timeframe & Asset: Sakar Healthcare Ltd (1-Week Chart, NSE).
Current Price: 1,158.60 INR (+14.27% change shown on the chart header).
Key Technical Observations
Horizontal & Channel Breakout: The stock consolidated within a long-term range bounded by a multi-year ascending channel (blue lines) before breaking out above 512.00 INR, marked by the yellow Breakout arrow.
Volume Expansion: The blue arrow highlights a substantial surge in trading volume during the initial breakout and subsequent expansion phases, confirming strong institutional buying conviction.
Support Levels:
512.00 INR (Yellow Line): The horizontal level corresponding to the initial breakout point and dynamic base support.
757.00 INR (Green Line): A structural resistance level that previously defined Resistance 1 before acting as intermediate support.
866.00 INR (Red Line): A major horizontal level (marked with a red arrow) that has served as the primary structural support level on recent pullbacks.
Resistance Levels:
Resistance 1 (757.00 INR): An earlier structural resistance level that has since been surpassed and converted into support.
Resistance 2 (1,034.00 INR): A structural resistance level (green line) that the current price candle has tested and breached to trade at 1,158.60 INR.
Resistance 3 (1,490.00 INR): The long-term upside projection level marked near the top green line.
Long-Term Trend Lines: The solid blue lines form a multi-year ascending channel that defines the macro uptrend, with the price currently advancing along the upper expansion zone above this channel.
Conclusion & Current Price Action
The current price action reflects strong bullish momentum following the volume-backed breakout above 512.00 INR and a successful retest of the 866.00 INR support zone. The stock has recently cleared its immediate hurdle at Resistance 2 (1,034.00 INR).
A sustained weekly close above this Resistance 2 zone indicates room for extended upside toward the long-term upside projection level of 1,490.00 INR (Resistance 3). On any potential pullbacks, the 866.00 INR level will serve as the primary line of defense for buyers to keep the structural uptrend intact.
A parallel channel (also known as an ascending, descending, or horizontal channel) is a technical analysis pattern bounded by two parallel trendlines that encompass a security’s price action over time.
Structure & Mechanics
Main Components:
Trendline / Base Line: Connects a series of prominent reaction lows (in an uptrend) or reaction highs (in a downtrend).
Channel Line: Drawn parallel to the trendline, connecting the peaks (top boundary) or troughs (bottom boundary).
Price Movement: Price oscillates between the upper boundary (which acts as dynamic resistance) and the lower boundary (which acts as dynamic support).
Types of Channels
Ascending Channel (Bullish): Characterized by higher highs and higher lows. Indicates a steady uptrend where buying pressure dominates.
Descending Channel (Bearish): Characterized by lower highs and lower lows. Represents a controlled downtrend or corrective pullback.
Horizontal Channel (Consolidation): Moving sideways between static support and resistance lines, signaling market indecision or range-bound trading.
How Traders Use Parallel Channels
Trading Within the Range: Buying near the channel's lower boundary (support) and selling or shorting near the upper boundary (resistance).
Breakout Trading: A strong, high-volume candle breaking outside either boundary signals potential trend acceleration or continuation in the direction of the breakout (as seen in the charts provided previously).
Midline (50% Line): Often, a dashed line is drawn down the middle of the channel. Price reacting to this midline can confirm the channel's validity and act as interim support or resistance.
Disclaimer: This is for demonstration and educational purpose only. This is not buying or selling recommendations. I am not SEBI registered financial advisor. Please consult your financial advisor before taking any trade.  Long
Long
FINCABLES: The Macro Staircase and Explosive 1000 Level Breakout1. The Macro Perspective: The Deep Washout and Bottom Accumulation
I am taking a LONG bias on Finolex Cables Limited (FINCABLES) on the weekly (1W) timeframe.
When analyzing pure market structure, patience reveals the absolute highest probability setups. Looking at the macro picture, this stock suffered a brutal, highly volatile markdown phase after rejecting the ultimate historical ceiling at the red 1,654.00 line. This deep correction successfully washed out all the weak hands, dragging the price down to establish a concrete floor at 712.45. However, instead of bleeding into a secular bear market, the stock found its footing. For months, it chopped sideways at the bottom of the structure, allowing heavy institutional capital to quietly absorb shares at a massive discount and build a foundation.
2. The Educational Setup: Conquering the Stepping Stones
To understand the sheer strength of this current breakout, look at how the price systematically dismantled historical resistance on its way up by building a "Staircase":
The Lower Bases: The stock didn't just V-shape recover; it methodically climbed. Notice how it conquered the 794.70 level, established it as a floor, and then did the exact same thing at the 835.85 level.
The Century Mark Setup: Using those lower levels as its concrete foundation, the stock built a final "Step-Up Base" directly underneath the massive psychological and structural resistance zone at 1,000.65. Consolidating tightly under a major round number acts like a pressure cooker, transferring shares to strong hands and storing immense kinetic energy before the next leg higher.
3. Current Price Action: The Path to the Macro Highs
Look at the most recent weekly candle on the far right. The pressure cooker has exploded. Buyers have effortlessly shattered the 1,000.65 resistance, printing a massive, full-bodied green expansion candle and surging toward 1,100. By clearing this major step-up base and psychological barrier, FINCABLES has officially opened the door for a clean structural run back up the right side of the macro rounding bottom.
4. The Trade Plan: Entries, Targets, and Risk Management
Entry Strategy: Momentum is exceptionally strong right now near 1,093.95. Chasing a massive weekly expansion candle always carries a higher risk of immediate intraday drawdown. The highest-probability, lowest-risk entry involves stepping down to a daily timeframe and placing limit orders to catch a potential minor structural pullback to retest the 1,000.00 to 1,010.00 breakout zone. Letting that newly broken, major psychological ceiling prove itself as a new, indestructible support floor offers a phenomenal risk-to-reward ratio.
Take Profit (Targets): Because the stock is systematically working its way up the historical chart, our immediate structural target is the dashed pivot line at 1,420.40. Once cleared, the primary macro objective is a full retest of the ultimate historical red ceiling at 1,654.00.
Invalidation (Stop Loss): A trade thesis is only valid if the new market structure holds. A hard stop loss should be placed safely below the previous stepping stone and recent consolidation floor, around the 900.00 to 920.00 level. A definitive weekly close completely back below the 1,000.65 line would act as an early warning sign of a failed macro breakout and severe structural weakness.
5. Time Horizon:
Because this technical setup is built on a 1-Week chart capturing a massive structural completion and continuation from bottom accumulation, this is a medium-to-longer-term position outlook designed to play out over the coming weeks to months. Let the macro trend run!  Long
Long
LINDEINDIA: The Macro Staircase and Explosive Structural Breakou1. The Macro Perspective: The Deep Washout and Bottom Accumulation
I am taking a LONG bias on Linde India Ltd. (LINDEINDIA) on the weekly (1W) timeframe.
When analyzing pure market structure, patience reveals the absolute highest probability setups. Looking at the macro picture, this stock suffered a brutal, highly volatile markdown phase after rejecting the ultimate historical ceiling at the red 9,517.10 line. This deep correction successfully washed out all the weak hands. However, instead of bleeding into a secular bear market, the stock found a floor. Look at the green shaded box at the bottom of the structure. For months, the stock chopped sideways in this tight accumulation zone, allowing heavy institutional capital to quietly absorb shares at a discount and build a massive foundation.
2. The Educational Setup: Conquering the Stepping Stones
To understand the sheer strength of this current breakout, look at how the price systematically dismantled historical resistance on its way up by building a "Staircase":
The Launch and the New Floor: After exploding out of the bottom green accumulation box, the stock didn't just go parabolic. It paused, digested its gains, and established a brand-new, higher support floor at the solid black 6,934.10 line.
The High-Level Base: Using 6,934.10 as its concrete foundation, the stock built a "Step-Up Base." It consolidated sideways directly underneath the heavy 7,675.05 resistance zone. This high-level chop acts like a pressure cooker, willingly absorbing profit-taking and storing immense kinetic energy before the next leg higher.
3. Current Price Action: The Path to the Macro High
Look at the most recent weekly candle on the far right. The pressure cooker has exploded. Buyers have effortlessly shattered the 7,675.05 resistance, printing a massive, full-bodied green expansion candle and surging toward 7,848. By clearing this major step-up base, LINDEINDIA has officially opened the door for a clean run back to the ultimate macro highs.
4. The Trade Plan: Entries, Targets, and Risk Management
Entry Strategy: Momentum is exceptionally strong right now. Chasing a massive weekly expansion candle always carries a higher risk of immediate intraday drawdown. The highest-probability, lowest-risk entry involves stepping down to a daily timeframe and placing limit orders to catch a potential minor structural pullback to retest the 7,650.00 to 7,700.00 breakout zone. Letting that newly broken ceiling prove itself as a new, indestructible support floor offers a phenomenal risk-to-reward ratio.
Take Profit (Targets): Because the stock is systematically working its way up the historical chart, our immediate structural target is the dashed pivot line at 8,130.65. Once cleared, the primary macro objective is a full retest of the ultimate historical red ceiling at 9,517.10.
Invalidation (Stop Loss): A trade thesis is only valid if the new market structure holds. A hard stop loss should be placed safely below the previous stepping stone and recent consolidation floor, around the 6,800.00 to 6,900.00 level. A definitive weekly close completely back below the 6,934.10 line would act as an early warning sign of a failed macro breakout and severe structural weakness.
5. Time Horizon:
Because this technical setup is built on a 1-Week chart capturing a massive structural completion and continuation from bottom accumulation, this is a medium-to-longer-term position outlook designed to play out over the coming weeks to months. Let the macro trend run!  Long
Long
BAJAJ_AUTO: The Macro Staircase and Explosive Structural Breakou1. The Macro Perspective: The Deep Washout and Recovery
I am taking a LONG bias on Bajaj Auto Limited (BAJAJ_AUTO) on the weekly (1W) timeframe.
When analyzing pure market structure on a macro timeframe, patience reveals the absolute highest probability setups. Looking back at the chart, the stock established a massive historical ceiling directly at the 12,173.70 level. What followed was a brutal, highly volatile markdown phase that successfully washed out all the weak hands, dragging the price all the way down toward the 7,200 zone. However, instead of bleeding into a secular bear market, the stock initiated a methodical, multi-month process of accumulation, slowly absorbing overhead supply and grinding its way back up the chart.
2. The Educational Setup: Conquering the Stepping Stones
To understand the sheer strength of this current breakout, look at how the price systematically dismantled historical resistance on the right side of the curve by building a "Staircase" or "Step-Up Bases":
The Foundation: The stock first had to conquer the mid-level pivot at the dashed 8,571.15 line. Notice how once it broke above this line, it chopped sideways, flipping it into a new support floor.
The Pressure Cooker: The stock then rallied into the heavy 9,940.15 resistance zone. Instead of suffering a deep rejection, buyers refused to let the index collapse back to the lower base. They formed a tight, high-level consolidation directly under the resistance line (using 9,427.75 as their rock-solid defense), willingly absorbing shares at premium prices and storing immense kinetic energy.
3. Current Price Action: The Path to the Macro High
Look at the most recent weekly candle on the far right. The pressure cooker has finally exploded. Buyers have effortlessly shattered the 9,940.15 resistance, printing a massive, full-bodied green expansion candle and surging past 10,500. By clearing this major accumulation zone, BAJAJ_AUTO has officially opened the door for a clean run back to the ultimate macro highs.
4. The Trade Plan: Entries, Targets, and Risk Management
Entry Strategy: Momentum is exceptionally strong right now near 10,591.00. Chasing a massive weekly expansion candle always carries a higher risk of immediate intraday drawdown. The highest-probability, lowest-risk entry involves stepping down to a daily timeframe and placing limit orders to catch a potential minor structural pullback to retest the 9,950.00 to 10,000.00 breakout zone. Letting that newly broken ceiling prove itself as a new, indestructible support floor offers a phenomenal risk-to-reward ratio.
Take Profit (Targets): Because the stock is systematically working its way up the historical chart, our primary macro structural target is a full retest of the ultimate historical ceiling at 12,173.70. Immediate psychological milestones on the way up are 11,000.00 and 11,500.00.
Invalidation (Stop Loss): A trade thesis is only valid if the new market structure holds. A hard stop loss should be placed safely below the previous stepping stone and recent consolidation floor, around the 9,300.00 to 9,400.00 level. A definitive weekly close completely back below the 9,427.75 line would act as an early warning sign of a failed macro breakout and severe structural weakness.
5. Time Horizon:
Because this technical setup is built on a 1-Week chart capturing a massive structural completion and continuation, this is a medium-to-longer-term position outlook designed to play out over the coming weeks to months. Let the macro trend run!  Long
Long
GOODLUCK: Textbook Cup & Handle Completion and Macro Breakout1. The Macro Perspective: The Deep Washout and Recovery
I am taking a LONG bias on Goodluck India Ltd. (GOODLUCK) on the weekly (1W) timeframe.
When analyzing a stock in a massive secular uptrend, we want to see healthy, deep consolidation phases to ensure the longevity of the move. Months ago, GOODLUCK established a major historical ceiling right at the 1,313.50 level. What followed was a brutal, highly volatile correction that successfully washed out late, over-leveraged buyers, dragging the price all the way down toward the 600 zone. However, instead of bleeding into a new secular bear market, the stock initiated a methodical, multi-month process of accumulation. It carved out a massive rounding bottom—the "Cup"—slowly absorbing overhead supply and grinding its way back up to the original 1,313.50 crime scene.
2. The Educational Setup: The Handle and Structural Stepping Stones
To understand the mechanics of this current breakout, we must look at how the price reacted when it finally retested that ultimate ceiling on the right side of the curve:
The Digestion (Handle): As expected, when the stock hit 1,313.50 again, it faced natural selling pressure from trapped bag-holders finally breaking even. The price rejected and pulled back, forming the "Handle" of the pattern.
The Structural Floor: Notice how the stock behaved during this pullback. It found aggressive buyers, forming a massive macro higher low. Specifically, look at the dashed line at 1,117.30. The stock used this mid-level pivot as a foundational stepping stone, chopping around it and refusing to let the structure break down. This shallow pullback directly underneath major resistance shows that institutional buyers were willingly absorbing shares at premium prices, storing immense kinetic energy.
3. Current Price Action: Blue Sky Territory
Look at the most recent weekly candle on the far right. The stored energy from the handle has been unleashed. Buyers have effortlessly shattered the 1,313.50 macro resistance, printing a massive, full-bodied green expansion candle and closing near 1,416.90. By clearing this final historical ceiling, the stock has officially entered "Blue Sky Territory" (pure price discovery). There is zero historical overhead supply left. Every single person who has ever bought this stock and held is now in profit, which means selling pressure naturally evaporates.
4. The Trade Plan: Entries, Targets, and Risk Management
Entry Strategy: Momentum is exceptionally strong right now. While aggressive momentum traders might buy the immediate breakout, the highest-probability, lowest-risk entry involves stepping down to a daily timeframe and placing limit orders to catch a potential minor pullback to retest the 1,315.00 to 1,330.00 breakout zone. Letting that old, heavy resistance prove itself as a new, indestructible support floor offers a phenomenal risk-to-reward ratio.
Take Profit (Targets): Because the stock is in pure price discovery, we use measured structural targets. By taking the depth of the macro cup (roughly 700 points from the ~600 lows to the 1,313.50 neckline) and projecting it upward from the breakout line, our primary structural target sits beautifully in the 2,000.00 to 2,050.00 macro extension zone. Immediate psychological milestones are 1,600.00 and 1,800.00.
Invalidation (Stop Loss): A trade thesis is only valid if the new market structure holds. A hard stop loss should be placed safely below the recent dashed mid-line and handle pivot, around the 1,050.00 to 1,100.00 level. A definitive weekly close completely back below the 1,313.50 line would act as an early warning sign of a failed macro breakout (a "bull trap").
5. Time Horizon:
Because this technical setup is built on a 1-Week chart capturing a massive structural completion into fresh price discovery, this is a medium-to-longer-term position trade designed to play out over the coming weeks to months. Let the macro trend run!  Long
Long


