SHRIPISTON: Explosive Daily Triangle Breakout1. The Macro Perspective: The Structural Breakout
I am taking a LONG bias on SPR Auto Technologies Ltd (SHRIPISTON) on the daily (1D) timeframe. Over the past five months, following a dip early in the year, the stock entered a highly constructive digestion phase. By continuously printing higher lows against a fixed horizontal resistance, the stock carved out a high-precision ascending triangle pattern. This structure is a classic footprint of institutional accumulation; buyers were willing to step in at progressively higher prices, continuously coiling the spring before unleashing this recent highly aggressive markup phase.
2. The Educational Setup: Defining the Boundaries
To understand the technical validity behind this move, look closely at how the price structure interacted with its core boundaries:
The 3,757.10 Upper Resistance: The definitive ceiling for a bullish structural shift was the black horizontal resistance line marked strictly at 3,757.10. This level acted as a major supply zone that capped the prominent peaks in early April and late May.
The Ascending Support Trendline: Complementing the resistance was a firm upward-sloping trendline connecting the higher lows since February. This rising floor continuously compressed the price action against the 3,757.10 ceiling, building immense structural pressure.
3. Current Price Action: Breakout Confirmation and Continuation
The structural pressure cooker has officially exploded. Looking at the far right of the chart, buyers stepped in with overwhelming conviction a few sessions ago. The stock printed a powerful green expansion candle that decisively obliterated the 3,757.10 macro ceiling. It is currently showing excellent follow-through and continuation, trading exceptionally strong at 3,926.90. The stock has officially transitioned out of its multi-month accumulation pattern and into a highly explosive, momentum-driven markup trend.
4. The Trade Plan: Entries, Targets, and Risk Management
Entry Strategy: Momentum is currently established and strong. While chasing an extended daily move carries a risk of a short-term lower-timeframe mean-reversion pullback, the highest-probability entry strategy is to look to scale into long positions on a potential structural pullback to retest the broken 3,700.00 to 3,760.00 prior resistance zone. Letting old historical resistance prove itself as a concrete new support floor provides an unmatched risk-to-reward ratio.
Targets: By utilizing a classical measured move strategy based on the structural depth of the triangle base (measuring from the most recent major swing low near 3,200.00 up to the 3,757.10 ceiling), we project an initial expansion of roughly 550+ points. Projecting this upward from the breakout point, our primary short-term structural target sits comfortably in the 4,300.00 to 4,400.00 zone.
Risk Management: An explosive continuation breakout thesis is invalidated if the price fails to hold the breakout and collapses back deep inside the triangle pattern, breaking the ascending trendline. A hard stop loss should be placed safely below the recent minor swing consolidation structure just prior to the breakout, specifically around the 3,450.00 to 3,550.00 level.
5. Time Horizon:
Because this technical setup captures a highly explosive momentum breakout and a textbook ascending triangle completion on the 1-Day chart, this is a swing-to-position trade designed to capture a rapid, sustained markup phase. Trail your stop losses tightly as it runs!  Long
Long
 Long
Long
 Long
Long
 Long
Long
Long 
 Long
Long
Stage 2 Contin./Falling Wedge Breakout/High-Level ConsolidationBluestone Jewellery has undergone a significant trend transition from a prolonged Stage 4 decline into a clear Stage 1 base and subsequently an early Stage 2 advance. The breakout from the Stage 1 base was accompanied by a sharp increase in volume and strong price expansion, followed by a move toward ₹925.
After that advance, the stock entered a corrective consolidation and formed a short-term falling wedge. Price has now moved out of the wedge and is showing renewed momentum while remaining above the major moving averages. The overall structure remains constructive, although the previous high around ₹925 remains the key resistance.
Technical Observations
Stage 1 to Stage 2 Transition: The stock spent several months building a broad Stage 1 base around the ₹400–550 region before breaking out into a strong Stage 2 advance.
Powerful Stage 2 Breakout: The initial breakout from the base was accompanied by a major expansion in price and volume, indicating strong demand and a significant change in market character.
Constructive Consolidation: Following the sharp rally toward ₹925, price entered a corrective phase without breaking the broader Stage 2 structure.
Falling Wedge Breakout: The recent consolidation formed a contracting downward-sloping structure, and price has now started breaking above the falling trendline, suggesting renewed buying interest.
Bullish Moving Average Structure: Price remains above the 20 EMA, 50 EMA and 200 DMA, with the longer-term moving averages rising, supporting the continuation of the primary uptrend.
Higher Low Structure: The recent correction has held well above the earlier Stage 2 breakout region, maintaining a sequence of higher lows.
Relative Strength: Relative strength remains firmly positive after the major trend reversal, indicating that the stock continues to outperform the broader market.
Volume Behaviour: The original Stage 2 breakout was supported by strong volume. The current continuation move would be stronger if volume expands as price approaches the previous high.
Key Resistance: The ₹920–925 region remains the immediate major resistance and could lead to profit booking before a sustained breakout.
Key Levels
Immediate Support: ₹845–855
Major Support: ₹805–820
Secondary Support: ₹760–775
Immediate Resistance: ₹920–925
Breakout Trigger: Above ₹925 with strong volume
Target 1: ₹975–1,000
Target 2: ₹1,050–1,075
Trade Plan
Aggressive momentum traders may consider entries around current levels if price continues to hold above the falling-wedge breakout zone and maintains strength above ₹850. The setup offers better risk control if the position is taken while the stock is still below the previous high rather than chasing an extended breakout candle.
A more conservative approach would be to wait for a decisive breakout above ₹920–925 with strong volume. A sustained move above the previous high would confirm that the corrective phase is complete and that the stock is entering a new price-discovery phase.
For an aggressive trade, a stop loss below ₹845 can be considered, while a wider positional stop below ₹805–820 may be more appropriate for traders willing to give the Stage 2 structure additional room.
Summary
Bluestone Jewellery is displaying several characteristics of a strong emerging Stage 2 leader: a completed Stage 1 base, powerful high-volume breakout, sustained higher highs and higher lows, bullish moving-average alignment, positive relative strength and a constructive post-breakout consolidation.
The recent falling-wedge breakout is encouraging and suggests that buyers are returning after the correction. However, the previous high around ₹920–925 remains the most important hurdle. A decisive high-volume breakout above this level could trigger the next momentum leg toward ₹975–1,000 and potentially ₹1,050+.
Caution: The stock has already delivered a very large move from its Stage 1 base, so volatility is likely to remain elevated. The ₹920–925 zone may produce significant resistance or profit booking. A failed wedge breakout followed by a breakdown below ₹845 would weaken the immediate setup, while a sustained move below ₹805–820 would materially weaken the broader Stage 2 structure.
Disclaimer: Educational purpose only. Not a recommendation to buy or sell securities. Please manage risk appropriately.  Long
Long
 Long
Long
 Long
Long
ESABINDIA: Textbook Cup & Handle Completion and Explosive Macro 1. The Macro Perspective: The Great Washout and Recovery
I am taking a LONG bias on Esab India Limited (ESABINDIA) on the weekly (1W) timeframe.
When analyzing pure market structure in a strong macro environment, patience reveals the absolute highest probability setups. Look at the massive structural development on this chart. After a parabolic secular run, the stock established a heavy historical ceiling directly at the 6,599.80 level. What followed was a deep, brutal, multi-month correction that successfully washed out all the weak hands and late buyers, dragging the price down to the 4,250 zone. However, instead of entering a secular bear market, the stock initiated a methodical process of accumulation. It carved out a massive rounding bottom—the "Cup"—slowly absorbing overhead supply and systematically grinding its way back up to challenge the historical ceiling.
2. The Educational Setup: The Handle and Higher Low
To understand the sheer strength of this current breakout, look at how the price systematically digested supply on the right side of the curve:
The Rejection & Handle: As expected, when the stock approached the ultimate 6,599.80 resistance, it naturally faced selling pressure from trapped bag-holders finally breaking even. The price pulled back, forming the right side "Handle."
The Structural Floor: Notice the weekly candlesticks during this pullback. Buyers stepped in aggressively around the 5,000 level, forming a distinct higher low. They refused to let the stock collapse back into the base of the cup, willingly absorbing shares at premium prices and storing immense kinetic energy directly under major resistance.
3. Current Price Action: Blue Sky Territory
Look at the most recent weekly candle on the far right. The pressure cooker has exploded. Buyers have effortlessly shattered the 6,599.80 macro resistance, printing a massive, full-bodied green expansion candle accompanied by a noticeable surge in buying volume. By clearing this final historical ceiling, the stock has officially entered "Blue Sky Territory" (pure price discovery). There is absolutely zero historical overhead supply left. Every single investor who has bought and held this stock is now in profit, meaning natural selling pressure evaporates.
4. The Trade Plan: Entries, Targets, and Risk Management
Entry Strategy: Momentum is exceptionally strong right now near 7,150.50. Chasing a massive weekly expansion candle always carries a higher risk of an immediate intraday drawdown. The highest-probability, lowest-risk entry involves stepping down to a daily timeframe and placing limit orders to catch a potential structural pullback to retest the 6,500.00 to 6,650.00 breakout zone. Letting that old, heavy resistance prove itself as a new, indestructible support floor offers a phenomenal risk-to-reward ratio.
Take Profit (Targets): Because the stock is in pure price discovery, we use measured structural targets. By taking the depth of the massive macro cup (roughly 2,350 points from the ~4,250 base to the 6,600 neckline) and projecting it upward from the breakout line, our primary structural target sits comfortably in the 8,800.00 to 9,000.00 macro extension zone. Immediate psychological milestones are 7,500.00 and 8,000.00.
Invalidation (Stop Loss): A trade thesis is only valid if the new market structure holds. A hard stop loss should be placed safely below the recent weekly pivot low and the dashed mid-line, around the 5,700.00 to 5,800.00 level. A definitive weekly close completely back below the 6,345.80 dashed line would act as an early warning sign of a failed macro breakout (a "bull trap").
5. Time Horizon:
Because this technical setup is built on a 1-Week chart capturing a massive structural completion into fresh price discovery, this is a medium-to-longer-term position trade designed to play out over the coming weeks to months. Let the macro trend run!  Long
Long
CMPDI: Textbook High-Tight Flag Breakout and Momentum Continuati1. The Micro Perspective: The Impulse and the Pause
I am taking a LONG bias on Central Mine Planning & Design Institute Limited (CMPDI) on the daily (1D) timeframe.
When analyzing pure market structure in a high-momentum environment, we look for explosive moves followed by healthy periods of digestion. After a massive, near-vertical impulse leg from the 150s, the stock naturally needed a breather. However, instead of suffering a deep, volatile pullback to the moving averages, the stock did something incredibly bullish: it consolidated near the absolute highs. It formed a tight, controlled accumulation box, ping-ponging between the 181.45 support floor (dashed line) and the heavy 191.70 resistance ceiling (solid black line).
2. The Educational Setup: The Power of the High-Tight Base
To understand the sheer strength of this setup, look at the daily candlestick behavior inside that consolidation zone:
Absorbing Supply: Every time the stock dipped toward the 181.00 - 184.00 region, institutional buyers aggressively defended the level, forming higher local lows. They were acting as a sponge, happily absorbing the supply from impatient retail traders locking in profits.
The Pressure Cooker: By chopping sideways in such a tight range directly underneath major resistance, the stock acted like a pressure cooker. Moving sideways stores immense kinetic energy because it forces short-sellers to place their stop-losses just above the 191.70 line.
3. Current Price Action: The Lid Blows Off
Look at the most recent daily price action on the far right. The pressure cooker has exploded. Buyers effortlessly shattered the 191.70 resistance ceiling with a powerful, full-bodied green expansion candle accompanied by a noticeable surge in volume. The current candle (trading near 200.92) is holding those gains beautifully, confirming that the market has officially accepted these higher valuations. The old 191.70 ceiling is now the new launchpad.
4. The Trade Plan: Entries, Targets, and Risk Management
Entry Strategy: Momentum is exceptionally strong right now. While aggressive momentum traders might buy the immediate continuation, chasing an extended daily candle always carries a higher risk of an intraday pullback. The highest-probability, lowest-risk entry involves placing limit orders to catch a potential minor structural retest of the 192.00 to 195.00 breakout zone. Letting that newly broken ceiling prove itself as a new support floor offers a phenomenal risk-to-reward ratio.
Take Profit (Targets): We can find a measured structural target by calculating the "flagpole" (the length of the preceding impulse move, roughly 30-35 points) and projecting it upward from the 191.70 breakout line. This gives us a primary swing target sitting comfortably in the 220.00 to 225.00 zone.
Invalidation (Stop Loss): A trade thesis is only valid if the new market structure holds. A hard stop loss should be placed safely below the recent breakout zone and inside the flag pattern, around the 186.00 to 188.00 level. A definitive daily close completely back below the 181.45 dashed support line would completely invalidate the bullish flag thesis and signal a structural failure.
5. Time Horizon:
Because this technical setup is built on a 1-Day chart capturing a high-momentum flag breakout, this is a short-to-medium-term swing trade designed to capture the immediate continuation phase. Let the momentum dictate the trend!  Long
Long
LUPIN: Textbook Cup & Handle Completion and Macro Breakout1. The Macro Perspective: The Great Rounding Bottom
I am taking a LONG bias on Lupin Limited (LUPIN) on the weekly (1W) timeframe.
When analyzing pure market structure, patience reveals the highest probability setups. After a massive, relentless secular run, LUPIN established a heavy historical ceiling directly at the 2372.00 level. What followed was a deep, prolonged correction that successfully washed out late, over-leveraged buyers. However, instead of entering a secular bear market, the stock initiated a methodical process of accumulation. It carved out a massive rounding bottom—the "Cup"—slowly absorbing overhead supply and grinding its way back up to the original 2372.00 crime scene.
2. The Educational Setup: The Handle and Higher Low
To understand the sheer strength of this current breakout, look at how the price systematically digested supply on the right side of the curve:
The Rejection & Handle: As expected, when the stock finally reached the ultimate 2372.00 resistance, it naturally faced selling pressure from bag-holders breaking even. The price pulled back, forming the "Handle."
The Structural Floor: Notice the weekly candlestick patterns during this pullback. It was incredibly shallow, forming a distinct higher low near the 2200 level. Buyers refused to let the stock collapse back into the base of the cup, aggressively absorbing shares at premium prices and storing immense kinetic energy for the final thrust.
3. Current Price Action: Blue Sky Territory
Look at the most recent weekly candle on the far right. The pressure cooker has exploded. Buyers have effortlessly shattered the 2372.00 macro resistance, and the stock is surging to 2442.90. By clearing this final historical ceiling, the stock has officially entered "Blue Sky Territory" (pure price discovery). There is absolutely zero historical overhead supply left. Every single person who has ever bought this stock and held is now in profit, which means selling pressure naturally evaporates.
4. The Trade Plan: Entries, Targets, and Risk Management
Entry Strategy: Momentum is exceptionally strong right now near 2442.90. Chasing a massive weekly expansion candle always carries a higher risk of immediate drawdown. The highest-probability, lowest-risk entry involves stepping down to a daily timeframe and placing limit orders to catch a potential structural pullback to retest the 2370.00 to 2380.00 breakout zone. Letting that old, heavy resistance prove itself as a new, indestructible support floor offers a phenomenal risk-to-reward ratio.
Take Profit (Targets): Because the stock is in pure price discovery, we use measured structural targets. By taking the depth of the massive macro cup (roughly 570 points from the ~1800 lows to the 2372 neckline) and projecting it upward, our primary structural target sits near the 2940.00 to 2950.00 macro extension zone. Immediate psychological milestones are 2600.00 and 2750.00.
Invalidation (Stop Loss): A trade thesis is only valid if the new market structure holds. A hard stop loss should be placed safely below the recent "handle" pivot low, around the 2180.00 to 2200.00 level. A definitive weekly close completely back below the 2372.00 line would act as an early warning sign of a failed macro breakout (a "bull trap").
5. Time Horizon:
Because this technical setup is built on a 1-Week chart capturing a massive structural completion into fresh price discovery, this is a medium-to-longer-term position trade designed to play out over the coming weeks to months. Let the macro trend run!  Long
Long
PRIM: Textbook Break & Retest and Cup & Handle Completion1. The Macro Perspective: The Deep Washout and Recovery
I am taking a LONG bias on Primoris Services Corporation (PRIM) on the daily (1D) timeframe.
When analyzing a stock in a powerful secular uptrend, we want to see healthy consolidation phases to ensure longevity. Months ago, PRIM established a major historical ceiling right at the 171.40 level. What followed was a deep, highly volatile correction that successfully washed out weak hands, dragging the price down near the 115.00 level. However, instead of bleeding into a new bear market, the stock initiated a methodical, multi-month process of accumulation. It carved out a massive rounding bottom—the "Cup"—slowly absorbing overhead supply and grinding its way back up to the original 171.40 crime scene.
2. The Educational Setup: Flipping the Script
To understand the mechanics of this setup, we must look at how the price reacted on the right side of the curve:
The Handle: As expected, when the stock initially hit 171.40 again, it faced selling pressure. The price pulled back, forming the "Handle." Notice that this pullback formed a distinct higher low. Buyers stepped in aggressively, refusing to let the stock collapse, and stored immense kinetic energy.
The Breakout & Retest: The pressure cooker exploded, and the stock shattered the 171.40 ceiling. However, the most reliable setups occur when a stock proves it can defend its newly claimed territory. To amateur traders, the subsequent red pullback candle looked like a failed rally. To structural traders, this was the exact trigger. The price pulled back to perfectly test that 171.40 line from above. The old, heavy resistance ceiling was officially flipped into a brand-new, rock-solid support floor.
3. Current Price Action: The New Launchpad
Look at the most recent daily candles on the far right, currently trading near 185.55. After successfully defending the retest, the stored energy has been unleashed. Buyers have aggressively bid the stock up from the new floor, printing strong green continuation candles. By clearing this accumulation zone, PRIM has officially entered pure price discovery.
4. The Trade Plan: Entries, Targets, and Risk Management
Entry Strategy: The "golden entry" was precisely on that retest of the 171.40 line. Because the stock is currently resuming its upside momentum, chasing green candles carries a slightly higher risk of minor intraday drawdowns. The safest entry for those not already in position involves placing limit orders to catch any minor structural pullbacks into the 175.00 to 180.00 zone, leaning heavily on that 171.40 floor.
Take Profit (Targets): We can find a measured structural target by taking the depth of the macro cup (roughly 55 points from the ~115 lows to the 171.40 neckline) and projecting it upward from the breakout line. Our primary structural target sits near the 225.00 zone. Immediate psychological milestones are 200.00 and 210.00.
Invalidation (Stop Loss): A trade thesis is only valid if the market structure holds. A hard stop loss should be placed safely below the recent breakout line and the handle's pivot low, around the 160.00 to 165.00 level. A definitive daily close completely back below 171.40 would act as an early warning sign of a failed macro breakout (a "bull trap").
5. Time Horizon:
Because this technical setup is built on a 1-Day chart capturing a massive structural completion and retest, this is a short-to-medium-term swing trade designed to capture the explosive markup phase. Let the structure dictate the trend!  Long
Long
GL: Textbook Break & Retest and Macro Continuation1. The Macro Perspective: The Multi-Month Consolidation Box
I am taking a LONG bias on Globe Life Inc. (GL) on the daily (1D) timeframe.
When analyzing pure market structure, we have to respect major historical pivot points. Look at the solid black horizontal line at 146.64. For months, this level acted as a massive brick wall. The stock was trapped in a wide, volatile consolidation box, bouncing between the 127.13 floor and the 146.64 ceiling. However, instead of collapsing into a bear trend, the stock continuously absorbed that overhead supply, slowly transferring shares from impatient retail traders to long-term institutional holders.
2. The Educational Setup: Flipping the Script
In technical analysis, breaking a resistance line is only half the battle. The most reliable, high-probability setups occur when a stock proves it can defend its newly claimed territory.
The Breakout: Recently, the pressure cooker finally exploded, and the stock decisively shattered the 146.64 ceiling with strong momentum.
The Retest: To amateur traders, the subsequent red pullback candles look like a failed rally or a trap. To structural traders, this is the exact trigger we wait for. The price pulled back to perfectly test that 146.64 line from above. Notice the candlestick with the long lower wick that tagged the line—that is a visual footprint of institutional buyers aggressively stepping in exactly where they were supposed to. The old, heavy resistance ceiling was officially flipped into a brand-new, rock-solid support floor.
3. Current Price Action: The New Launchpad
Look at the most recent daily candles on the far right, currently trading near 152.65. After successfully defending the retest, the stored kinetic energy has been unleashed. Buyers have aggressively bid the stock up from the new floor. The market has officially accepted these higher valuations and is preparing for the next markup phase.
4. The Trade Plan: Entries, Targets, and Risk Management
Entry Strategy: The "golden entry" was precisely on that retest of the 146.64 line. Because the stock is currently resuming its upside momentum, chasing green candles carries a slightly higher risk of minor intraday drawdowns. The safest entry for those not already in position involves placing limit orders to catch any minor structural pullbacks into the 148.00 to 150.00 zone, leaning heavily on that 146.64 floor.
Take Profit (Targets): We can find a measured technical target by taking the height of the previous consolidation box (roughly 19.50 points from the 127.13 floor to the 146.64 ceiling) and adding it to the breakout level. This gives us a primary structural target in the 166.00 zone. Immediate psychological milestones sit at 160.00.
Invalidation (Stop Loss): A trade thesis is only valid if the market structure holds. A hard stop loss should be placed safely below the breakout line and recent retest pivot, around the 142.00 to 144.00 level. A definitive daily close completely back below 146.64 would invalidate the immediate "break and go" thesis and signal a potential bull trap.
5. Time Horizon:
Because this technical setup is built on a 1-Day chart capturing a major structural break and retest, this is a short-to-medium-term swing trade designed to capture the next explosive markup phase. Let the structure dictate the trend!  Long
Long
HPE: Textbook Cup & Handle Completion and Macro Breakout1. The Macro Perspective: The Great Accumulation Phase
I am taking a LONG bias on Hewlett Packard Enterprise Company (HPE) on the weekly (1W) timeframe.
When analyzing pure market structure, patience reveals the highest probability setups. Months ago, HPE established a heavy historical ceiling right at the 26.14 level. What followed was a volatile, multi-month correction that successfully washed out weak hands and late buyers. However, instead of collapsing into a sustained bear trend, the stock initiated a methodical process of accumulation. It carved out a massive rounding bottom—the "Cup"—slowly absorbing overhead supply and grinding its way back up to the original 26.14 crime scene.
2. The Educational Setup: The Handle and Volume Footprint
To understand the sheer strength of this current breakout, look at how the price reacted when it finally retested that 26.14 ceiling on the right side of the curve:
The Shallow Handle: As expected, when the stock hit 26.14 again, it faced selling pressure from trapped bag-holders. The price pulled back, forming the "Handle." But notice how shallow this pullback was compared to the overall cup. Buyers stepped in aggressively around the 20.00-22.00 zone, forming a distinct higher low. This proved institutional capital was willingly absorbing shares at premium prices.
The Volume Confirmation: Breakouts require fuel. Look at the volume indicator at the bottom of the chart on the breakout candle. We have a massive, towering surge in buying volume. This confirms that the move through resistance is not a retail fake-out; it is heavy institutional capital aggressively forcing the stock into a markup phase.
3. Current Price Action: Blue Sky Territory
Look at the most recent weekly candles on the far right. The pressure cooker has exploded. Buyers have effortlessly shattered the 26.14 macro resistance, printing a massive, full-bodied green weekly candle. The stock is currently holding its gains tightly near 28.71. By clearing this final historical ceiling, HPE has officially entered "Blue Sky Territory" (pure price discovery). With zero historical overhead supply left, selling pressure naturally evaporates.
4. The Trade Plan: Entries, Targets, and Risk Management
Entry Strategy: Momentum is exceptionally strong right now. While aggressive traders might buy the immediate continuation, the highest-probability, lowest-risk entry involves stepping down to a daily timeframe and placing limit orders to catch a potential minor structural pullback to retest the 26.00 to 26.50 breakout zone. Letting that old, heavy resistance prove itself as a new, indestructible support floor offers a phenomenal risk-to-reward ratio.
Take Profit (Targets): We can find a measured structural target by taking the depth of the macro cup (roughly 12 points from the ~14.00 lows to the 26.14 neckline) and projecting it upward from the breakout line. Our primary macro target sits near the 38.00 zone. Immediate psychological milestones are 30.00 and 35.00.
Invalidation (Stop Loss): A trade thesis is only valid if the new market structure holds. A hard stop loss should be placed safely below the recent "handle" pivot low, around the 22.00 to 23.00 level. A definitive weekly close completely back below the 26.14 line would act as an early warning sign of a failed macro breakout (a "bull trap").
5. Time Horizon:
Because this technical setup is built on a 1-Week chart capturing a massive structural completion and volume breakout, this is a medium-to-longer-term position trade designed to play out over the coming weeks to months. Let the macro trend run!  Long
Long
EBAY: Massive Box Breakout and Macro Continuation1. The Macro Perspective: The Digestion Phase
I am taking a LONG bias on eBay Inc. (EBAY) on the weekly (1W) timeframe.
When analyzing a stock in a powerful secular uptrend, we want to see healthy consolidation phases. Stocks cannot go up in a straight line forever; they need to pause and digest their gains. After a massive run from the 40s, EBAY established a heavy historical ceiling right at the 99.45 level. Instead of entering a deep bear market, the stock did the healthiest thing possible: it chopped sideways. For months, EBAY has been trapped in a massive consolidation "box," ping-ponging between a rock-solid support floor near 78.99 and a heavy resistance ceiling at 99.45. This long, sideways action was the market transferring shares from impatient retail traders to strong-handed institutional buyers.
2. The Educational Setup: The Power of the Box
In technical analysis, there is a famous saying: The longer the base, the higher in space.
The Accumulation Floor: Every time the stock approached the bottom of the box near 78.99, buyers aggressively defended the level, refusing to let the macro trend break down. That solid black line became an unbreakable floor.
The Pressure Cooker: By continuously absorbing supply and testing the 99.45 ceiling without making new macro lows, the stock acted like a pressure cooker. Moving sideways for an extended period stores immense kinetic energy because moving averages catch up, and both buyers and sellers place their stop losses just outside the range.
3. Current Price Action: The Lid Blows Off
Look at the most recent weekly candles on the far right. The pressure cooker has finally exploded. Buyers have effortlessly shattered the 99.45 macro resistance, printing powerful, full-bodied green weekly candles and pushing the stock toward 110.00. By clearing this massive accumulation zone, EBAY has officially entered "Blue Sky Territory" (pure price discovery). With zero historical overhead supply left, selling pressure naturally evaporates.
4. The Trade Plan: Entries, Targets, and Risk Management
Entry Strategy: The stock is currently experiencing extreme upside momentum near 109.33. Chasing a massive weekly expansion always carries a higher risk of immediate drawdown. The highest-probability, lowest-risk entry involves stepping down to a daily timeframe and placing limit orders to catch a potential minor structural pullback to retest the 99.50 to 102.00 breakout zone. Letting that old heavy resistance prove itself as a new, indestructible support floor offers a phenomenal risk-to-reward ratio.
Take Profit (Targets): We can find a measured technical target by taking the height of the previous consolidation box (roughly 20.50 points from the 78.99 floor to the 99.45 ceiling) and adding it to the breakout level. This gives us a primary structural target in the 120.00 zone. Immediate psychological milestones sit at 115.00 and 125.00.
Invalidation (Stop Loss): A trade thesis is only valid if the new market structure holds. A hard stop loss should be placed safely below the recent weekly pivot inside the box, around the 90.00 to 92.00 level. A definitive weekly close completely back inside the box and below the 99.45 line would act as an early warning sign of a failed macro breakout (a "bull trap").
5. Time Horizon:
Because this technical setup is built on a 1-Week chart capturing a massive structural phase transition and box breakout, this is a medium-to-longer-term position trade designed to play out over the coming weeks to months. Let the macro trend run!  Long
Long
ALL: Textbook Break & Retest and Macro Continuation1. The Macro Perspective: The Multi-Month Ceiling
I am taking a LONG bias on The Allstate Corporation (ALL) on the daily (1D) timeframe.
When analyzing pure market structure, we have to respect major historical pivot points. Look at the solid black horizontal line at 214.16. For months, this level acted as a massive brick wall. Every time the stock rallied into this zone, sellers aggressively stepped in, creating a wide, choppy consolidation range. However, instead of collapsing into a bear trend, the stock continuously absorbed that overhead supply, setting higher local lows and building pressure against the ceiling.
2. The Educational Setup: Flipping the Script
In technical analysis, breaking a resistance line is only half the battle. The most reliable, high-probability setups occur when a stock proves it can defend its newly claimed territory.
The Breakout: Recently, the pressure cooker finally exploded, and the stock shattered the 214.16 ceiling.
The Retest: To amateur traders, the subsequent red pullback candles look like a failed rally or a trap. To structural traders, this is the exact trigger we wait for. The price pulled back to perfectly test that 214.16 line from above. The old, heavy resistance ceiling was officially flipped into a brand-new, rock-solid support floor. Institutional buyers stepped in exactly where they were supposed to.
3. Current Price Action: The New Launchpad
Look at the most recent daily candles on the far right, currently trading near 219.87. After successfully defending the retest, the stored kinetic energy has been unleashed. Buyers have aggressively bid the stock up from the new floor, printing strong, full-bodied green candles. The market has officially accepted these higher valuations.
4. The Trade Plan: Entries, Targets, and Risk Management
Entry Strategy: The "golden entry" was precisely on that retest of the 214.16 line. Because the stock is currently experiencing strong upside momentum, chasing green candles carries a higher risk of minor intraday drawdowns. The safest entry for those not already in position involves placing limit orders to catch any minor structural pullbacks into the 215.00 to 217.00 zone, leaning heavily on that 214.16 floor.
Take Profit (Targets): With the stock successfully defending its breakout, it enters a highly impulsive phase. The immediate psychological and structural milestones are the 230.00 and 240.00 macro levels.
Invalidation (Stop Loss): A trade thesis is only valid if the market structure holds. A hard stop loss should be placed safely below the breakout line and recent pivot, around the 208.00 to 210.00 level (just below your dashed pivot line). A definitive daily close completely back below 214.16 would invalidate the immediate "break and go" thesis and signal a potential bull trap.
5. Time Horizon:
Because this technical setup is built on a 1-Day chart capturing a major structural break and retest, this is a short-to-medium-term swing trade designed to capture the next explosive markup phase. Let the structure dictate the trend!  Long
Long
FANG: Textbook Cup & Handle Completion and Macro Breakout1. The Macro Perspective: The Great Washout and Recovery
I am taking a LONG bias on Diamondback Energy, Inc. (FANG) on the weekly (1W) timeframe.
When analyzing pure market structure on a macro timeframe, patience reveals the highest probability setups. Long ago, FANG established a massive historical ceiling directly at the 200.16 level. What followed was a brutal, prolonged markdown phase that successfully washed out all the weak hands, dragging the price deep into the 120s. However, instead of entering a secular bear market, the stock initiated a methodical, multi-year process of accumulation. It carved out a massive rounding bottom—the "Cup"—slowly absorbing overhead supply and grinding its way back up to the original 200.16 crime scene.
2. The Educational Setup: Conquering the Stepping Stones
To understand the sheer strength of this current breakout, look at how the price systematically dismantled historical resistance on the right side of the curve:
The Intermediate Base: Look at the lower solid black line at 153.58. The stock had to conquer this mid-level supply zone first. Notice how once it broke above 153.58, it successfully retested it, flipping it into a rock-solid support floor.
The Handle Formation: As the stock finally reached the ultimate 200.16 resistance, it naturally faced selling pressure from bag-holders. The price pulled back, forming the "Handle." However, this pullback was incredibly shallow, forming a distinct higher low. Buyers refused to let the stock collapse, aggressively absorbing shares at premium prices and storing immense kinetic energy.
3. Current Price Action: Blue Sky Territory
Look at the most recent weekly candle on the far right. The pressure cooker has exploded. Buyers have effortlessly shattered the 200.16 macro resistance, and the stock is surging into the 213.00s. By clearing this final historical ceiling, the stock has officially entered "Blue Sky Territory" (pure price discovery). There is absolutely zero historical overhead supply left. Every single person who has ever bought this stock and held is now in profit, which means selling pressure naturally evaporates.
4. The Trade Plan: Entries, Targets, and Risk Management
Entry Strategy: Momentum is exceptionally strong right now near 213.68. Chasing a massive weekly expansion candle always carries a higher risk of immediate drawdown. The highest-probability, lowest-risk entry involves stepping down to a daily timeframe and placing limit orders to catch a potential structural pullback to retest the 200.00 to 205.00 breakout zone. Letting that old, heavy resistance prove itself as a new, indestructible support floor offers a phenomenal risk-to-reward ratio.
Take Profit (Targets): Because the stock is in pure price discovery, we use measured structural targets. By taking the depth of the massive macro cup (roughly 80 points from the ~120 lows to the 200 neckline) and projecting it upward, our primary structural target sits near the 280.00 macro extension zone. Immediate psychological milestones are 225.00 and 250.00.
Invalidation (Stop Loss): A trade thesis is only valid if the new market structure holds. A hard stop loss should be placed safely below the recent "handle" pivot low, around the 170.00 to 175.00 level. A definitive weekly close completely back below the 200.16 line would act as an early warning sign of a failed macro breakout (a "bull trap").
5. Time Horizon:
Because this technical setup is built on a 1-Week chart capturing a massive structural completion into fresh price discovery, this is a medium-to-longer-term position trade designed to play out over the coming weeks to months. Let the macro trend run!  Long
Long
ETN: Decisive Structural Breakout from Multi-Month RangeThe Setup (Bias): I am taking a LONG bias on Eaton Corporation, PLC (ETN) on the weekly timeframe.
The "Why" (Technical Reasons): 1. Major Resistance Breakout: The price has powerfully broken out of a wide, multi-month consolidation range, decisively clearing the heavy historical resistance at $394.28.
2. Extreme Bullish Momentum: The breakout is driven by a massive, full-bodied green weekly candle closing near its absolute high. This indicates immense institutional buyer demand and a complete lack of selling pressure at these new levels.
Trade Plan (Entry & Exits): * Entry: Momentum traders can look for entries near the current market price of $423.92 to ride the aggressive wave. A safer, more conservative approach would be placing limit orders to catch a potential pullback or retest of the $394.28 to $400.00 zone, looking for old resistance to flip into new support.
Take Profit (Target): With the stock entering price discovery and showing extreme momentum, the next major psychological targets are $450.00, followed by $475.00.
Stop Loss: Placed safely below the lower support boundary of the recent swing, around $370.00. A weekly close below this level would indicate a false breakout and invalidate the bullish thesis.
Duration: Because this analysis is built on a 1-Week chart, this is a longer-term swing trade designed to play out over the coming weeks to months.  Long
Long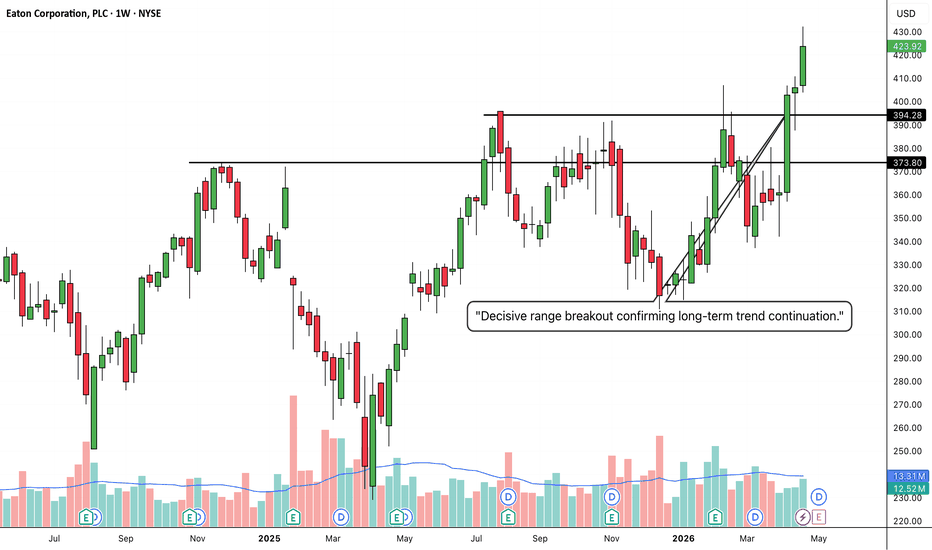
 Long
Long
NEE: Textbook Box Breakout and Structural Retest1. The Macro Perspective: The Digestion Phase
I am taking a LONG bias on NextEra Energy, Inc. (NEE) on the daily (1D) timeframe.
When analyzing pure market structure, we have to look at how a stock behaves after a massive impulse move. Earlier this year, NEE exploded off the 83.47 historical base. However, healthy markets don't go up in a straight line; they need to pause and digest their gains. For the past couple of months, NEE has been trapped in a massive consolidation "box" (highlighted in green), ping-ponging between a hard support floor near 90.00 and a resistance ceiling near 95.00. This sideways chop is the ultimate sign of accumulation, transferring shares from impatient retail traders to long-term institutional holders.
2. The Educational Setup: The Power of the Box Retest
In technical analysis, the most reliable setups occur when a stock proves it can defend its newly claimed territory.
The Breakout: Recently, the pressure cooker finally exploded, and the stock shattered the 95.00 ceiling, pushing up toward 98.00.
The Retest: To amateur traders, the current red pullback candles look like weakness or a failed rally. To structural traders, this is the exact trigger we wait for. The price is pulling back to perfectly test the top of that green box from above. Old, heavy resistance is now acting as a brand-new, rock-solid support floor.
3. Current Price Action: Flipping the Ceiling to a Floor
Look at the most recent daily candles on the far right, currently trading near 95.51. As the price drops into the top of the box, sellers are losing momentum, and buyers are stepping in to defend the breakout level. By refusing to let the price collapse back into the middle of the consolidation zone, the market is officially accepting these higher valuations.
4. The Trade Plan: Entries, Targets, and Risk Management
Entry Strategy: We are currently sitting right at the "golden entry" zone. The highest-probability, lowest-risk entry involves stepping in right here at the retest of the box ceiling (between 94.50 and 95.50). Buying the retest of a major structural breakout offers a phenomenal risk-to-reward ratio because your line in the sand is clearly defined.
Take Profit (Targets): We can find a measured technical target by taking the height of the consolidation box (roughly 5.00 points from 90 to 95) and adding it to the breakout level. This gives us a primary structural target of 100.00, which also serves as a massive psychological milestone for the stock.
Invalidation (Stop Loss): A trade thesis is only valid if the new market structure holds. A hard stop loss should be placed safely inside the top half of the box, around the 93.50 to 94.00 level. A daily candle closing deeply back inside the green box would invalidate the immediate "break and go" thesis and signal a potential bull trap.
5. Time Horizon:
Because this technical setup is built on a 1-Day chart capturing a rectangular consolidation breakout and retest, this is a short-to-medium-term swing trade designed to capture the next explosive markup phase. Let the structure dictate the trend!  Long
Long


