ALL: Textbook Break & Retest and Macro Continuation1. The Macro Perspective: The Multi-Month Ceiling
I am taking a LONG bias on The Allstate Corporation (ALL) on the daily (1D) timeframe.
When analyzing pure market structure, we have to respect major historical pivot points. Look at the solid black horizontal line at 214.16. For months, this level acted as a massive brick wall. Every time the stock rallied into this zone, sellers aggressively stepped in, creating a wide, choppy consolidation range. However, instead of collapsing into a bear trend, the stock continuously absorbed that overhead supply, setting higher local lows and building pressure against the ceiling.
2. The Educational Setup: Flipping the Script
In technical analysis, breaking a resistance line is only half the battle. The most reliable, high-probability setups occur when a stock proves it can defend its newly claimed territory.
The Breakout: Recently, the pressure cooker finally exploded, and the stock shattered the 214.16 ceiling.
The Retest: To amateur traders, the subsequent red pullback candles look like a failed rally or a trap. To structural traders, this is the exact trigger we wait for. The price pulled back to perfectly test that 214.16 line from above. The old, heavy resistance ceiling was officially flipped into a brand-new, rock-solid support floor. Institutional buyers stepped in exactly where they were supposed to.
3. Current Price Action: The New Launchpad
Look at the most recent daily candles on the far right, currently trading near 219.87. After successfully defending the retest, the stored kinetic energy has been unleashed. Buyers have aggressively bid the stock up from the new floor, printing strong, full-bodied green candles. The market has officially accepted these higher valuations.
4. The Trade Plan: Entries, Targets, and Risk Management
Entry Strategy: The "golden entry" was precisely on that retest of the 214.16 line. Because the stock is currently experiencing strong upside momentum, chasing green candles carries a higher risk of minor intraday drawdowns. The safest entry for those not already in position involves placing limit orders to catch any minor structural pullbacks into the 215.00 to 217.00 zone, leaning heavily on that 214.16 floor.
Take Profit (Targets): With the stock successfully defending its breakout, it enters a highly impulsive phase. The immediate psychological and structural milestones are the 230.00 and 240.00 macro levels.
Invalidation (Stop Loss): A trade thesis is only valid if the market structure holds. A hard stop loss should be placed safely below the breakout line and recent pivot, around the 208.00 to 210.00 level (just below your dashed pivot line). A definitive daily close completely back below 214.16 would invalidate the immediate "break and go" thesis and signal a potential bull trap.
5. Time Horizon:
Because this technical setup is built on a 1-Day chart capturing a major structural break and retest, this is a short-to-medium-term swing trade designed to capture the next explosive markup phase. Let the structure dictate the trend!  Long
Long
FANG: Textbook Cup & Handle Completion and Macro Breakout1. The Macro Perspective: The Great Washout and Recovery
I am taking a LONG bias on Diamondback Energy, Inc. (FANG) on the weekly (1W) timeframe.
When analyzing pure market structure on a macro timeframe, patience reveals the highest probability setups. Long ago, FANG established a massive historical ceiling directly at the 200.16 level. What followed was a brutal, prolonged markdown phase that successfully washed out all the weak hands, dragging the price deep into the 120s. However, instead of entering a secular bear market, the stock initiated a methodical, multi-year process of accumulation. It carved out a massive rounding bottom—the "Cup"—slowly absorbing overhead supply and grinding its way back up to the original 200.16 crime scene.
2. The Educational Setup: Conquering the Stepping Stones
To understand the sheer strength of this current breakout, look at how the price systematically dismantled historical resistance on the right side of the curve:
The Intermediate Base: Look at the lower solid black line at 153.58. The stock had to conquer this mid-level supply zone first. Notice how once it broke above 153.58, it successfully retested it, flipping it into a rock-solid support floor.
The Handle Formation: As the stock finally reached the ultimate 200.16 resistance, it naturally faced selling pressure from bag-holders. The price pulled back, forming the "Handle." However, this pullback was incredibly shallow, forming a distinct higher low. Buyers refused to let the stock collapse, aggressively absorbing shares at premium prices and storing immense kinetic energy.
3. Current Price Action: Blue Sky Territory
Look at the most recent weekly candle on the far right. The pressure cooker has exploded. Buyers have effortlessly shattered the 200.16 macro resistance, and the stock is surging into the 213.00s. By clearing this final historical ceiling, the stock has officially entered "Blue Sky Territory" (pure price discovery). There is absolutely zero historical overhead supply left. Every single person who has ever bought this stock and held is now in profit, which means selling pressure naturally evaporates.
4. The Trade Plan: Entries, Targets, and Risk Management
Entry Strategy: Momentum is exceptionally strong right now near 213.68. Chasing a massive weekly expansion candle always carries a higher risk of immediate drawdown. The highest-probability, lowest-risk entry involves stepping down to a daily timeframe and placing limit orders to catch a potential structural pullback to retest the 200.00 to 205.00 breakout zone. Letting that old, heavy resistance prove itself as a new, indestructible support floor offers a phenomenal risk-to-reward ratio.
Take Profit (Targets): Because the stock is in pure price discovery, we use measured structural targets. By taking the depth of the massive macro cup (roughly 80 points from the ~120 lows to the 200 neckline) and projecting it upward, our primary structural target sits near the 280.00 macro extension zone. Immediate psychological milestones are 225.00 and 250.00.
Invalidation (Stop Loss): A trade thesis is only valid if the new market structure holds. A hard stop loss should be placed safely below the recent "handle" pivot low, around the 170.00 to 175.00 level. A definitive weekly close completely back below the 200.16 line would act as an early warning sign of a failed macro breakout (a "bull trap").
5. Time Horizon:
Because this technical setup is built on a 1-Week chart capturing a massive structural completion into fresh price discovery, this is a medium-to-longer-term position trade designed to play out over the coming weeks to months. Let the macro trend run!  Long
Long
ETN: Decisive Structural Breakout from Multi-Month RangeThe Setup (Bias): I am taking a LONG bias on Eaton Corporation, PLC (ETN) on the weekly timeframe.
The "Why" (Technical Reasons): 1. Major Resistance Breakout: The price has powerfully broken out of a wide, multi-month consolidation range, decisively clearing the heavy historical resistance at $394.28.
2. Extreme Bullish Momentum: The breakout is driven by a massive, full-bodied green weekly candle closing near its absolute high. This indicates immense institutional buyer demand and a complete lack of selling pressure at these new levels.
Trade Plan (Entry & Exits): * Entry: Momentum traders can look for entries near the current market price of $423.92 to ride the aggressive wave. A safer, more conservative approach would be placing limit orders to catch a potential pullback or retest of the $394.28 to $400.00 zone, looking for old resistance to flip into new support.
Take Profit (Target): With the stock entering price discovery and showing extreme momentum, the next major psychological targets are $450.00, followed by $475.00.
Stop Loss: Placed safely below the lower support boundary of the recent swing, around $370.00. A weekly close below this level would indicate a false breakout and invalidate the bullish thesis.
Duration: Because this analysis is built on a 1-Week chart, this is a longer-term swing trade designed to play out over the coming weeks to months.  Long
Long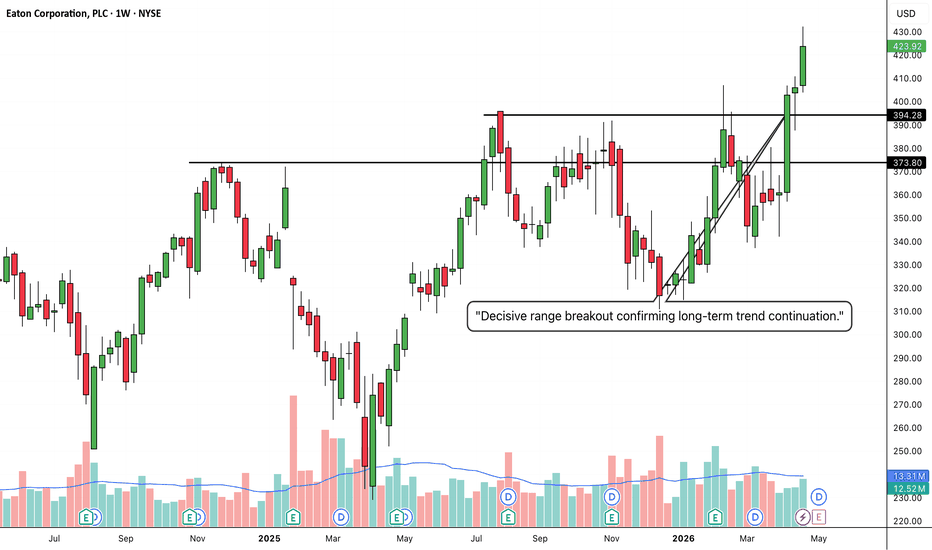
 Long
Long
NEE: Textbook Box Breakout and Structural Retest1. The Macro Perspective: The Digestion Phase
I am taking a LONG bias on NextEra Energy, Inc. (NEE) on the daily (1D) timeframe.
When analyzing pure market structure, we have to look at how a stock behaves after a massive impulse move. Earlier this year, NEE exploded off the 83.47 historical base. However, healthy markets don't go up in a straight line; they need to pause and digest their gains. For the past couple of months, NEE has been trapped in a massive consolidation "box" (highlighted in green), ping-ponging between a hard support floor near 90.00 and a resistance ceiling near 95.00. This sideways chop is the ultimate sign of accumulation, transferring shares from impatient retail traders to long-term institutional holders.
2. The Educational Setup: The Power of the Box Retest
In technical analysis, the most reliable setups occur when a stock proves it can defend its newly claimed territory.
The Breakout: Recently, the pressure cooker finally exploded, and the stock shattered the 95.00 ceiling, pushing up toward 98.00.
The Retest: To amateur traders, the current red pullback candles look like weakness or a failed rally. To structural traders, this is the exact trigger we wait for. The price is pulling back to perfectly test the top of that green box from above. Old, heavy resistance is now acting as a brand-new, rock-solid support floor.
3. Current Price Action: Flipping the Ceiling to a Floor
Look at the most recent daily candles on the far right, currently trading near 95.51. As the price drops into the top of the box, sellers are losing momentum, and buyers are stepping in to defend the breakout level. By refusing to let the price collapse back into the middle of the consolidation zone, the market is officially accepting these higher valuations.
4. The Trade Plan: Entries, Targets, and Risk Management
Entry Strategy: We are currently sitting right at the "golden entry" zone. The highest-probability, lowest-risk entry involves stepping in right here at the retest of the box ceiling (between 94.50 and 95.50). Buying the retest of a major structural breakout offers a phenomenal risk-to-reward ratio because your line in the sand is clearly defined.
Take Profit (Targets): We can find a measured technical target by taking the height of the consolidation box (roughly 5.00 points from 90 to 95) and adding it to the breakout level. This gives us a primary structural target of 100.00, which also serves as a massive psychological milestone for the stock.
Invalidation (Stop Loss): A trade thesis is only valid if the new market structure holds. A hard stop loss should be placed safely inside the top half of the box, around the 93.50 to 94.00 level. A daily candle closing deeply back inside the green box would invalidate the immediate "break and go" thesis and signal a potential bull trap.
5. Time Horizon:
Because this technical setup is built on a 1-Day chart capturing a rectangular consolidation breakout and retest, this is a short-to-medium-term swing trade designed to capture the next explosive markup phase. Let the structure dictate the trend!  Long
Long
CESC: Explosive Macro Breakout and Rounding Bottom Completion1. The Macro Perspective: The Deep Washout and Recovery
I am taking a LONG bias on CESC Ltd. (CESC) on the weekly (1W) timeframe.
When analyzing pure market structure, patience reveals the most powerful setups. Months ago, CESC established a major historical ceiling right at the 194.35 level. What followed was a deep, highly volatile correction that successfully washed out the weak hands. However, instead of bleeding into a secular bear market, the stock initiated a methodical, multi-month process of accumulation. It carved out a massive rounding bottom—the "Cup"—slowly absorbing overhead supply and grinding its way back up to the original 194.35 crime scene.
2. The Educational Setup: Conquering the Stepping Stones
To understand the sheer strength of this current breakout, look at how the price systematically dismantled historical resistance on the right side of the curve:
The Intermediate Hurdle: Look at the dashed line on the chart at 150.64. During the recovery, the stock had to conquer this mid-level pivot. Notice how once it reclaimed 150.64, that line flipped into a solid support floor, acting as a stepping stone for the next leg higher.
The Relentless Ascent: After clearing 150.64, the stock didn't even pause to form a deep handle. The buying pressure was relentless, printing a series of higher highs and higher lows on the weekly chart directly into the ultimate resistance. This aggressive V-shaped right side of the cup is a classic footprint of heavy institutional accumulation.
3. Current Price Action: Blue Sky Territory
Look at the current weekly candle on the far right. It is a powerful bullish engine that has effortlessly shattered the 194.35 macro resistance. By clearing this final historical ceiling, the stock is officially transitioning out of its accumulation phase and entering a high-momentum markup phase (pure price discovery).
4. The Trade Plan: Entries, Targets, and Risk Management
Entry Strategy: Momentum is exceptionally strong right now as the stock trades near 198.72. While aggressive momentum traders might buy the breakout directly, the highest-probability, lowest-risk entry involves stepping down to a daily timeframe and placing limit orders to catch a potential minor pullback to retest the 194.00 to 195.00 breakout zone. Letting that old, ultimate resistance prove itself as a new, indestructible support floor offers a phenomenal risk-to-reward ratio.
Take Profit (Targets): Because the stock is breaking into fresh territory, we use measured structural targets. By taking the depth of the macro cup (roughly 80+ points from the ~110 lows to the 194 neckline) and projecting it upward, our primary structural target sits near the 270.00 to 280.00 zone. Immediate psychological milestones are 225.00 and 250.00.
Invalidation (Stop Loss): A trade thesis is only valid if the new market structure holds. A hard stop loss should be placed safely below the most recent weekly structural pivot, around the 170.00 to 175.00 level. A definitive weekly close completely back below the 194.35 line would act as an early warning sign of a failed macro breakout (a "bull trap").
5. Time Horizon:
Because this technical setup is built on a 1-Week chart capturing a massive structural completion into fresh price discovery, this is a medium-to-longer-term position trade designed to play out over the coming weeks to months. Let the macro trend run!  Long
Long
ASTERDM: Explosive Macro Breakout and Continuation into Blue Ski1. The Macro Perspective: The Healthy Shakeout
I am taking a LONG bias on Aster DM Healthcare Ltd. (ASTERDM) on the weekly (1W) timeframe.
When analyzing a stock in a secular uptrend, corrections are not a sign of weakness—they are a requirement for longevity. After a relentless, multi-year run, ASTERDM finally established a major historical ceiling at the 715.90 level. What followed was a deep, sharp correction down to the 552.55 zone. To an amateur, this looks like a trend reversal. To a structural trader, this is a completely healthy "shakeout" designed to remove late, over-leveraged buyers and reset the chart for the next major leg up.
2. The Educational Setup: The Macro Higher Low
To understand the power of this new breakout, we have to look at the structural floor:
The Demand Zone: When the stock dropped to the 552.55 level, institutional buyers aggressively stepped in, leaving wicks on the bottom of the weekly candles. By defending this area, they formed a massive macro higher low relative to the 2023 price action, proving the underlying secular uptrend was perfectly intact.
The V-Shaped Recovery: Instead of chopping sideways for years, the stock carved out an aggressive, V-shaped rounding recovery. This relentless, uninterrupted buying pressure on the right side of the curve is a classic footprint of heavy institutional accumulation preparing for a breakout.
3. Current Price Action: Blue Sky Territory
Look at the current weekly candle on the far right. It is a powerful bullish engine that has effortlessly shattered the 715.90 historical resistance. By clearing this final ceiling, the stock has officially entered "Blue Sky Territory" (pure price discovery). There is absolutely zero historical overhead supply left. Every single person who has ever bought this stock and held is now in profit, which means selling pressure naturally evaporates.
4. The Trade Plan: Entries, Targets, and Risk Management
Entry Strategy: Momentum is exceptionally strong right now near 744.85. While aggressive momentum traders might buy the breakout directly, the highest-probability, lowest-risk entry involves stepping down to a daily timeframe and placing limit orders to catch a potential minor pullback to retest the 715.00 to 720.00 breakout zone. Letting that old, ultimate resistance prove itself as a new, indestructible support floor offers a phenomenal risk-to-reward ratio.
Take Profit (Targets): Because the stock is in pure price discovery, we use measured structural targets. By taking the depth of the macro pullback (roughly 160 points from 715 to 552) and projecting it upward from the breakout line, our primary structural target sits near the 875.00 to 880.00 zone. Immediate psychological milestones are 800.00 and 850.00.
Invalidation (Stop Loss): A trade thesis is only valid if the new market structure holds. A hard stop loss should be placed safely below the breakout candle's origin, around the 660.00 to 680.00 level. A definitive weekly close completely back below the 715.90 line would act as an early warning sign of a failed macro breakout (a "bull trap").
5. Time Horizon:
Because this technical setup is built on a 1-Week chart capturing a massive structural continuation into fresh price discovery, this is a medium-to-longer-term position trade designed to play out over the coming weeks to months. Let the macro trend run!  Long
Long
AETHER: Explosive Macro Breakout and Cup & Handle Completion1. The Macro Perspective: The Great Rounding Bottom
I am taking a LONG bias on Aether Industries Ltd. (AETHER) on the weekly (1W) timeframe.
When analyzing a chart from a macro perspective, patience reveals the most powerful setups. After a massive historical run, AETHER established an ultimate ceiling near the 1195.60 level. What followed was a brutal, prolonged correction that washed out weak hands. However, instead of entering a secular bear market, the stock initiated a long, methodical process of accumulation. Over the last two years, it carved out a massive rounding bottom—the "Cup"—slowly absorbing overhead supply and grinding its way back up to the original historical peak.
2. The Educational Setup: Conquering the Stepping Stones
To understand the sheer strength of this breakout, look at how the price systematically dismantled historical resistance:
The Intermediate Hurdle: Before attacking the ultimate highs, the stock had to conquer the 922.95 intermediate resistance. Notice how it broke through this level with massive momentum, using it as a structural stepping stone.
The Final Launchpad: After clearing 922.95, the stock didn't show any signs of exhaustion. It barely paused to form a handle before launching a direct assault on the 1195.60 "boss level." This relentless buying pressure is a classic footprint of heavy institutional accumulation.
3. Current Price Action: Blue Sky Territory
Look at the current weekly candle on the far right. It is a powerful bullish engine that has effortlessly shattered the 1195.60 macro resistance. By clearing this final historical ceiling, the stock has officially entered "Blue Sky Territory" (pure price discovery). There is absolutely zero historical overhead supply left to act as resistance. Every single person who has ever bought this stock and held is now in profit, which means selling pressure naturally evaporates.
4. The Trade Plan: Entries, Targets, and Risk Management
Entry Strategy: Momentum is exceptionally strong right now near 1252.00. While aggressive momentum traders might buy the breakout directly, the highest-probability, lowest-risk entry involves placing limit orders to catch a potential minor weekly pullback to retest the 1195.00 to 1200.00 breakout zone. Letting that old, ultimate resistance prove itself as a new, indestructible support floor offers a phenomenal risk-to-reward ratio.
Take Profit (Targets): Because the stock is in pure price discovery, we use measured structural targets. By taking the depth of the macro cup (roughly 500 points from the ~700 lows to the 1200 neckline) and projecting it upward, our primary macro target sits near the 1700.00 zone. Immediate psychological milestones are 1350.00 and 1500.00.
Invalidation (Stop Loss): A trade thesis is only valid if the new market structure holds. A hard stop loss should be placed safely below the breakout candle's origin and recent structural pivots, around the 1100.00 to 1120.00 level. A definitive weekly close completely back below the 1195.60 line would act as an early warning sign of a failed macro breakout (a "bull trap").
5. Time Horizon:
Because this technical setup is built on a 1-Week chart capturing a massive structural completion into fresh price discovery, this is a medium-to-longer-term position trade designed to play out over the coming weeks to months. Let the macro trend run!  Long
Long
VTL: Explosive Macro Breakout From Multi-Year BaseThe Setup (Bias): I am taking a LONG bias on Vardhman Textiles Limited (VTL) on the macro monthly (1M) timeframe.
The "Why" (Technical Reasons): 1. Historic Structural Breakout: The price has forcefully broken out of a massive, multi-year consolidation phase (resembling a large cup and handle pattern). It has decisively cleared the heavy historical resistance ceiling at the 553.30 level, a supply zone that has capped the stock since late 2021.
2. Extreme Bullish Momentum: The breakout is confirmed by an explosive, nearly full-bodied green monthly candle pushing aggressively into new territory. This type of impulsive price action on a monthly chart indicates immense, sustained institutional buying pressure and a complete structural shift to the upside.
Trade Plan (Entry & Exits): * Entry: Momentum and position traders can look for entries near the current market price of 597.60 to capture the immediate phase transition. A safer, lower-risk approach would be scaling in on a potential monthly pullback to retest the 553.30 to 560.00 breakout zone, letting that old historical ceiling prove itself as a new support floor.
Take Profit (Target): With the stock breaking out of a massive multi-year base into blue skies, the momentum can carry it significantly higher. The next major psychological targets are the 650.00 milestone, followed by 750.00.
Stop Loss: Placed safely below the recent consolidation block prior to the breakout, around the 450.00 to 475.00 level. A monthly close back below the 553.30 structural level would be an early warning sign of a failed macro breakout.
Duration: Because this analysis is built on a massive 1-Month chart capturing a multi-year breakout, this is a long-term position trade designed to play out over the coming months to years.  Long
Long
TRMD: Historic Monthly Breakout and Macro Cup & Handle Completio1. The Macro Perspective: The Multi-Year Accumulation
I am taking a LONG bias on TORM plc (TRMD), and for this setup, we are zooming all the way out to the monthly (1M) timeframe.
When analyzing market structure on a monthly chart, you are no longer looking at retail noise; you are looking at the massive, slow-moving footprints of institutional capital. After establishing a historical peak near the 31.42 level, TRMD underwent a brutal, multi-year markdown. However, instead of dying out, the stock began a long, methodical process of accumulation, carving out a gigantic rounding bottom—the "Cup." It took years to absorb the overhead supply and grind back up to the original 31.42 crime scene.
2. The Educational Setup: The Handle and Institutional Patience
To understand the mechanics of this breakout, we must look at how the price reacted when it finally retested that 31.42 ceiling:
The Rejection & Digestion: As expected, when the stock hit 31.42, it faced heavy selling pressure from bag-holders who had been trapped for years. The price rejected sharply, forming the "Handle" of the pattern.
The Higher Low: However, notice that the handle did not result in a new bear market. Buyers stepped in to form a massive macro higher low, refusing to let the stock collapse. This tightening of price action directly underneath major resistance stored immense kinetic energy for the final, explosive thrust.
3. Current Price Action: Shattering the Ceiling
Look at the most recent monthly candle on the far right. After perfectly completing the handle formation, the stored energy has been unleashed. Buyers have effortlessly shattered the 31.42 macro resistance, and the monthly candle is showing extreme dominance. This signals a complete psychological shift in the market. The multi-year accumulation phase is officially over, and a secular markup phase has begun.
4. The Trade Plan: Entries, Targets, and Risk Management
Entry Strategy: The stock is currently experiencing strong upside momentum near 32.56. Because this is a monthly timeframe, candle ranges are massive. The highest-probability, lowest-risk entry involves stepping down to a weekly or daily timeframe and scaling in on minor structural pullbacks to retest the 31.00 to 31.50 breakout zone. Letting that old, heavy resistance prove itself as a new, indestructible support floor offers a phenomenal risk-to-reward ratio.
Take Profit (Targets): By taking the depth of a multi-year macro cup and projecting it upward, we get massive structural targets. The stock is entering fresh price discovery (blue skies). The immediate psychological milestones are 40.00 and 50.00.
Invalidation (Stop Loss): A trade thesis is only valid if the new macro structure holds. A hard stop loss should be placed safely below the recent monthly structural pivot, around the 24.00 to 25.00 level. A definitive monthly close completely back below the 31.42 line would invalidate the breakout and signal a potential bull trap.
5. Time Horizon:
Because this technical setup is built on a 1-Month chart capturing the completion of a massive, multi-year structural reversal, this is a true macro position trade designed to play out over the coming months to years. Let the macro trend run!  Long
Long
STNG: Textbook Cup & Handle Completion and Macro Breakout1. The Macro Perspective: The Great Rounding Bottom
I am taking a LONG bias on Scorpio Tankers Inc. (STNG) on the weekly (1W) timeframe.
When analyzing pure market structure, patience reveals the highest probability setups. Looking at this chart, STNG established a massive historical ceiling near the 78.52 level before undergoing a brutal, prolonged markdown phase. However, instead of entering a secular bear market, the stock initiated a long, methodical process of accumulation. Over the course of the last year, it carved out a massive rounding bottom—the "Cup"—slowly absorbing overhead supply and grinding its way back up to the original crime scene at 78.52.
2. The Educational Setup: The Handle Formation
To understand the mechanics of this breakout, we must look at how the price reacted when it finally retested that 78.52 ceiling:
The Absorption: As the stock hit 78.52 a few months ago, it naturally faced selling pressure from bag-holders finally breaking even. However, instead of a deep, violent rejection, the stock only pulled back shallowly.
The Launchpad: The price then chopped sideways in a tight, controlled range, forming the "Handle" of the pattern. This tight consolidation directly underneath major resistance shows that buyers were aggressively stepping in, refusing to give up ground, and storing immense kinetic energy for the final thrust.
3. Current Price Action: Shattering the Ceiling
Look at the most recent weekly candle on the far right. After perfectly respecting the bottom of its handle, the stored energy has been unleashed. Buyers have effortlessly shattered the 78.52 macro resistance and the stock is closing near its highs. This signals a complete psychological shift in the market. The accumulation phase is officially over, and the markup phase has begun.
4. The Trade Plan: Entries, Targets, and Risk Management
Entry Strategy: The stock is currently experiencing strong upside momentum near 82.99. Chasing a massive weekly expansion candle always carries a higher risk of immediate drawdown. The highest-probability, lowest-risk entry would involve stepping down to a daily timeframe and placing limit orders to catch a potential structural pullback to retest the 78.52 breakout zone. Letting that old, heavy resistance prove itself as a new, indestructible support floor offers a phenomenal risk-to-reward ratio.
Take Profit (Targets): By taking the depth of the massive macro cup and projecting it upward from the breakout line, we get massive structural targets. The stock is entering fresh price discovery. The immediate psychological milestone is 90.00, followed by the 100.00 macro extension zone.
Invalidation (Stop Loss): A trade thesis is only valid if the new market structure holds. A hard stop loss should be placed safely below the recent "handle" consolidation base, around the 72.00 to 74.00 level. A definitive weekly close completely back below the 78.52 line would invalidate the breakout and signal a potential bull trap.
5. Time Horizon:
Because this technical setup is built on a 1-Week chart capturing the completion of a massive structural reversal, this is a medium-to-longer-term position trade designed to play out over the coming weeks to months.  Long
Long
VCTR: Textbook Step-Up Base and Explosive Continuation Breakout1. The Macro Perspective: The Staircase Effect
I am taking a LONG bias on Victory Capital Holdings, Inc. (VCTR) on the weekly (1W) timeframe.
When analyzing a healthy, sustainable macro trend, we want to see the market building a "staircase." Look at the structural development on this chart. VCTR hit a massive historical ceiling at 70.20, consolidated, and eventually broke out. However, instead of going parabolic and risking a violent crash, the stock did exactly what it was supposed to do: it built a "Step-Up Base." It paused, digested the gains, and established a new, higher consolidation zone right on top of the old resistance.
2. The Educational Setup: The Retest and The New Launchpad
The absolute best risk-to-reward setups occur when a stock proves its new support levels.
The Retest: After breaking above 70.20, the stock pulled back and tested that exact same line from above. Sellers tried to push it back down, but institutional buyers aggressively defended it, officially flipping the 70.20 ceiling into a rock-solid support floor.
The New Launchpad: By defending that floor, the price chopped sideways and established a new local resistance ceiling at 76.23. This tight consolidation allowed moving averages to catch up and stored massive kinetic energy for the next structural leg up.
3. Current Price Action: Shattering the Local Ceiling
Look at the most recent weekly candle on the far right. After perfectly respecting the lower bounds of its new step-up base, the stored energy has been unleashed. Buyers have effortlessly shattered the 76.23 continuation resistance and the stock is closing near its highs. This signals that the brief accumulation phase is over, and the market is transitioning back into an aggressive markup phase.
4. The Trade Plan: Entries, Targets, and Risk Management
Entry Strategy: The stock is currently experiencing strong upside momentum near 77.89. The highest-probability, lowest-risk entry would involve stepping down to a daily timeframe and placing limit orders to catch a potential minor structural pullback to retest the 76.00 to 76.50 breakout zone. Letting that newly broken resistance prove itself as the newest step on the staircase offers a phenomenal risk-to-reward ratio.
Take Profit (Targets): With the stock successfully defending its macro breakout and expanding from a healthy base, it enters fresh price discovery (blue skies). The immediate psychological targets are the 85.00 and 90.00 macro levels.
Invalidation (Stop Loss): A trade thesis is only valid if the market structure holds. For a swing trade based on this new breakout, a hard stop loss should be placed safely below the recent consolidation and the 76.23 line, around the 72.00 to 73.00 level. A weekly candle closing completely back below the 70.20 macro floor would completely invalidate the uptrend and signal a major structural failure.
5. Time Horizon:
Because this technical setup is built on a 1-Week chart capturing a major structural continuation, this is a medium-to-longer-term position trade designed to play out over the coming weeks to months. Let the structure dictate the trend!  Long
Long
IRM: Explosive Macro Breakout and Double Bottom Completion1. The Macro Perspective: The Massive 'W' Reversal
I am taking a LONG bias on Iron Mountain Incorporated (IRM) on the weekly (1W) timeframe.
When analyzing pure market structure, horizontal lines dictate the flow of supply and demand. Looking at this chart, IRM established a massive historical ceiling near the 122.87 level before undergoing a brutal, multi-month correction. However, instead of bleeding out into a secular bear market, the stock carved out a massive "W" structure. It tested the deep lows twice, successfully washing out weak hands, before initiating a long, methodical grind back up to the neckline.
2. The Educational Setup: Pure Price Action and The Higher Low
The best breakouts are prefaced by a sign of structural strength right before the resistance line.
The Absorption: Notice how the stock behaved as it approached the 122.87 ceiling again. Instead of being immediately rejected all the way back down, it absorbed the selling pressure and formed a clear higher low (the pivot right before the current massive push).
The Launchpad: By forming this higher low, buyers proved they were willing to step in at premium prices, tightly coiling the price action and storing kinetic energy for the final, explosive thrust.
3. Current Price Action: Shattering the Ceiling
Look at the most recent weekly candle on the far right, currently trading near 127.19. It is a massive, full-bodied bullish engine. After months of structural development, the stored energy has been unleashed. Buyers have effortlessly shattered the 122.87 macro resistance, closing near absolute highs. This signals a complete psychological shift in the market and the official transition back into a markup phase.
4. The Trade Plan: Entries, Targets, and Risk Management
Entry Strategy: The stock is currently experiencing extreme upside momentum. Chasing a massive weekly expansion candle carries a higher risk of immediate drawdown. The highest-probability, lowest-risk entry would involve stepping down to a daily timeframe and placing limit orders to catch a potential structural pullback to retest the 122.00 to 123.00 breakout zone. Letting that old, heavy resistance prove itself as a new, indestructible support floor offers a phenomenal risk-to-reward ratio.
Take Profit (Targets): We can project a measured structural target by taking the depth of the massive "W" pattern (roughly 40+ points) and adding it to the breakout neckline. This puts the primary macro target in the 160.00 to 165.00 zone. Immediate psychological milestones sit at 140.00 and 150.00.
Invalidation (Stop Loss): A trade thesis is only valid if the market structure holds. A hard stop loss should be placed safely below the recent "higher low" launchpad, around the 108.00 to 110.00 level. A definitive weekly close completely back below the 122.87 line would invalidate the breakout and signal a potential bull trap.
5. Time Horizon:
Because this technical setup is built on a 1-Week chart capturing the completion of a major structural reversal, this is a medium-to-longer-term position trade designed to play out over the coming weeks to months.  Long
Long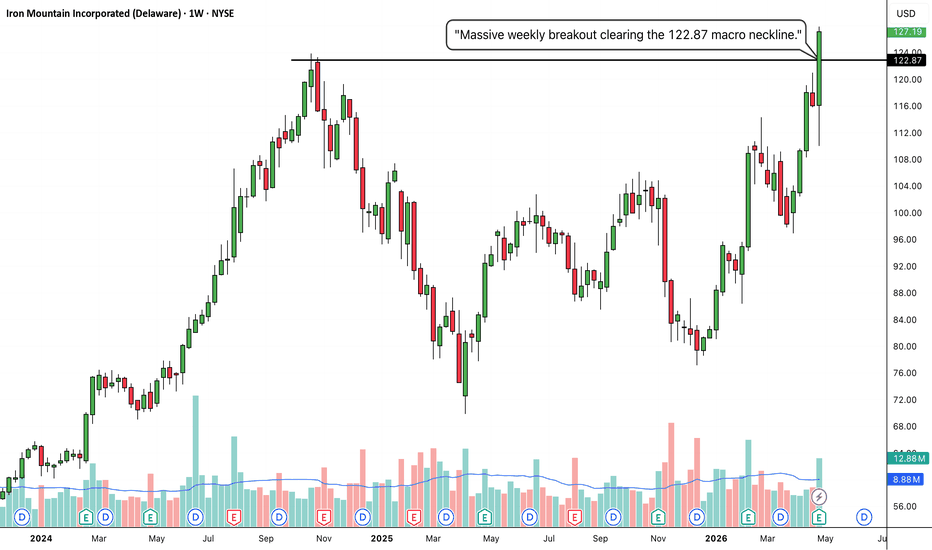
 Long
Long
NXPI: Explosive Multi-Level Breakout on Historic Volume1. The Macro Perspective: Conquering the Double Ceiling
I am taking a LONG bias on NXP Semiconductors N.V. (NXPI) on the weekly (1W) timeframe.
When analyzing pure market structure, we look for areas where supply has historically overwhelmed demand. For a long time, NXPI has been battling a massive "double ceiling." The intermediate structural resistance lived at 247.50, while the ultimate macro supply zone sat at 273.05. The stock spent months chopping in a wide, volatile range, building a massive accumulation base. This week, the stored kinetic energy from that long consolidation phase was finally unleashed, destroying both ceilings in a single move.
2. The Educational Setup: The Volume Anomaly
To truly understand the power of this breakout, you don't need complex indicators—you just need to look at the volume.
The Squeeze & Launch: Before the breakout, the stock pulled back, formed a higher low, and tightened up its price action, indicating sellers were drying up.
The Confirmation: Look at the volume indicator at the bottom of the chart for the current weekly candle. It is an absolute skyscraper compared to the entire previous year of trading. A price move of this magnitude, backed by a volume spike this massive, is the ultimate footprint of heavy institutional accumulation. Retail traders cannot move a mega-cap semiconductor stock like this; this is smart money entering the market aggressively.
3. Current Price Action: The "God Candle"
Look at the most recent weekly candle on the far right. In trading communities, a candle of this sheer size and dominance is often called a "God Candle." It opened near the lows, completely ignored the 247.50 resistance, sliced straight through the 273.05 macro ceiling, and closed near its absolute highs around 295.00. This signals a complete psychological shift in the market. Buyers are indiscriminately hitting the ask, paying a massive premium to ensure they have exposure.
4. The Trade Plan: Entries, Targets, and Risk Management
Entry Strategy: The stock is currently experiencing extreme upside momentum near 295.24. Chasing a weekly candle of this magnitude carries a high risk of immediate drawdown, as profit-taking is inevitable. The highest-probability, lowest-risk entry would involve stepping down to a daily timeframe and placing limit orders to catch a potential structural pullback to retest the 273.05 breakout zone. Letting that old, heavy resistance prove itself as a new, indestructible support floor offers a phenomenal risk-to-reward ratio.
Take Profit (Targets): With the stock breaking out of a massive multi-year base on historic volume, it has entered pure price discovery (blue skies). The immediate psychological milestones are 320.00 and 350.00.
Invalidation (Stop Loss): A trade thesis is only valid if the market structure holds. A hard stop loss should be placed safely below the 273.05 launchpad. A weekly candle closing completely back below the 247.50 intermediate line would invalidate the breakout and signal a severe bull trap.
5. Time Horizon:
Because this technical setup is built on a 1-Week chart capturing a major structural break on historic volume, this is a medium-to-longer-term position trade designed to play out over the coming weeks to months.  Long
Long
SBUX: Explosive Breakaway Gap and Massive Volume Confirmation1. The Structural Perspective: The Multi-Month Ceiling
I am taking a LONG bias on Starbucks Corporation (SBUX) on the daily (1D) timeframe.
When analyzing pure market structure, we look for areas where supply and demand are fighting for control. For months, SBUX was trapped below a heavy historical ceiling at the 101.57 level. Every time it approached this zone, sellers stepped in and pushed it back down. However, instead of collapsing, the stock built a strong, choppy base directly underneath this resistance, silently absorbing the supply. That pressure has just been violently released.
2. The Educational Setup: The Breakaway Gap & Volume Anomaly
To understand why this move is so powerful, we have to look at the anatomy of the breakout:
The Breakaway Gap: Notice how the price didn't just trade through the 101.57 line—it completely leaped over it on the open. This is called a "Breakaway Gap." It traps short sellers (forcing them to cover) and leaves sidelined buyers scrambling to get in, creating a massive vacuum of upward momentum.
The Volume Confirmation: Breakouts can be faked, but volume cannot. Look at the volume indicator at the bottom of the chart on the day of the gap. It is an absolute anomaly—a towering spike compared to the last six months of trading. This proves this move is not retail noise; it is massive institutional accumulation.
3. Current Price Action: The High Tight Flag
Look at the most recent price action near 105.90. After the massive gap up, the stock is refusing to give back its gains. It is printing small, tight daily candles right at the highs. In technical analysis, this forms a "High Tight Flag" or a momentum pennant. The market is happily digesting the new, higher valuations without any significant selling pressure.
4. The Trade Plan: Entries, Targets, and Risk Management
Entry Strategy: Trading gaps requires a specific strategy. Aggressive momentum traders can look to enter on a daily breakout above the current small flag (above 106.00). A safer, more calculated approach for swing traders is to place limit orders to catch a potential "gap fill" or partial pullback to retest the 101.57 to 102.00 zone. Letting that old heavy resistance prove itself as a new launchpad offers a phenomenal risk-to-reward ratio.
Take Profit (Targets): With the stock breaking away on historic volume, it enters a highly impulsive phase. The next major psychological milestones are the 110.00 and 115.00 levels.
Invalidation (Stop Loss): The golden rule of a true breakaway gap is that it should not fully fill. A hard stop loss should be placed safely below the 101.57 breakout level and the low of the gap candle, around the 98.00 to 100.00 area. A daily close completely filling the gap and falling back below 101.57 would invalidate the immediate bullish thesis (a "gap and trap").
5. Time Horizon:
Because this technical setup is built on a 1-Day chart capturing a high-momentum breakaway gap, this is a short-to-medium-term swing trade designed to capture the immediate institutional markup phase.  Long
Long
 Long
Long
AARTIND: Massive Accumulation Breakout and Macro Trend Reversal1. The Macro Perspective: The Shift in Market Phases
I am taking a LONG bias on Aarti Industries Ltd (AARTIND) on the weekly (1W) timeframe.
When analyzing a chart, understanding market cycles is everything. AARTIND suffered a brutal, prolonged markdown phase. However, markets don't go down forever. Over the past year, the stock entered a massive "Accumulation Phase." It found an absolute floor near 349.55 and spent months chopping sideways, absorbing all remaining selling pressure. The heavy historical ceiling of this accumulation box was perfectly established at 482.45. That ceiling has just been violently shattered.
2. The Educational Setup: The Higher Low and Moving Average Cross
To understand the mechanics of this breakout, we must look at the price action right before the explosion:
The Higher Low: After testing the 349.55 floor, the stock began to carve out higher lows. This is the first footprint of institutional accumulation, showing that buyers are stepping in earlier and earlier.
The Launchpad: Notice how the 20-period Simple Moving Average (the blue middle Bollinger Band) flattened out and began to curl upward. The price used this dynamic mean as a launchpad, consolidating right under the resistance ceiling to build kinetic energy before the final thrust.
3. Current Price Action: The Expansion Phase
Look at the current weekly candle. It is a powerful bullish engine that has effortlessly cleared the 482.45 hurdle and is closing near its highs. More importantly, this aggressive push is forcing the upper red Bollinger Band to open up and expand violently outward. Breaking out of a massive multi-month base while riding an expanding upper band confirms a shift in the macro trend from sideways/down to a high-momentum markup phase.
4. The Trade Plan: Entries, Targets, and Risk Management
Entry Strategy: The stock is currently showing strong momentum near 507.50. While aggressive momentum traders might enter here, the highest-probability, lowest-risk entry would involve placing limit orders to catch a potential minor weekly pullback to retest the 482.45 breakout zone. Letting that old heavy resistance prove itself as a new support floor offers a phenomenal risk-to-reward ratio.
Take Profit (Targets): With the stock breaking out of a massive base, it has plenty of room to run. The first major psychological and structural milestone is 600.00. Looking at the macro picture, the ultimate structural target for this reversal cycle is a retest of the heavy historical supply zone marked by the red line near 750.00 to 757.60.
Invalidation (Stop Loss): A trade thesis is only valid if the new market structure holds. A hard stop loss should be placed safely below the 20-SMA dynamic support and recent swing lows, around the 415.00 to 425.00 level. A weekly candle closing completely back inside the accumulation box (below 482.45) would be an early warning sign of a failed macro breakout.
5. Time Horizon:
Because this technical setup is built on a 1-Week chart capturing a massive structural phase transition, this is a medium-to-longer-term position trade designed to play out over the coming weeks to months.  Long
Long
AIMTRON: Textbook Cup & Handle Breakout and Volatility Expansion1. The Macro Perspective: Completing the Cup and Handle
I am taking a LONG bias on Aimtron Electronics Limited (AIMTRON) on the weekly (1W) timeframe.
When analyzing market structure, patience pays off. Over the past several months, AIMTRON carved out a massive, beautifully structured rounding bottom—the "Cup". As it approached the historical resistance zone near 1038.75, it naturally faced selling pressure and pulled back. This pullback formed the "Handle" of the pattern, shaking out weak hands before institutional buyers stepped back in to force the true breakout.
2. The Educational Setup: Support Confluence and the Launchpad
To truly understand the power of this "Handle" formation, look at the exact level where the price bounced.
The Confluence: The stock pulled back directly into the 896.35 structural level. At this exact same moment, the 20-period Simple Moving Average (the blue middle Bollinger Band) rose up to meet the price.
The Launchpad: This dual-layer of support (horizontal structure + dynamic mean) provided the ultimate high-probability launchpad. Institutional buyers aggressively accumulated shares at this "fair value" zone, preventing any further breakdown and building the kinetic energy required to shatter the ceiling.
3. Current Price Action: The Expansion Phase
Look at the current weekly candle. It is an absolute monster. It has effortlessly blasted through the 1038.75 historical resistance and is closing near its absolute highs. More importantly, this aggressive push is forcing the upper red Bollinger Band to open up and expand violently. When a stock rides an expanding upper band on a weekly timeframe out of a major base, it signals extreme, sustained momentum and the beginning of a major trend continuation.
4. The Trade Plan: Entries, Targets, and Risk Management
Entry Strategy: The stock has just experienced a massive surge and is trading near 1182.85. Chasing extended weekly candles carries higher risk. The highest-probability entry would involve scaling in with limit orders to catch any potential minor pullbacks to retest the 1038.00 to 1050.00 breakout zone. Letting that old heavy resistance prove itself as a new support floor offers a phenomenal risk-to-reward ratio.
Take Profit (Targets): With the stock breaking out of a massive multi-month base into blue-sky territory, momentum can carry it significantly higher. The first major psychological milestones are 1300.00 and 1400.00. If the volatility band continues to expand, 1500.00 is the next logical macro target.
Invalidation (Stop Loss): A trade thesis is only valid if the market structure holds. A hard stop loss should be placed safely below the recent handle consolidation, the 896.35 structural level, and the 20-SMA dynamic support, around the 850.00 level. A weekly candle closing back below the 1038.75 level would act as an early warning sign of a failed macro breakout.
5. Time Horizon:
Because this technical setup is built on a massive 1-Week chart capturing a macro trend transition, this is a medium-to-longer-term position trade designed to play out over the coming weeks to months. Let the structure dictate the trend.  Long
Long
 Long
Long
RAMRAT: Explosive Structural Breakout and Volatility Expansion1. The Macro Perspective: Shattering the Ceiling
I am taking a LONG bias on Ram Ratna Wires Limited (RAMRAT) on the weekly (1W) timeframe.
When analyzing market structure, massive horizontal resistance levels tell us where the major supply zones live. For months, the 374.75 level acted as an iron ceiling, rejecting the price and forcing deep consolidations. This created a massive, drawn-out structural base (resembling a large Cup and Handle or W-bottom). However, the market dynamics have just shifted violently. Buyers have absorbed all overhead supply and triggered a massive structural breakout.
2. The Educational Setup: The Launchpad and Expansion
To truly understand the power of this move, we must look at how the price interacted with the Bollinger Bands leading up to the breakout:
The Launchpad: Notice the price action prior to the explosive green candle. The stock pulled back and perfectly tested the 20-period Simple Moving Average (the blue middle band). Instead of breaking down, institutional buyers used this dynamic "mean" as a launchpad, accumulating shares at fair value.
The Squeeze: During this accumulation phase, the bands slightly contracted, storing up kinetic energy for the next major directional move.
3. Current Price Action: The Expansion Phase
Look at the current weekly candle. It is an absolute monster. It has effortlessly shattered the 374.75 historical resistance and is closing near its absolute highs. More importantly, this aggressive push is forcing the upper red Bollinger Band to open up and expand rapidly. When a stock rides an expanding upper band on a weekly timeframe, it signals extreme, sustained institutional buying pressure and the beginning of a major trend continuation.
4. The Trade Plan: Entries, Targets, and Risk Management
Entry Strategy: Momentum traders can look for entries near the current extended market price (444.25) to capture the aggressive phase transition. A safer, lower-risk approach would involve scaling in with limit orders to catch any potential weekly pullback to retest the 374.75 to 400.00 breakout zone, letting that old macro ceiling prove itself as a new support floor.
Take Profit (Targets): With the stock breaking out of a massive multi-month base into blue skies, momentum can carry it significantly higher. The first major psychological milestone is the 500.00 level. If the macro trend sustains and volatility continues to expand, 550.00 is the next logical target.
Invalidation (Stop Loss): A trade thesis is only valid if the market structure holds. A hard stop loss should be placed safely below the recent weekly consolidation and the 20-SMA dynamic support, around the 320.00 to 340.00 level. A weekly candle closing back below the 374.75 level would be an early warning sign of a failed macro breakout (a "bull trap").
5. Time Horizon:
Because this technical setup is built on a massive 1-Week chart capturing a macro trend transition, this is a medium-to-longer-term position trade designed to play out over the coming weeks to months.  Long
Long
ATLC: The Bollinger Slingshot and Explosive V-Shaped Recovery1. The Macro Perspective: The Deep Washout and Recovery
I am taking a LONG bias on Atlanticus Holdings Corporation (ATLC) on the weekly (1W) timeframe.
When analyzing a volatile uptrend, the character of the pullbacks tells you everything about the health of the stock. ATLC recently went through a deep, multi-month correction. To the untrained eye, this looks like a trend breakdown. However, structural traders know that as long as higher macro lows are maintained, these deep washouts serve to shake out weak hands and reset the chart for the next massive leg higher.
2. The Educational Setup: The Bollinger Slingshot
To truly understand the mechanics of this aggressive move, look at the price action relative to the Bollinger Bands:
The Washout: During the recent correction, the price sliced through the 20-period Simple Moving Average (the blue middle band) and washed all the way down to test the lower green band.
The Slingshot: Instead of bleeding lower, institutional buyers aggressively stepped in. The price reclaimed the 20-SMA middle band, consolidated briefly, and has now used it as a launchpad. This pattern—dipping to the lower band, reclaiming the mean, and violently expanding to the upper band—is often called a "Bollinger Slingshot." It represents a complete, rapid shift in market psychology from extreme fear to extreme greed.
3. Current Price Action: The Expansion Phase
Look at the current weekly candle. It is an absolute monster. This full-bodied green engulfing candle has erased weeks of downward price action in a single move. More importantly, it is actively pushing the upper red Bollinger Band outward. When a stock rides an expanding upper band with this much velocity, it signals that buyers are indiscriminately hitting the ask, paying premium prices to secure their positions before the next major breakout. The stock is now directly attacking its major macro swing highs.
4. The Trade Plan: Entries, Targets, and Risk Management
Entry Strategy: Momentum traders can look for aggressive entries near the current market price (76.68) to capture the immediate velocity as it tests the macro ceiling. A safer, more calculated approach would be stepping down to a daily chart and placing limit orders to catch any minor intraday pullbacks toward the 68.00 to 72.00 zone.
Take Profit (Targets): The immediate battleground is the previous swing high near 78.00 to 80.00. Once the price clears that 80.00 psychological ceiling, the stock enters fresh price discovery (blue skies) with major macro targets at 90.00 and 100.00.
Invalidation (Stop Loss): The velocity of this move is its strength, so we don't want to give it too much room to fail. A stop loss should be placed safely below the recent weekly consolidation and the 20-SMA dynamic support, around the 58.00 to 60.00 level. A weekly close back below the blue middle band would invalidate this slingshot thesis and suggest further macro consolidation is needed.
5. Time Horizon:
Because this technical setup is built on a 1-Week chart capturing a high-momentum recovery, this is a medium-term swing trade designed to play out over the coming weeks.  Long
Long


