XAUUSD: Sellers Reject the Recovery — Is 4,280 the Next Target?After a short-term rebound, XAUUSD is showing renewed weakness as price struggles below the descending trendline and the Ichimoku resistance area. The recovery toward 4,430–4,440 has so far failed to change the broader bearish structure, keeping sellers in control.
In terms of news, gold is under pressure as rising oil prices revive inflation concerns, while strong U.S. employment data has increased expectations that the Federal Reserve could raise rates again. Markets are currently pricing roughly a 60% probability of a Fed rate hike, making upcoming U.S. inflation data especially important. Higher rate expectations remain a headwind for non-yielding gold, even though a softer U.S. dollar is providing some support.
Looking at the H3 chart, the technical structure also supports a bearish scenario:
Price has been repeatedly rejected from the descending trendline.
The 4,425–4,440 area overlaps with trendline resistance and the upper Ichimoku zone.
Price is now trading around 4,393, showing that the latest rebound has already lost momentum.
The 4,360–4,385 zone is the nearest support. A decisive break below this area could accelerate selling pressure toward the lower demand zone.
📉 Main Scenario
Resistance: 4,425–4,440
Support: 4,360–4,385
Target: 4,280–4,300
As long as XAUUSD remains below the descending trendline and fails to reclaim 4,440, I continue to favor the bearish scenario. A breakdown below 4,360 would strengthen the case for another move toward 4,280–4,300.  Short
Short
 Long
Long
 Short
Short
RAYMOND Technical Snapshot📊 RAYMOND — Technical Snapshot
Raymond is showing strong upward momentum, supported by exceptionally high volume and a sharp price expansion. The stock is trading above its key moving averages, with RSI at 81.89, indicating an extended momentum zone. The chart structure remains strong, while the current move should be studied for price acceptance and consolidation after the sharp expansion.
Reference Level: 1,024.50
Invalidation Level: 771.00
Resistance: 1,073.18 | 1,143.57 | 1,262.63
Support: 883.73 | 764.67 | 694.28
Disclaimer: This content is for educational and informational purposes only. The levels and technical observations are provided solely for studying market behaviour and do not constitute investment advice or a recommendation to buy, sell or hold any security. Readers should not make financial decisions solely on the basis of this content. Investors should conduct their own independent research, evaluate their individual financial circumstances and risk profile, and consult an appropriately SEBI-registered investment professional where required.
STWP and the author make no representation or guarantee regarding future price movements, returns, performance or outcomes.  Long
Long
The Market Broke The RuleFor years, traders have been taught a simple relationship: rising yields are bad for equities. Higher borrowing costs increase the discount rate applied to future earnings, financial conditions become tighter, and expensive growth assets can come under pressure. The relationship is real, but treating it as a mechanical rule is where the analysis starts to break down.
The recent market reaction provides a useful case study. U.S. Treasury yields moved sharply higher as inflation concerns, rising oil prices and changing expectations around monetary policy pushed the 10-year yield close to the 5% level. Yet equities were still able to rally rather than simply following the textbook relationship. That apparent contradiction is where the more interesting market analysis begins.
The Market Doesn't Trade One Variable in Isolation.
A higher yield can create pressure on equities, but the market is constantly weighing that pressure against everything else happening at the same time. Inflation expectations, economic growth, earnings expectations, oil prices, liquidity, positioning and expectations for central-bank policy can all influence the final reaction.
In this case, the inflation data did not deliver the kind of upside surprise investors had feared. Treasury yields pulled back from their highs, while equities responded positively as some of the immediate policy concerns eased. The important point is not that yields suddenly stopped mattering. It is that the market was responding to the entire change in expectations rather than simply reacting to the direction of one chart.
This Is Why Correlations Are Not Rules.
A relationship between two assets can be statistically meaningful without producing the same reaction every single time. When the dominant driver changes, the relationship can weaken, reverse or temporarily disappear.
If yields rise because growth expectations are improving, the market may interpret that very differently from a rise caused by accelerating inflation or fiscal concerns. The same percentage-point move in yields can therefore carry a completely different message depending on what is driving it.
Context Changes the Meaning of Price.
This is one of the most important distinctions between watching markets and actually analysing them. A trader who only sees “yields up” may immediately expect stocks to fall. A trader looking at the broader picture asks why yields are rising, what the market expected beforehand, what is happening to inflation, how oil is behaving, and whether equity earnings expectations are changing at the same time.
The direction of a variable matters. But the reason behind that direction often matters more.
The Rule Wasn't Really Broken.
The mistake was treating a relationship as a law.
Markets are interconnected, but they are not mechanical. The same input can produce different outcomes when the surrounding conditions change. That is why experienced market analysis focuses less on memorising relationships and more on understanding the forces competing to move price.
The next time you see a familiar correlation appear to fail, don't immediately assume the market is irrational. Start with a better question: what changed in the information the market is pricing?
Sometimes the market isn't breaking the rule.
We're just looking at the wrong rule.  Education
BTC/USD 45-Minute Technical Analysis 1. Market Structure
BTC is showing a clear sequence of lower highs and lower lows, declining from approximately $80,400 toward $76,000.
Key levels visible on the chart:
• $78,900–$79,100 — Major previous resistance and supply zone\
• $77,900–$78,000 — Recent bearish MSB area\
• $77,200–$77,400 — Immediate support/reaction zone\
• $76,400–$76,000 — Major downside liquidity and swing-low area
The overall 45-minute structure remains bearish unless price can reclaim the recent resistance zones with strong acceptance.
2. Liquidity Sweep
The most important event on the chart is the sharp upside spike near the 11th.
BTC moved aggressively from approximately $76.8K–$77.2K toward $79.6K–$79.8K, but the breakout was quickly rejected.
This resembles a liquidity sweep where price takes buy-side liquidity above previous highs before reversing.
The important detail is that BTC failed to maintain acceptance above the highs. The aggressive rejection suggests that sellers were waiting at higher prices.
3. Short Setup
The cleaner opportunity is not necessarily to short the current price around $77.62K.
A more professional approach would be to wait for a retracement toward the $77.8K–$78K region.
If price returns to this zone and shows bearish confirmation such as:
• Rejection wick\
• Bearish engulfing candle\
• Lower high\
• Failed breakout\
• Lower-timeframe bearish MSB
then the short setup becomes considerably stronger.
4. Important Resistance Zone
The main zone to watch is approximately $77,850–$78,050.
This area is important because it combines the previous structure break with the psychological $78K level.
If BTC reaches this zone and gets rejected, it could provide a favorable risk-to-reward short opportunity.
However, if BTC reclaims $78K and holds above it, the bearish setup starts losing strength.
5. Downside Targets
TP1: \~$77,200
First nearby objective and potential area for partial profit.
TP2: \~$76,800
This is the primary target shown by the projected path on the chart.
TP3: \~$76,400
A deeper continuation target near the recent swing structure.
TP4: \~$76,000
Major liquidity and previous swing-low region. A break toward this area would indicate stronger bearish continuation.
6. Bearish Invalidation
The short thesis becomes weaker if BTC successfully reclaims $78K and establishes acceptance above it.
A stronger invalidation would be sustained trading above approximately $78.4K–$78.8K.
If BTC moves back toward $79.2K–$79.6K, the current bearish continuation idea would need to be completely reassessed.
7. Overall Market Narrative
The chart shows an interesting liquidity sequence.
BTC was declining toward the $76K region, then suddenly produced a powerful upside move that swept liquidity around $79.6K.
This type of move can trap both sides of the market.
Short sellers above the highs can be stopped out during the spike, while late buyers may enter because of the strong bullish displacement.
When price then reverses sharply, those late longs can become forced sellers, potentially adding momentum to the downside.
That is why the $77.8K–$78K region is particularly important.
Professional Trade Plan
Bias: Bearish below \~$78K
Preferred entry: \~$77.8K–$78.05K after bearish confirmation
TP1: \~$77.2K
TP2: \~$76.8K
TP3: \~$76.4K
Extended target: \~$76.0K
Invalidation: Strong acceptance above \~$78.4K–$78.8K
Risk: High, because the chart is showing extreme volatility
Final View
The current structure favors bearish continuation, but chasing the move at $77.62K is less attractive than waiting for a retracement.
The ideal scenario is:
Liquidity sweep → sharp rejection → retracement into $77.8K–$78K → bearish confirmation → lower high → continuation toward $76.8K and potentially $76.4K–$76K.
If BTC instead holds above $78K and begins forming higher highs, the bearish thesis should be abandoned and the market reassessed. Short 
 Short
Short
 Short
Short
XAUUSD – Gold Breaks Range, 4,283 Is Critical XAUUSD – Gold Breaks Range, 4,283 Is Critical
Gold is trading under pressure near 4,327 after losing the previous consolidation range.
The chart is showing a clear shift in short-term structure. Price failed to hold above the liquidity area around 4,351 and continued to move lower inside the descending channel. This tells me sellers are still controlling the intraday direction, especially after gold broke below the earlier sideways range.
From the market side, traders are still waiting for the U.S. CPI report. The stronger USD reaction after PPI data is keeping pressure on gold, while rising oil prices and Middle East tension create mixed safe-haven flows. This is why the current move is sensitive: gold can react quickly, but the technical structure is still weak unless buyers reclaim resistance.
Technical view:
Gold is moving inside a descending channel.
Price broke below the previous range and is now trading near 4,327.
The nearest liquidity resistance is around 4,351.
As long as gold stays below 4,351, sellers still have short-term control.
The main support zone is around 4,283 – 4,273.
This area is important because it aligns with the channel support and the previous strong support level.
If 4,273 breaks with strong bearish momentum, gold may continue toward the Fibonacci target near 4,198.
If buyers defend 4,273 – 4,283, gold may create a short-term recovery back toward 4,351.
Key levels to watch:
Current price: 4,327
Nearest resistance: 4,351
Short-term liquidity area: 4,340 – 4,351
Strong support: 4,283 – 4,273
Downside Fibonacci target: 4,198
Recovery confirmation: above 4,351
Invalidation for sell pressure: above 4,375
Main scenario:
If gold retests 4,340 – 4,351 and shows bearish rejection, sellers may try to push price lower again.
Possible targets: 4,283 first, then 4,273.
If 4,273 breaks clearly, the next bearish extension can move toward 4,198.
Alternative scenario:
If gold sweeps 4,273 – 4,283 and forms a strong bullish rejection, buyers may attempt a recovery.
First recovery target: 4,351.
If gold breaks above 4,351 and holds, the short-term bearish pressure may weaken and price can move back toward 4,375.
Hannah’s view:
Gold is not showing a clean bullish reversal yet.
The break below the previous range and the weak reaction under 4,351 keep the short-term view bearish. For buyers, the best area to watch is not the middle of the move, but the lower support around 4,273 – 4,283.
Main view: sellers remain in control below 4,351. A clean rejection from this zone supports continuation toward 4,283 and 4,198. If buyers defend 4,273 strongly, gold may form a recovery attempt. No confirmation means no trade.
Do you think gold will defend 4,273, or will CPI pressure send price toward 4,198 next?
Short 
POC Rejection Keeps Downside Liquidity in Focus
Fundamental Analysis
Gold remains supported by a softer U.S. dollar and safe-haven demand. However, high oil prices and Treasury yields keep inflation concerns elevated, with U.S. PPI and CPI now the key catalysts.
Technical Analysis
On H1, Gold rejected the 4,435–4,445 liquidity area and remains below the descending trendline.
Price is now trading near 4,380, below the 4,395–4,405 POC, keeping short-term pressure bearish.
The first liquidity sits around 4,375, while the stronger downside target remains 4,340–4,345.
Important Key Levels
4,435–4,445 — Strong Liquidity
4,395–4,405 — POC / Resistance
4,375 — Liquidity
4,340–4,345 — Main Liquidity Support
Trading Scenario
Sell priority remains on a weak rebound into 4,395–4,405 followed by bearish H1 confirmation.
Target: 4,375 first, then 4,340–4,345.
Invalidation: H1 acceptance above 4,405 and the descending trendline.
Overall View
H1 remains bearish below the POC and trendline. The cleaner setup is to wait for a rebound rather than chase price lower, with 4,340–4,345 remaining the main liquidity objective.
Will Gold retest the POC first, or sweep 4,340 directly? Long 
Education 
Education

Trendline Rejection Keeps Bearish Bias
Fundamental Analysis
Gold is supported by safe-haven demand as Middle East tensions intensify, but Brent above $100 is increasing inflation concerns. Markets are now focused on U.S. PPI Thursday and CPI Friday, with a Fed rate hike still being priced as a meaningful possibility.
Technical Analysis
On H1, Gold remains below the descending trendline after the recent CHoCH and BOS, keeping the short-term structure bearish.
Price is now near 4,410, where the trendline creates immediate resistance. The stronger sell area sits around 4,428–4,442 OB + Fibo.
Volume Profile also shows heavy activity around 4,380–4,410, making rebounds into this area important for sellers.
Important Key Levels
4,485–4,495 — BSL / Major Resistance
4,428–4,442 — OB + Fibo / Resistance
4,380–4,395 — POC
4,340–4,355 — Liquidity
4,305–4,320 — SSL
Trading Scenario
Sell priority remains while Gold stays below the descending trendline and 4,428–4,442 resistance.
Target: 4,340–4,355 first, then 4,305–4,320 SSL.
Invalidation: H1 acceptance above 4,442 and the trendline.
Overall View
The H1 structure remains bearish. The cleaner approach is to wait for rejection around resistance rather than chase price lower, with liquidity and SSL remaining the main downside objectives.
Will Gold reject the trendline again and sweep 4,350 next? Short 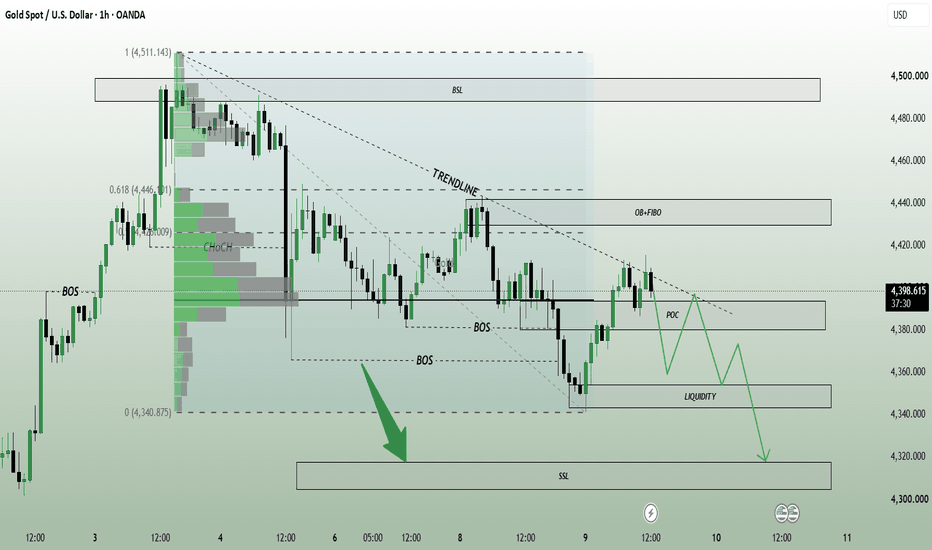
BRIAN XAUUSD – GOLD BREAKS RANGE, SELLERS TARGET LOWER VALUE BRIAN XAUUSD – GOLD BREAKS RANGE, SELLERS TARGET LOWER VALUE
Gold is entering the end of the week under strong pressure.
After several sessions of narrow movement, price finally broke below the previous consolidation range and tested the 4,300 area. This is important because the market had been holding value earlier in the week, but the latest breakdown shows that buyers lost short-term control.
The macro background also supports caution. The US dollar remains firm after stronger PPI inflation data, while the market is waiting for the next US CPI report. At the same time, Middle East tension and higher oil prices continue to keep inflation risk alive. That creates a difficult environment for gold, because safe-haven demand can support price, but stronger USD and hawkish Fed expectations can pressure any recovery.
So the message is clear:
Gold is not ready for a clean bullish recovery yet.
Sellers are still controlling the structure below 4,362 - 4,386.
Technical structure
On the 45-minute chart, gold is trading around 4,330 after breaking down from the previous value range.
The market is moving inside a descending trendline structure. Price has already lost the prior support base and is now attempting a weak recovery from the lower part of the channel.
The first important resistance is the Sell zone POC around 4,362. This is the nearest value resistance. If gold rebounds into this area and rejects, sellers may continue pushing price lower.
Above that, the stronger resistance is the Sell zone VAH and support flip around 4,386. This zone is very important because it was previous support, but after the breakdown, it may now act as resistance. As long as gold stays below 4,386, the bearish structure remains valid.
The downside target is the lower channel area around 4,275 - 4,285. If CPI volatility supports USD strength, gold may rotate toward this lower value zone before buyers attempt a stronger reaction.
Important zones
Current price area: 4,325 - 4,335
Gold is consolidating near the weekly low after breaking the previous range.
Sell zone POC: 4,355 - 4,365
First short-term resistance and seller reaction zone.
Sell zone VAH / support flip: 4,380 - 4,390
Main resistance. Buyers need to reclaim this area to weaken the bearish view.
Lower channel target: 4,275 - 4,285
Main downside target if sellers continue controlling the structure.
Key psychological support: 4,300
Price already tested this area; losing it again can invite more downside pressure.
Trading scenario
Priority view: sell reaction from 4,362 - 4,386
Entry:
Look for sell positions only if gold rebounds into 4,355 - 4,365 or 4,380 - 4,390 and shows clear bearish rejection.
Stop Loss:
Above the rejection high or above the 4,386 resistance zone.
Take Profit:
TP1: 4,310 - 4,300
TP2: 4,285
TP3: 4,270 if bearish momentum expands after CPI
This setup follows the current breakdown structure. Sellers have the advantage while gold remains below the flipped value resistance.
Alternative buy scenario
A buy setup is only interesting if gold sweeps the 4,300 area or reaches 4,275 - 4,285, then forms a strong bullish rejection.
Entry:
Buy only after confirmation from the lower channel support area.
Stop Loss:
Below the local sweep low.
Take Profit:
TP1: 4,330
TP2: 4,362
TP3: 4,386 if buyers reclaim momentum
This is only a reaction-buy idea, not a bullish trend-following setup yet.
Final view
Gold has broken the previous range to the downside, and RSI turning negative confirms that short-term momentum has shifted toward sellers.
For now, I would not chase buy just because price is near the low. The cleaner plan is to wait for price to retest resistance, then watch the reaction.
The map is simple:
Below 4,362 = sellers keep pressure.
Reject 4,362 = downside can retest 4,300.
Reject 4,386 = bearish structure remains strong.
Lose 4,300 = 4,275 - 4,285 becomes the next target.
Break above 4,386 = bearish pressure weakens.
Gold is now in a CPI decision zone. If sellers continue to defend 4,362 - 4,386, the next move may be a deeper rotation into lower value. If buyers reclaim 4,386, the breakdown may turn into a false move.
Will gold reject from the flipped value zone, or will CPI create a reclaim back above 4,386?
Short 
NIFTY- Swing trade levels :- 15th September 2026If NIFTY sustain above 23484/506 (first target and make or break level) then 24572/600 (second target, however weak level) above this bullish then 23755/83 (third target, very strong level) above this more bullish more levels marked on chart.
If NIFTY sustain below 23190/108 then below this bearish then 23554/22472 below this more bearish
My view :-
"My viewpoint, offered purely for analytical consideration, buy on dip, however bullish movement will not be easy, it will be kind of relief rally or more like a relief jump.
Market will either reverse from first target or from third target.
Please do your due diligence before trading or investment.
**Disclaimer -
I am not a SEBI registered analyst or advisor. I does not represent or endorse the accuracy or reliability of any information, conversation, or content. Stock trading is inherently risky and the users agree to assume complete and full responsibility for the outcomes of all trading decisions that they make, including but not limited to loss of capital. None of these communications should be construed as an offer to buy or sell securities, nor advice to do so. The users understands and acknowledges that there is a very high risk involved in trading securities. By using this information, the user agrees that use of this information is entirely at their own risk.
Thank you. Long 


