XAUUSD — Buy the H1 Support RetestFundamental Analysis
Gold is holding relatively firm as a softer U.S. dollar provides support, but the macro backdrop remains highly sensitive to inflation. U.S. PPI is due today, followed by CPI on Friday, with markets still assigning meaningful probability to another Fed hike after the strong payroll report.
At the same time, Brent above $100 and continued disruption around the Strait of Hormuz are reinforcing inflation risks, while the U.S. 10-year Treasury yield has moved near 4.85%. These forces could keep gold volatile even as geopolitical uncertainty supports safe-haven demand.
Technical Analysis
On H1, XAUUSD is trading near 4,385 after rejecting the descending resistance trendline and moving back toward the lower part of the current structure.
The key support sits around 4,350–4,365, where the marked H1 support zone and rising trendline converge. This is the preferred area for a bullish reaction.
If buyers defend this zone and reclaim 4,378–4,401, price could rotate toward 4,419, followed by the larger 4,444–4,460 target zone.
The deeper 4,290–4,305 demand zone remains important only if H1 support fails.
Important Key Levels
4,444–4,460 — Main upside target
4,419–4,430 — Resistance / Fib 0.618
4,401–4,410 — FVG resistance
4,350–4,365 — Main buy zone
4,290–4,305 — Deep demand
Below 4,340 — Bullish invalidation
Trading Scenario
Main Buy Setup
Entry: 4,350–4,365
Stop Loss: 4,338
Take Profit 1: 4,401
Take Profit 2: 4,419–4,430
Take Profit 3: 4,444–4,460
Buy Condition
Wait for price to test 4,350–4,365 and show bullish confirmation. A liquidity sweep, long lower wick, bullish engulfing candle, or H1 reclaim above 4,378 would strengthen the recovery setup. A sustained break below 4,340 would invalidate the immediate bullish idea.
Overall View
The H1 structure remains compressed beneath descending resistance, so buying at current price offers limited value. The preferred plan is to wait for a controlled pullback into 4,350–4,365 and confirmation from buyers. If support holds, XAUUSD could recover toward 4,419 and eventually 4,444–4,460.
Will gold defend 4,350–4,365 before the PPI/CPI volatility pushes price toward 4,450?  Long
Long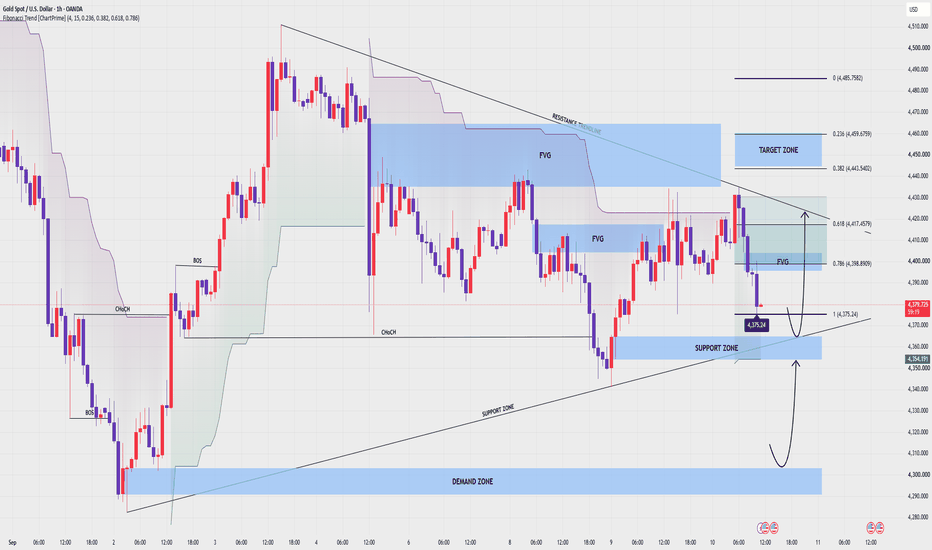
 Short
Short
 Long
Long
XAUUSD: 4,440 Caps, 4,280 Decides Next XAUUSD: 4,440 Caps, 4,280 Decides Next
Market Context
Gold is moving sideways near the weekly low after testing the 4,300 area, while the market waits for the next US CPI report.
The US Dollar remains supported after stronger PPI inflation data, even as Middle East tensions and higher oil prices keep the market cautious. This creates a difficult environment for gold: safe-haven demand may still appear, but higher inflation pressure and stronger USD momentum can limit upside recovery.
For now, gold is not showing a clean bullish reversal. The market is still trading under short-term bearish pressure.
Technical Structure
Gold remains below the descending trendline, and the latest recovery attempt has been weak.
Price failed to reclaim the 4,410 - 4,440 resistance area and is now trading around 4,346. This keeps the short-term structure bearish, especially after the previous breakdown from the consolidation range.
The chart shows that sellers are still defending the upper structure. Any rebound into 4,410 - 4,440 may attract another bearish reaction if buyers cannot break above the trendline with strength.
The key support below is 4,280 - 4,310. This is the main decision zone for buyers. If gold reacts strongly from this area, a short-term recovery back toward 4,360 - 4,410 is possible.
But if 4,280 breaks clearly, the downside pressure can expand, and gold may continue lower toward 4,240 and 4,200.
Key Levels
Current Price: 4,346
Main Resistance Zone: 4,410 - 4,440
Descending Trendline Resistance: Around 4,400 - 4,420
Key Support / Bullish Reaction Zone: 4,280 - 4,310
Lower Downside Target: 4,240
Extended Bearish Target: 4,200
Major HTF Supply: 4,600 - 4,650
Bullish Recovery: Above 4,440
Bearish Continuation: Below 4,280
Trading Plan
Primary Sell Scenario
Entry: 4,410 - 4,440 after bearish confirmation
SL: Above 4,465
TP: 4,360 / 4,310 / 4,280
Condition: Price rebounds into the main resistance zone but fails to break above the descending trendline. If sellers defend this area, the bearish structure remains valid.
Breakdown Sell
Entry: Below 4,280 after breakdown and retest
SL: Above 4,320
TP: 4,240 / 4,200 / 4,160
Condition: Gold loses the key support zone and cannot reclaim it. This would confirm that selling pressure is expanding below the weekly decision area.
Buy Reaction Scenario
Entry: 4,280 - 4,310 after strong bullish confirmation
SL: Below 4,250
TP: 4,360 / 4,410 / 4,440
Condition: Price must show a clear reaction from the key support zone. This is only a reaction buy, not a full bullish reversal unless gold reclaims 4,440.
Bullish Recovery Scenario
Entry: Above 4,440 after breakout and retest
SL: Below 4,400
TP: 4,480 / 4,520 / 4,600
Condition: Buyers must break the descending trendline and hold above the main resistance zone. Only then does the bearish pressure start to weaken.
Overall Bias
Gold is still bearish in the short term while price remains below 4,410 - 4,440.
The current structure suggests that rebounds may still face selling pressure unless buyers can reclaim the trendline and hold above 4,440. Until then, the market remains vulnerable to another move lower.
The most important area now is 4,280 - 4,310. If buyers defend it, gold may create a technical rebound. If it breaks, the next downside targets are 4,240 and 4,200.
Best approach: do not chase the market in the middle. Wait for either a confirmed rejection from 4,410 - 4,440 or a strong reaction around 4,280 - 4,310.
Will gold defend 4,280 and recover, or will sellers break the support and push price into a deeper decline?
Short 
 Long
Long
 Long
Long
 Long
Long
Long 
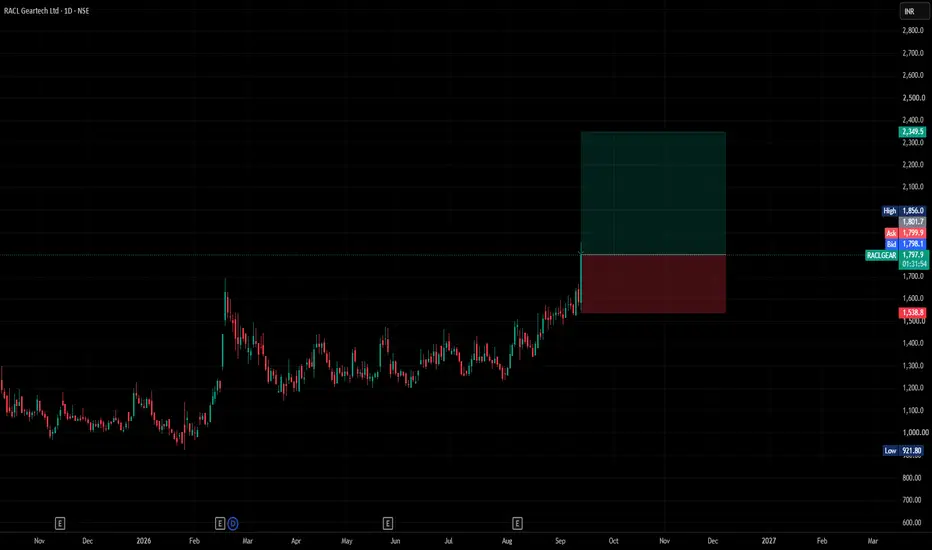
Buy Today, Sell Tomorrow for 3–5% – Daily Breakout SetupRACL GEARTECH LIMITED — BTST BREAKOUT SETUP
Entry, Stop Loss & Targets Are Clearly Defined — Helping You Plan Your Trade With Confidence.
📊 Stock Strength: 100/100
(Note: Higher score indicates stronger stock conditions, not guaranteed returns.)
A bullish breakout has appeared on the 1D timeframe with positive price action and strong volume expansion.
🔄 Trade Type: BTST
────────────────────
🎯 TRADE LEVELS
ENTRY: ₹1,783
🛑 STOP LOSS
ATR SL: ₹1,646
🎯 TARGETS
T1: ₹1,932
T2: ₹2,123
T3: ₹2,333
────────────────────
📈 VOLUME
20D Volume: 987%
1D Volume: 2787%
────────────────────
⏱ Timeframe: 1 Day
📌 Trade Entry: Take the trade only after 3:15 PM.
The position can be held for the next trading session if the trend remains strong.
The setup is based on breakout structure, price action, volume strength and trend analysis.
────────────────────
📈 Risk Management
Stop Loss is compulsory. Consider position sizing according to your risk and avoid risking more than you can afford to lose.
────────────────────
⚠️ Disclaimer:
This is a technical analysis setup for educational purposes only and not a buy/sell recommendation. Please do your own research and manage risk before taking any trade.  Long
Long
 Long
Long
XAUUSD 4346 sweep — 4500 trap next XAUUSD 4346 sweep — 4500 trap next
That sweep into discount is the whole story.
Gold got hit hard after PPI and oil pressure. Fair. Sellers had the reason. Price dropped back near the weekly low around 4,310 and everyone started leaning bearish again.
But look at the reaction.
Price tapped the Discount PD Array / SSL sweep zone around 4,295 - 4,322 and bounced. That is not random. That is the kind of area where smart money checks if sellers are late and overextended.
Now gold is around 4,346. Still not clean bullish freedom. But the downside push is slowing.
Main bias is bullish recovery while gold holds above 4,322 - 4,295.
The first problem is the small FVG around 4,380 - 4,392. If price reclaims that, buyers can push toward 4,444. Above 4,444, the real trap is higher: 4,485 - 4,510. That premium zone is where I expect a bigger reaction.
So yeah, I like the bounce. But I don’t want to chase it in the middle.
Trading scenario:
Buy idea only if gold holds above 4,322 and reclaims 4,392 with clean candles.
Entry zone: 4,322 - 4,392 after confirmation
Deeper buy zone: 4,295 - 4,322 if price sweeps again and reclaims
Stop loss: below 4,285
TP1: 4,392
TP2: 4,444
TP3: 4,485 - 4,510
No reclaim, no chase. Simple.
If gold breaks hard below 4,285, this bounce idea is cooked. Then sellers can drag price deeper and the weekly low sweep becomes failure, not accumulation.
For now, I’m reading this as SSL sweep first, discount reaction second, 4,500 premium trap waiting.
You think gold reclaims 4,392 first, or sweeps 4,322 one more time?
Long 
 Long
Long
XAUUSD — 4,300 Sweep, 4,505 Next Test XAUUSD — 4,300 Sweep, 4,505 Next Test
Gold is sitting in a very interesting place now, because after that sharp push into the 4,300 area, price did not continue collapsing. It swept lower, paused, and started to breathe back upward, almost like the market was checking whether sellers had already taken enough liquidity before allowing buyers to respond.
The bigger structure is still carrying damage from the previous breakdown. Gold lost the earlier range, moved inside a bearish channel, and the RSI tone has already turned weaker. Fundamentally, the USD is still supported after stronger PPI pressure, and traders are waiting for CPI, so volatility can easily become aggressive. But from an SMC view, I do not want to ignore what price is doing at the lows.
My main view is bullish for a corrective recovery while gold holds above the 4,300 - 4,320 demand area. The reason is simple: price already hunted the lower side, failed to extend cleanly, and is now trying to climb back toward the broken structure. If buyers can keep defending this base, the first magnet is the 4,450 - 4,460 FVG reaction zone. That is where the market may test whether this bounce is real or just a weak pullback.
If 4,450 is reclaimed, then 4,505.777 becomes the key liquidity and breakout level. Above that, gold may open a wider recovery path toward the major HTF liquidity target around 4,634.176.
This bullish recovery idea becomes weak only if gold loses 4,300 again and holds below it. If that happens, the market would tell me sellers are still controlling the story.
Key price zones to watch
Current reaction area: 4,330 - 4,345
Main demand / recovery base: 4,300 - 4,320
First upside reaction zone: 4,450 - 4,460
Key liquidity / breakout level: 4,505.777
Major HTF liquidity target: 4,634.176
Bearish invalidation zone: clean break and hold below 4,300
Do you think gold has already swept enough liquidity near 4,300, or does CPI still have one more downside trap before buyers take control?
Long 
RACLGEAR Technical Analysis & Setup
Symbol: RACLGEAR (RACL Geartech Ltd.) — Daily Timeframe (NSE)
Current Price: ₹1,803.20 (-1.54% intraday move)
Market Structure: Following a multi-month accumulation range above the structural low of ₹921.80, the stock formed a strong series of higher highs and higher lows, breaking out through resistance near the ₹1,800.00 region with expanding bullish candles.
Key Technical Trade Levels
Entry Zone: ~₹1,801.70 – ₹1,804.90 (Breakout continuation level)
Stop Loss (SL): ₹1,538.80 (Defined risk level below the recent consolidation base support)
Immediate High: ₹1,856.00
Intermediate Target 1: ₹2,204.20 (Horizontal projection level)
Macro Horizon Target: ₹2,349.50 (Upper green target zone)
Structural Base Low: ₹921.80
Trade Bias & Summary
The stock displays a strong bullish trend structure exiting a multi-month accumulation base. As long as price holds above the ₹1,538.80 support zone on daily closes, the setup favors upside continuation toward testing intermediate resistance at ₹2,204.20, with macro expansion potential reaching toward ₹2,349.50.
Disclaimer: This post is for educational and technical analysis purposes only and does not constitute financial or investment advice. Always manage your position sizing and risk control parameters responsibly. Long 
XAUUSD 1H Chart AnalysisThe chart shows Gold reacting from a 4,280–4,305 demand zone. Price recently bounced from this area and is now around 4,345, suggesting a possible short-term recovery.
Key levels:
Demand: 4,280–4,305
Current area: around 4,345
Resistance: 4,410–4,430
Major supply: 4,410–4,430
The chart suggests a possible step-by-step recovery toward the supply zone, but price needs to hold above the recent demand area and build higher lows. A rejection from 4,410–4,430 could bring another pullback toward lower support.
TradingView recommends that ideas explain the reasoning behind the view, remain original, avoid promotional content, and avoid exaggerated or misleading claims.
TradingView Idea — Ready to Post
Title:
XAUUSD: Gold Rebounds From Key Demand Zone
Description:
Gold is showing a recovery on the 1-hour chart after reacting strongly from the 4,280–4,305 demand zone.
Price is currently trading around 4,345. If the recovery continues and price forms higher lows, the next important area to watch is the 4,410–4,430 supply zone.
A sustained move above this supply area could indicate further upside, while a clear rejection may lead to another pullback toward lower support.
Key levels:
Support: 4,280–4,305
Resistance: 4,410–4,430
This analysis is based on market structure, price action, and key supply-demand areas. It is for educational purposes only and not financial advice.
Bias: Short-term bullish, while price holds above the demand zone. Long 
 Short
Short
 Short
Short
Short 
PPI hits gold — will CPI cause next sell-off?Gold has continued to follow the bearish bias as expected, with price breaking lower after the stronger-than-expected U.S. PPI reinforced expectations for a more hawkish Federal Reserve. Gold is currently trading around 4,347, below the descending trendline and after failing to reclaim the 4,375–4,390 Demand + FVG zone. The H4 structure therefore remains dominated by lower highs and lower lows.
The macro pressure is becoming even stronger. August U.S. PPI increased 0.4% m/m and 5.4% y/y, while jobless claims remained relatively stable. Following the data, markets raised the probability of a 25bp Fed hike next week to around 70–71%, while the U.S. 10Y yield moved close to 5% and the USD remained firm. This combination is clearly unfavorable for non-yielding Gold.
Today is therefore the real macro decision point: U.S. CPI is due later today, with consensus around 0.4% m/m, 3.4% y/y, while Core CPI is expected at 0.2% m/m and 2.4% y/y. If CPI comes in hotter than expected, the market could further price a Fed hike, pushing USD and yields higher and creating another downside impulse for Gold. Conversely, softer CPI could trigger a sharp short-covering rebound, especially because Gold has already fallen heavily this week.
Technically, 4,375–4,390 is now the first important recovery zone. If Gold rebounds into this area but fails to reclaim it, sellers could continue toward 4,300–4,320, followed by the larger 4,260–4,280 Supply + FVG zone. A sustained H4 close back above 4,400–4,420 would be the first indication that bearish momentum is weakening.
Bearish Scenario — Preferred Bias
If CPI confirms persistent inflation and Gold remains below 4,375–4,390, the current rebound should be treated as corrective. A rejection here could accelerate the move toward 4,300–4,320, with 4,260–4,280 as the next major downside zone.
Bullish Scenario
If CPI is softer than expected and USD/yields reverse lower, Gold could reclaim 4,375–4,390 and attempt to recover toward 4,420–4,440. A stronger H4 breakout above the descending trendline would be required before considering a meaningful bullish reversal.
Today’s key catalyst:
🔴 U.S. CPI — 19:30 VN
🔴 Core CPI
🔴 UoM Consumer Sentiment / Inflation Expectations — 21:00 VN
The setup is therefore quite clear: Gold has already reacted negatively to PPI; CPI now determines whether this becomes another leg lower or a short-term relief rebound. Given the current H4 structure and elevated Fed-hike expectations, Lucas continues to favor the bearish side until resistance is reclaimed.
BIAS: BEARISH — CPI COULD TRIGGER THE NEXT LEG DOWN. Short 
 Long
Long
 Long
Long
 Long
Long