XAUUSD 4409 reclaim — 4509 is waiting XAUUSD 4409 reclaim — 4509 is waiting
That hold above 4,400 is starting to matter.
Gold was heavy before. No doubt. Sellers smashed it from the upper range, broke structure, and dragged price down into that 4,330 - 4,370 pocket.
But now price is not acting dead anymore.
We got the short bearish channel broken. Price reclaimed the sellside liquidity zone, then started holding around 4,409 - 4,424. That is the first clue buyers are trying to rebuild here.
Not full bullish freedom yet.
But the reaction is cleaner than last week.
Main bias is bullish recovery while gold holds above 4,372 - 4,338.
USD weakness is helping the bounce, and the chart also shows gold reacting from the 50-day SMA area. RSI is still positive, so buyers have a reason to keep pushing. The only problem? Price is still below the 21-day SMA zone, so I don’t want to chase blindly.
The path is simple.
Hold 4,400. Break 4,424. Then 4,455 comes first. After that, 4,478 is the next buy-side pull. If buyers keep control, 4,509 becomes the real magnet.
Trading scenario:
Buy idea only if gold holds above 4,372 - 4,400 and breaks 4,424 with clean candles.
Entry zone: 4,400 - 4,424 after confirmation
Deeper buy zone: 4,338 - 4,372 if price sweeps and reclaims
Stop loss: below 4,330
TP1: 4,455
TP2: 4,478
TP3: 4,509
No reclaim, no chase. Simple.
If gold closes hard below 4,330, this recovery idea is cooked. Then sellers can drag it back toward 4,280.
For now, I’m reading this as buyer reclaim first, 4,509 liquidity next.
You think gold clears 4,478 clean, or sweeps 4,372 before flying?
 Long
Long
XAUUSD 4410 bounce — 4430 trap loading XAUUSD 4410 bounce — 4430 trap loading
That bounce from 4,350 looks good at first glance.
But I’m not buying the hype yet.
Gold did react from the weekly low area, yes. Buyers stepped in, pushed price back toward 4,410, and now everyone starts thinking recovery again.
But look left.
The bigger move is still damaged. Price already swept buy-side liquidity earlier, failed to hold the upper range, then broke down hard. That created the bearish shift. Not clean for bulls.
Now gold is walking right back into the FVG rebalance zone around 4,420 - 4,435. That is the first trap area. If price taps it and starts rejecting, sellers can take control again and drag price back toward sell-side liquidity.
Main bias stays bearish while gold trades below 4,450.
The premium PD Array around 4,485 - 4,510 is the deeper sell zone. If gold spikes there, that would look even more like a liquidity grab before another drop. Especially with buyers still cautious while Middle East tension stays hot.
Trading scenario:
Sell idea only if gold rejects 4,420 - 4,435 or stretches into 4,485 - 4,510 and fails.
Entry zone: 4,420 - 4,435 after rejection
Deeper sell zone: 4,485 - 4,510
Stop loss: above 4,530
TP1: 4,380
TP2: 4,350
TP3: 4,300
No rejection, no sell. Don’t short just because price is high.
If gold closes strong above 4,530, this bearish idea is cooked. Then buyers can try to rebuild toward 4,580.
For now, I’m reading this as weak recovery into imbalance, not real bullish control.
You think 4,430 rejects, or gold fakes one more push into 4,500?
Long 

GOLD H4: 4,430–4,450 — Key zone for another shorting?Gold continues to trade within a bearish H4 structure, with price remaining below the main descending trendline after failing to sustain the previous recovery. The recent price action shows repeated rejection around the 4,430–4,450 Demand + Fibonacci 0.618 zone, while the broader sequence of lower highs remains intact. Buyers are attempting to stabilize around 4,400, but momentum has not yet been strong enough to confirm a bullish reversal.
From a technical perspective, the key area for today is 4,430–4,450. This zone overlaps with the descending trendline and the Fibonacci 0.5–0.618 region, making it a strong decision area. If Gold rebounds into this zone and is rejected, sellers could resume control and push price toward 4,380–4,400, followed by the major 4,330–4,350 Supply/support zone. A decisive break below 4,330 would strengthen the bearish structure and expose the 4,300 area.
Bearish Scenario — Preferred Bias
If Gold remains below the descending trendline and fails to reclaim 4,430–4,450, the current recovery is likely to remain corrective. A rejection from this zone could trigger another selling wave toward 4,380, then 4,330–4,350, with 4,300 as the deeper target.
Bullish Scenario
The bearish setup would weaken only if buyers can produce a clean H4 breakout above the descending trendline and hold above 4,450. In that case, Gold could extend toward 4,480–4,500, with the next major resistance around 4,520.
With price currently compressed beneath the trendline, Lucas favors selling rallies into resistance rather than chasing the move lower. The structure remains bearish until buyers can reclaim the trendline and establish a higher high.
KEY LEVELS:
🔴 4,430–4,450 — Fib + Demand + Trendline resistance
🔴 4,480–4,500 — Major resistance
🟢 4,380–4,400 — Near-term support
🟢 4,330–4,350 — Major Supply/support
🟢 4,300 — Deeper downside target
BIAS: BEARISH — SELL THE REJECTION BELOW THE TRENDLINE. Short 
GOLD: A BIG WAVE IS COMING?Don’t take your eyes off the market! From today, the market could become much more active as geopolitical risks continue to escalate.
The US has just sunk 5 more Iranian oil tankers. Iran continues to retaliate around the Strait of Hormuz, while Iran-backed Houthi forces are also expanding pressure toward Saudi Arabia and the Bab el-Mandeb region, including attacks targeting energy infrastructure.
Brent has moved back above $100/barrel, showing that the market is increasingly pricing in risks to energy supply and transportation.
At the same time, US CPI and inflation data will be among the major focuses this week. These could become the catalyst for a much wider move in gold.
📊 XAUUSD – 4H
Gold is currently moving sideways within the 4.435–4.315 range.
🔴 Resistance:
4.435 │ 4.442 │ 4.480 │ 4.496 │ 4.570–4.600
🟢 Support:
4.400 │ 4.380 │ 4.360 │ 4.320 │ 4.300 │ 4.250 │ 4.220 │ 4.200
🎯 TRADING SCENARIOS
Bullish scenario:
If price breaks 4.435–4.442 → it could extend toward 4.480 → 4.496. A further breakout above 4.496 could open the way toward 4.570–4.600.
Bearish scenario:
If price loses 4.347–4.335 → short-term structure could weaken, opening the way toward 4.320 → 4.300, and deeper toward 4.250 → 4.220 → 4.200.
If price returns to 4.480 for a SELL, I would be more cautious. After such a long compression, this area could produce only a short-term sell reaction. For a better SELL setup, I would rather wait for 4.570–4.600 and then watch the price reaction.
🧠 PERSONAL VIEW
In my view, the market is preparing for a big wave.
There is no need to predict the direction too early. Let price confirm it:
Watch for SELL at higher levels │ Watch for BUY at lower levels │ Trade in the direction of the breakout.
The key zones to watch remain 4.435–4.442 on the upside and 4.335–4.347 on the downside.
The market is getting ready to heat up again. Don’t take your eyes off it — watch every move closely. Short 
 Long
Long
 Long
Long
XAUUSD — Trendline Reclaim Buy Setup
Market Context
Gold is trading around $4,427 after clearing sell-side liquidity and recovering from the lower H1 structure. The recent MSS shows improving short-term bullish order flow, but price is still compressed beneath the descending bearish trendline, so buyers need a confirmed reclaim before stronger continuation is validated.
The macro backdrop is mixed but offers support for Gold. A softer US dollar is helping prices, while escalating U.S.–Iran tensions and reduced traffic through the Strait of Hormuz continue to support safe-haven demand. At the same time, Brent above $100 and elevated Treasury yields are increasing inflation concerns. Markets are focused on U.S. PPI today and CPI tomorrow, with Fed expectations highly sensitive to the results.
SMC View
The recent liquidity sweep followed by a bullish MSS suggests sellers are losing control of the immediate H1 delivery. However, the descending trendline remains the main structural barrier, which is why buying directly below resistance offers weaker positioning.
The $4,375–$4,390 liquidity area is the key lower reaction zone. A sweep and bullish recovery from this area, followed by a reclaim of $4,435–$4,450, would confirm that buyers are ready to target external buy-side liquidity.
Main Trading Scenario
Condition:
Gold holds or sweeps the $4,375–$4,390 liquidity zone, then breaks above the descending trendline and reclaims the $4,435–$4,450 area. A bullish MSS or CHOCH with a successful retest is required before entry.
Entry: $4,435–$4,450 after breakout retest
SL: Below $4,375 and the reaction structure
TP1: $4,495–$4,510
Key Zones to Watch
Current price: $4,427.015
Liquidity sweep: $4,375–$4,390
Reclaim zone: $4,435–$4,450
Main target: $4,495–$4,510
Bullish Reaction POI: $4,341.074
Invalidation: Loss of the lower demand structure
Confirmation: Trendline reclaim + bullish MSS
Prime Gold View
The buy bias depends on a confirmed trendline reclaim rather than chasing price inside compression.
If buyers protect the lower liquidity structure and establish acceptance above $4,435–$4,450, Gold could reprice toward the External BSL around $4,500. Failure to reclaim resistance would keep the market vulnerable to another liquidity sweep.
No confirmation, no trade. Long 
Long 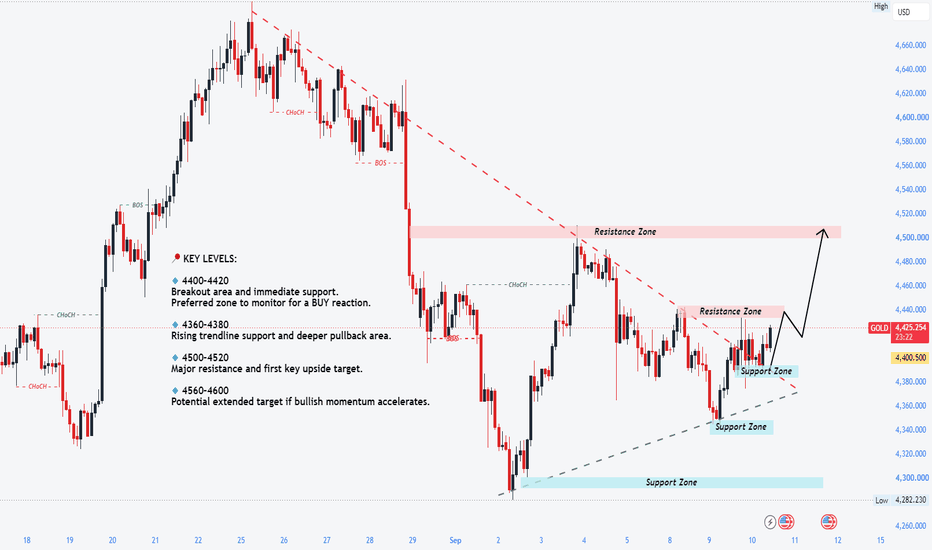
Two Observable Range of Consolidation (ROCs) and H&S PatternProbable Scenario Analysis:
⏺ Present Scenario:
The range (4500 - 4300) is a crucial consolidation range. Gold is consolidating within this range on two occasions. Firstly, it consolidated during (7th August to 19th August). Secondly, it has been consolidating in the same range since 28th August. Thus, has been the minor range of consolidation (Mi-ROC). However, the consolidation has been even broader. The range (4700 - 4300) is the major range of consolidation (Ma-ROC). The combination of both ROCs has formed a probable head-and-shoulders (H&S) pattern. The price is going through a major contraction period. The consolidation is extending as there will be two back-to-back high-impact events on Thursday and Friday. The events are Core PPI m/m and Core CPI m/m, respectively.
🟢 Bullish Scenario (Bullish Relief):
If the price decisively breaks out above 4500, then there will be bullish relief. The probable bullish targets above 4500 would be - 4550, 4600, 4650, and 4700. Strong Resistance Zone (SRZ) is (4500 - 4475).
🔴 Bearish Scenario (Bearish Relief):
If the price decisively breaks down below 4300, then there will be bearish relief. The probable bearish targets below 4300 would be - 4250, 4200, 4150, and 4100. Strong Support Zone (SSZ) is (4325 - 4300). The SSZ is also the neckline of the probable head-and-shoulders (H&S) pattern.
🟡 No Trading Zone (NTZ): Undefinable.
⏺ Major Range of Consolidation (Ma-ROC): (4700 - 4300).
Here, 4500 is the median of the Ma-ROC. The median works like a trading session sentiment evaluator. The price trading above the median would offer bullish sentiment, while the price trading below the median would trigger bearish sentiment within the ROC.
⏺ Minor Range of Consolidation (Mi-ROC): (4500 - 4300).
Here, 4400 is the median of the Mi-ROC. The median works like a trading session sentiment evaluator. The price trading above the median would offer bullish sentiment, while the price trading below the median would trigger bearish sentiment within the ROC.
● Events:
- 07 Sep (Mon): No events.
- 08 Sep (Tue): NFIB Small Business Index (03:30 PM IST, 🔵 Low Impact).
- 09 Sep (Wed): ADP Weekly Employment Change (05:45 PM IST, 🔵 Low Impact). 10-year Bond Auction (10:31 PM IST, 🔵 Low Impact).
- 10 Sep (Thu): Core PPI m/m (06:00 PM IST, 🔴 High Impact). Unemployment Claims (06:00 PM IST, 🟠 Medium Impact). Existing Home Sales (07:30 PM IST, 🔵 Low Impact). Natural Gas Storage (08:00 PM IST, 🔵 Low Impact). 30-year Bond Auction (10:30 PM IST, 🔵 Low Impact).
- 11 Sep (Fri): Core CPI m/m (06:00 PM IST, 🔴 High Impact). Prelim UoM Consumer Sentiment (07:30 PM IST, 🟠 Medium Impact). Federal Budget Balance (11:30 PM IST, 🔵 Low Impact).
● Intraday, Weekly, and Monthly Bias
Establish bias with respect to the opening price (of the particular session - Intraday, Weekly, and Monthly). If the price sustains above the opening price, then don't think of shorting. Look for bullish trades only. On the contrary, if the price sustains below the opening price, then don't think of going long. Look for bearish trades in that case.
● Disclaimer + End Note
- All the analyses would fail in the case of a major gap up, gap down, or price structure anomaly. Thus, practice PRAGMATISM in the live session.
- Trade only if there is a set-up. Remember, not trading is an extension of the trading activity.
- Mark your points. Trade your points. Price is GOD. Anything can happen in the markets. Thus, trade what you see, not what you believe.
- Always PRACTICE RISK MANAGEMENT. Always PROTECT YOUR CAPITAL. Be RESPONSIBLE.
- Be Strategic. Be Courageous. Be Patient. Be Wise.
- Every day is a new day. Thus, do not carry the baggage of past successes or failures. Leave the gardens of winning and losing. Establish yourself in equanimity. Always think from a new perspective.
- Let the joy of trading drive your effectiveness, not greed or fear. Believe in Possibilities.
Happy Trading!  Short
Short
 Long
Long
Short 
Gold (XAUUSD): What's Happening Inside the Range (4500 - 4300)?Probable Scenario Analysis:
⏺ Present Scenario:
Gold (XAUUSD) FOREXCOM:XAUUSD has been flat (sideways) and choppy inside the range (4500 - 4300) for a long time. There is either accumulation or distribution happening inside the range of consolidation (ROC). There will be two back-to-back high-impact events on Thursday and Friday. The events are Core PPI m/m and Core CPI m/m, respectively. On a higher timeframe, there is a probable formation of a head-and-shoulders (H&S) pattern . Probably, the present consolidation is the last phase of shoulder formation. The view is indecision unless there is a sustainable breakout or breakdown.
🟢 Bullish Scenario:
If the price sustains above 4450, then weak bullish targets would be - 4475 and 4500. The region (4500 - 4475) would be a strong resistance zone (SRZ). Next, if the price breaks out above 4500, then the strong bullish targets would be - 4525, 4550, 4575, and 4600.
🔴 Bearish Scenario:
If the price sustains below 4300, then weak bearish targets would be - 4325 and 4300. The region (4325 - 4300) would be a strong support zone (SSZ). Next, if the price breaks down below 4300, then the strong bearish targets would be - 4275, 4250, 4225, and 4200.
🟡 No Trading Zone: (4450 - 4350).
⏺ Range of Consolidation (ROC): (4500 - 4300).
Here, 4400 is the median of the ROC. The median works like a trading session sentiment evaluator. The price trading above the median would offer bullish sentiment, while the price trading below the median would trigger bearish sentiment within the ROC.
● Events:
- 07 Sep (Mon): No events.
- 08 Sep (Tue): NFIB Small Business Index (03:30 PM IST, 🔵 Low Impact).
- 09 Sep (Wed): ADP Weekly Employment Change (05:45 PM IST, 🔵 Low Impact). 10-year Bond Auction (10:31 PM IST, 🔵 Low Impact).
- 10 Sep (Thu): Core PPI m/m (06:00 PM IST, 🔴 High Impact). Unemployment Claims (06:00 PM IST, 🟠 Medium Impact). Existing Home Sales (07:30 PM IST, 🔵 Low Impact). Natural Gas Storage (08:00 PM IST, 🔵 Low Impact). 30-year Bond Auction (10:30 PM IST, 🔵 Low Impact).
- 11 Sep (Fri): Core CPI m/m (06:00 PM IST, 🔴 High Impact). Prelim UoM Consumer Sentiment (07:30 PM IST, 🟠 Medium Impact). Federal Budget Balance (11:30 PM IST, 🔵 Low Impact).
● Intraday, Weekly, and Monthly Bias
Establish bias with respect to the opening price (of the particular session - Intraday, Weekly, and Monthly). If the price sustains above the opening price, then don't think of shorting. Look for bullish trades only. On the contrary, if the price sustains below the opening price, then don't think of going long. Look for bearish trades in that case.
● Disclaimer + End Note
- All the analyses would fail in the case of a major gap up, gap down, or price structure anomaly. Thus, practice PRAGMATISM in the live session.
- Trade only if there is a set-up. Remember, not trading is an extension of the trading activity.
- Mark your points. Trade your points. Price is GOD. Anything can happen in the markets. Thus, trade what you see, not what you believe.
- Always PRACTICE RISK MANAGEMENT. Always PROTECT YOUR CAPITAL. Be RESPONSIBLE.
- Be Strategic. Be Courageous. Be Patient. Be Wise.
- Every day is a new day. Thus, do not carry the baggage of past successes or failures. Leave the gardens of winning and losing. Establish yourself in equanimity. Always think from a new perspective.
- Let the joy of trading drive your effectiveness, not greed or fear. Believe in Possibilities.
Happy Trading! Short 
Gold M30 Retest: 4,390 Base Mitigation Before 4,485 Expansion?
Market Overview
• Macro Driver: Spot Gold trades around $4,412 on Thursday, September 10, 2026, consolidating within an expanding channel structure. Global financial markets are bracing for critical US inflation and labor market data today, featuring the August Producer Price Index (PPI) alongside weekly Initial Jobless Claims. With tomorrow's Consumer Price Index (CPI) looming, institutional players are rebalancing liquidity ahead of next week's crucial FOMC interest rate decision.
• Market Condition: Institutional order flow shows an active re-accumulation cycle. Following the liquidity flush that formed a Weak Low at 4,342.04, smart money delivered an aggressive buy-side displacement (Bullish CHoCH), lifting price out of the channel lows. The market is now executing a corrective mitigation into local demand to engineer volume for a larger expansion leg.
Technical Context
• Structure: Broadening Channel Re-Accumulation. On the M30 timeframe, Gold formed a local bottom at 4,342.04 (Weak Low) and broke short-term structure upward through a Bullish CHoCH. Price is currently consolidating between the descending channel resistance line and local demand arrays.
• Liquidity & Imbalance: Price is currently hovering at 4,412.79. The projected delivery points to an intraday corrective dip into the newly formed Demand Base (4,385.00 – 4,395.00 grey box). A confirmed lower-timeframe absorption here is positioned to drive a breakout through the Strong High / Resistance Block (4,435.00 – 4,448.50) and expand toward the Premium Target Pool (4,480.00 – 4,495.00).
Key Zones
• Macro Overhead Supply Target (Top Blue Box): 4,480.00 – 4,495.00
• Intermediate Resistance / Strong High Floor (Middle Blue Box): 4,435.00 – 4,448.50
• Current Market Price: 4,412.79
• Immediate Demand / Mitigation Base (Grey Box): 4,385.00 – 4,395.00
• Structural Accumulation Floor (Weak Low Swept): 4,342.04
Trading Plan (IF–THEN)
• IF price completes the corrective pullback into the 4,385.00 – 4,395.00 Demand Base AND validates lower-timeframe (M5/M15) bullish displacement/CHoCH -> THEN look to execute Long positions, targeting 4,440 and expanding directly toward the 4,480.00 – 4,495.00 upper institutional target pool.
• IF price prints an M30 candle close below 4,375 -> THEN the bullish continuation setup is delayed, exposing a deeper retest of the 4,345–4,350 discount liquidity shelf.
MMFLOW View
• Bias: Pro-Trend Bullish Demand Mitigation. Rather than chasing green candles near descending channel resistance ahead of US PPI, mathematical edge favors buying confirmed structural pullbacks inside the 4,390 demand base to ride the macro expansion.
Are you looking to buy the 4,390 demand mitigation, or waiting for a confirmed breakout above 4,448? Long 
 Long
Long
 Long
Long
XAUUSD (1H) – SMC Market Analysis10-Sept 26 Disciple-fxXAUUSD (1H) – SMC Market Analysis10-Sept 26
Educational analysis only — not financial advice.
Market Structure: Bullish (short-term), inside a larger range
Price broke structure (BOS) to the downside from the supply zone near 4460–4480, swept down to ~4360, then began printing higher lows — visible in your bullish trendline. That shift from lower-highs/lower-lows into higher-lows is an early bullish CHoCH signal, but it's happening inside a broader range bounded by the 4460–4480 supply zone above and the 4335–4345 key zone below.
Key Support & Resistance
Resistance 1: 4440 (Equal-High / Liquidity Pool)
Resistance 2: 4460–4480 (UN-MEG-SUPPLY zone)
Support 1: 4390–4410 (OTE/POI — where price is currently sitting)
Support 2: 4335–4345 (lower Key zone)
Major support: ~4300 (liq zone $$)
Liquidity Zones
Buy-side liquidity resting above the Equal-High at ~4440 — this is the obvious magnet for a short-term push.
Sell-side liquidity sitting way below at ~4300, untapped for now.
BOS / CHOCH / FVG / Order Blocks / Sweeps
BOS confirmed on the move down to ~4360 (marked on your chart), ending the corrective leg from the 4480 high.
Bullish trendline + higher lows since that BOS point suggests an internal CHoCH is forming, not yet confirmed on a higher timeframe.
Current OTE/POI zone (4390–4410) is acting like a demand/order block — price is reacting off it right now.
Watch for a liquidity sweep of the 4440 equal-highs before any real move toward supply; that's the classic SMC "grab then reverse or continue" spot.
Best Entries
Buy (with trend): 4395–4405 on a bullish rejection candle off the OTE zone, riding the trendline.
Sell (counter-trend, only on confirmation): 4460–4480 if price sweeps the 4440 liquidity and shows rejection at supply.
Stop Loss & Targets
Buy: SL ~4360–4370 (below trendline/BOS low), TP1 4440 (liquidity pool), TP2 4460 (supply zone edge), TP3 4480–4500.
Sell: SL ~4495–4500 (above supply), TP1 4440, TP2 4400 (OTE), TP3 4360.
(Convert the price distance to your broker's actual pip value — on gold, 50–100 "pips" is often only $5–10, which is tight for this volatility; size your SL to the structure, not a fixed pip count.)
Risk:Reward
Buy setup: risking ~35–40 pts for a potential 35–95 pts to TP1–TP3 → roughly 1:1 to 1:2.5 depending on target.
Sell setup: risking ~20–30 pts for 20–120 pts → roughly 1:1 to 1:4, but it's the lower-probability, counter-trend trade.
Bullish/Bearish Probability
Bullish continuation (toward 4440+): ~60%
Bearish rejection from supply: ~40%
This favors the buy-side bias while price holds above the OTE zone, with the caveat that the bigger picture is still range-bound below 4480.
Retail Trap Areas
The 4440 equal-highs are a classic retail buy-stop trap — breakout buyers chasing there risk getting swept before any real continuation.
Round number 4400 attracts impulsive entries without confirmation.
Early trendline breaks (a single wick below it) can shake out longs before the real move.
Beginner-Friendly Explanation
Price fell hard, found buyers, and has been climbing in small steps (higher lows) toward a ceiling of old highs at 4440. Above that sits an even bigger seller zone at 4460–4480. Right now price is resting near a "discount" zone where buyers have stepped in before (4390–4410). The safest read: wait for price to either bounce clearly off this zone (buy) or spike into 4440 and get rejected (sell), rather than guessing in the middle.
Final Verdict: WAIT → BUY bias on confirmation
Confidence: 6/10. Price is sitting right in the OTE zone with a bullish trendline intact, but no clear rejection candle yet on the chart. A confirmed bullish close off 4395–4405 tips this toward BUY; a break below 4360 invalidates the bullish structure entirely.
If price stays above 4360, my bias remains bullish.


