XAGUSD Is Pressing Higher — 67.28 Could Be the TriggerIf I look at XAGUSD right now, the most interesting part is not the recent bounce itself, but the way buyers are gradually pushing price back toward resistance without losing the support structure underneath.
The macro backdrop is still giving silver some support. A softer U.S. dollar continues to help precious metals, while geopolitical uncertainty keeps defensive demand alive. At the same time, stronger Chinese trade activity remains a positive factor for silver’s industrial-demand outlook. The main risk still comes from U.S. inflation and Fed expectations, so volatility could remain elevated.
On the H3 chart, price is holding above the 65.39–66.11 immediate support zone and is now pressing toward 67.28. What stands out is that the latest pullbacks have stayed relatively shallow, suggesting sellers are struggling to regain control. The Ichimoku structure is also improving, while the broader support base around 62.80–63.40 remains well protected.
For me, 67.28 is the key level now. If buyers can break and hold above it, the market could shift from consolidation into a stronger continuation phase, opening the way toward 68.50–69.00 first and eventually the major resistance area around 70.80–71.20.
As long as XAGUSD continues to hold above the immediate support zone, I see the current structure as pressure building beneath resistance rather than a market preparing to roll over. Sometimes the breakout becomes obvious only after the market has spent enough time quietly absorbing supply.  Long
Long
 Long
Long
INDNIPPON
Symbol: INDNIPPON (India Nippon Electricals Limited) — Daily Timeframe (NSE)
Current Price: ₹1,313.30 (-4.61% intraday consolidation)
Market Structure: Following a strong macro uptrend from the structural low of ₹545.30, the stock formed a pullback base into local support and is now attempting a fresh breakout expansion above its recent peak level.
Key Technical Levels
Entry Zone: Above ₹1,313.60 – ₹1,346.70 (Marked as "ENTRY ABOVE" for breakout confirmation beyond recent swing high)
Stop Loss (SL): ₹1,213.00 (Marked as "STOP LOSS" below the consolidation base support)
Intermediate Target: ₹1,582.80 (Horizontal projection level)
Macro Extended Target: ₹1,703.50 (Upper green target channel projection)
Trade Bias & Summary
The stock remains in a well-defined uptrend characterised by higher highs and higher lows. A sustained move above the ₹1,313.60 breakout trigger signals bullish continuation, opening up path toward the ₹1,582 and ₹1,703 upside targets while maintaining defined risk below the ₹1,213 support level.
Disclaimer: This post is for educational and technical analysis purposes only and does not constitute financial or investment advice. Always execute proper risk management and position sizing on every trade.  Long
Long
XAUUSD: Buyers Are Still in ControlConsidering both the macro backdrop and technical structure, I still maintain the view that XAUUSD remains in an uptrend. The short-term pullbacks have not been strong enough to alter the broader structure and instead appear to reflect the market absorbing selling pressure before its next move.
Fundamentally, gold continues to benefit from a weaker U.S. dollar and persistent safe-haven demand as geopolitical tensions remain elevated. Although U.S. Treasury yields are still high and upcoming inflation data could increase volatility, gold has remained relatively resilient. This suggests that defensive capital is still flowing into the market and buyers have not stepped away.
On the H1 chart, the 4,350–4,365 area continues to serve as an important support base, reinforced by the ascending trendline that has repeatedly supported price. XAUUSD is also holding above the Ichimoku area around 4,392–4,397, keeping the bullish structure intact. As long as this support framework remains protected, I believe the probability still favors further upside.
The next key objective sits at 4,495–4,500 — a major psychological resistance zone where price has previously shown a strong reaction. A decisive breakout above this area would further strengthen the bullish case.
Overall, my preferred strategy remains BUY on pullback rather than selling against the prevailing trend. As long as XAUUSD holds above 4,350–4,365, the short-term advantage remains with buyers, and 4,500 stays firmly in focus as the next major target.  Long
Long
ORCHID PHARMA (NSE) — BULLISH BREAKOUTChart: 1D | Orchid Pharma Limited | CMP: ₹1,024.9 (+6.11%) (Dated 09.09.2026)
Setup:
Orchid Pharma rallied sharply from the ₹500 zone earlier this year to touch highs near ₹1,133, after which it entered a tightening consolidation — forming a symmetrical/descending triangle pattern.
Key Levels:
Demand Zone: ₹960 – ₹1,025 (expected retracement/reaction area)
Stop Loss (SL): ₹875 (below demand zone — invalidates setup)
Target 1 (T1): ₹1,250
Trailing Stop Target (TSL): ₹1,370
Risk-Reward:
Entry near demand zone (~₹1,000) with SL at ₹875 gives a risk of ~₹125. Target 1 at ₹1,250 offers a reward of ~₹250 (~2:1 R:R), with TSL extension toward ₹1,370 for trend-followers.
Invalidation:
A daily close below ₹875 would invalidate the bullish structure and suggest deeper correction.
Not financial advice — for educational/idea-sharing purposes only. Please do your own due diligence before trading.
THURSDAY COULD TRAP THE MOST CONFIDENT GOLD SELLERS. HERE’S WHY.Thursday and Friday could completely change the story for Gold this week. With PPI and CPI ahead, volatility is already expected, but what interests me more is the structure Gold has quietly built before these events. Right now, the chart is giving sellers almost every reason to believe that another major drop is coming, and that is exactly what makes me suspicious. There is one thing happening inside this bearish structure that I believe most traders are overlooking, and if I am reading the psychology correctly, the traders who currently feel the most confident could soon become the liquidity for Gold’s next major move.
If you look at the price behavior since last Thursday, 3 September, the structure still looks bearish. Friday’s NFP gave us a strong sell off and after that Gold continued forming lower highs. The first major lower high was around $4448, the second one came around $4443, and today we formed another one around $4432. So from a normal technical perspective, sellers have enough reasons to believe that Gold should continue lower.
But this is exactly where the psychology becomes interesting for me. On Wednesday, Gold swept our important $4365 area and then gave us a very strong bullish recovery. That recovery tells us something important. If buyers were genuinely weak, I don’t think we would have seen such an aggressive recovery after taking liquidity from that area. Somewhere buyers have shown that they are still interested and capable of pushing the market higher.
Now look at the situation from the sellers’ side. They are getting more and more confident because almost everything they are seeing supports their bearish view. Last week’s high around $4510 is still protected, Gold is trading below the major psychological level of $4500, multiple lower highs have formed, and those lower highs are now creating a very obvious trendline. So naturally, more traders are becoming comfortable with selling and expecting another major move lower.
And this is exactly what makes the current situation interesting.
According to my psychology, I am bullish for Thursday and I believe this bearish structure can break. If that happens, we could see a strong upside continuation, potentially starting from the Asian session itself. But I am not interested in buying blindly just because I expect a breakout. I need the market to confirm my idea first.
The main level I am watching is $4417. I want to see Gold hold above this area and then give us a strong bullish displacement candle or a clean bullish engulfing candle on the 30 minute timeframe. If buyers can do that and price breaks the descending structure with strength, then I will start looking for continuation toward $4437, followed by $4453, and eventually the $4464 to $4475 area.
There is another reason why I like this setup psychologically. Gold has been trading below the $4450 area since around last Friday’s close. $4450 is also an important mini psychological number, so sellers have had enough time to become comfortable with the idea that the market is going lower. The longer price stays below an important level while continuously forming lower highs, the stronger that bearish confidence becomes. But once an obvious structure like this breaks with genuine displacement, those same sellers can become the liquidity that helps price accelerate higher.
That is the move I want to catch.
If Gold gives us a clean breakout with strong confirmation, I will be comfortable looking for a buy. If the market breaks out and then gives us a proper retest where buyers defend the level again, that can give us an even cleaner opportunity. The important thing is that I don’t want to predict the breakout blindly. I want buyers to prove themselves first.
Also remember that just because we have three lower highs does not mean a breakout is guaranteed. What matters is how price behaves when it attacks that structure. I want to see strong bullish displacement, acceptance above the breakout area and most importantly, sellers failing to push price back below it. If those things happen together, then for me the probability of continuation becomes much stronger.
So the entire plan for Thursday revolves around $4417. As long as Gold is holding and accepting above this level, my plan will remain bullish and I will continue looking for buying opportunities. If price comes below $4417 and starts accepting below it, especially after attempting a breakout, then I will understand that buyers are failing to sustain the higher prices and that is when I will reconsider my bullish view instead of forcing the trade.
Overall, Thursday and Friday can be very important days for Gold. Technically the market is giving sellers plenty of confidence, but psychologically I believe that confidence itself can become the reason for the next trap. If buyers confirm above $4417 and this trendline finally breaks with strength, I believe we can see a very good upside move over the next one or two trading days.
So stay active during the Asian session and don’t rush the entry. Wait for the market to confirm what we are expecting and then take advantage of the move with proper risk management and money management.
Good luck everyone. I hope you all have a profitable trading day. ❤️
And let me know in the comments, what’s your view on Gold for Thursday? 👀
 Short
Short
NIFTY : Trading Plan | 10-Sep-2026 | SENSEX Expiry WatchEducational analysis | 15-minute chart | Gap Up, Gap Down & Flat Opening scenarios
Market Structure
NIFTY’s attached chart shows a declining structure with lower highs and lower lows. Price is now approaching an important support area, making confirmation more useful than anticipating either a reversal or a fresh breakdown.
Displayed reference price: 23,462.15
Opening decision zone: 23,433–23,457
The working bias remains cautious to bearish while recovery attempts fail below overhead resistance. However, holding the decision zone could produce a relief rally.
• Sustaining above 23,457 can support a recovery toward 23,557.
• Reclaiming 23,557 can open the path toward 23,660.
• Acceptance below 23,433 can expose 23,287.
SENSEX expiry context: Verify that 10-Sep-2026 is the relevant contract expiry under the exchange’s current calendar. If confirmed, monitor possible volatility spillovers through shared heavyweight stocks. SENSEX expiry does not mean NIFTY options also expire that day, nor does it guarantee a particular market direction.
Key Levels With Trading Tips
23,660 | Upper Resistance / Recovery Objective
This is the upper resistance reference marked on the chart. A rally reaching it may face profit-booking or renewed selling.
Trading tip: Consider protecting bullish profits near this level. Fresh bearish setups require rejection and follow-through; a touch alone is not a sell signal. A sustained breakout and successful retest would weaken the immediate bearish bias.
23,557 | Previous Intraday Support / Potential Resistance
Although labelled as intraday support on the chart, this level is now above the displayed price. Until reclaimed, it should be monitored as potential resistance.
Trading tip: Watch for a support-to-resistance flip. A failed reclaim can favour sellers, while a close above followed by a successful retest can support continuation toward 23,660.
23,462.15 | Displayed Price / Gap Reference
This is the reference used for the opening-gap calculations below, not a standalone support or resistance signal.
Trading tip: Check the official previous-session close before classifying the gap. The final intraday candle’s displayed close can differ from the official closing value.
23,457 | Upper Boundary of the Opening Decision Zone
Holding above this boundary would be an early sign of stabilisation, but it would not by itself reverse the broader downtrend.
Trading tip: Prefer a hold or retest above 23,457 followed by a higher low. Avoid buying simply because price briefly crosses the boundary.
23,433 | Lower Boundary / Marked Daily Support
The chart identifies this as important daily support. It is the main breakdown trigger in this plan, although the daily timeframe should be checked separately.
Trading tip: Distinguish a wick below support from acceptance below it. A 15-minute close underneath followed by a failed reclaim provides clearer bearish confirmation.
23,287 | Lower Intraday Support / Downside Objective
This is the next major marked support below the opening decision zone. A decline toward it could attract short covering.
Trading tip: Avoid chasing fresh shorts directly into support. Protect bearish profits and assess whether price forms a base or breaks down again.
Scenario 1: Gap-Up Opening by 100+ Points
Indicative opening: 23,562 or higher, based on the displayed reference price.
A 100-point gap up would place NIFTY just above 23,557. The important question is whether this level becomes support or the gap fails.
A. Gap Up Holds Above 23,557
• Let the first 15-minute opening range form.
• Watch for a pullback that holds 23,557 and forms a higher low.
• A break of the pullback’s local high can confirm a bullish continuation setup.
• Upside reference: 23,660.
• Invalidation: Loss of the retest swing low and failure to hold the reclaimed level.
Trading tip: Check the distance to 23,660 before entering. If price opens too close to resistance, the available reward may not justify the stop.
B. Gap Up Fails Below 23,557
• If price slips below 23,557, wait to see whether a retest fails.
• Rejection from underneath can support a bearish gap-failure setup.
• Downside references: 23,457, followed by 23,433.
• Only sustained trading below 23,433 would bring 23,287 into focus.
• Invalidation: Reclaim of 23,557 and the failed-retest swing high.
Trading tip: A gap is not required to fill. Trade the confirmed failure of support rather than assuming price must return to the previous close.
C. Gap Up Reaches or Opens Above 23,660
• Rejection at 23,660 followed by a lower high can support a pullback toward 23,557.
• Acceptance above 23,660 and a successful retest would favour recovery continuation.
• No higher target is marked in the supplied chart; use fresh intraday structure rather than inventing a fixed objective.
• Invalidation should be beyond the relevant rejection high or bullish retest low.
Trading tip: Do not automatically short a large gap up. Strong acceptance above resistance can trap traders who sell solely because the market appears stretched.
Scenario 2: Gap-Down Opening by 100+ Points
Indicative opening: 23,362 or lower, based on the displayed reference price.
A 100-point gap down would place price below 23,433 and closer to 23,287. This favours caution about chasing further downside after the opening move.
A. Gap Down Remains Below 23,433
• Allow the initial opening volatility to settle.
• Prefer a rebound that fails to reclaim 23,433–23,457.
• A rejection followed by a lower low can support bearish continuation.
• Downside reference: 23,287.
• Invalidation: A sustained reclaim of the decision zone, with the stop beyond the retest swing high.
Trading tip: If price does not offer a rebound, do not force a short. The remaining distance to 23,287 may be too small for a sensible trade.
B. Gap Down Reclaims 23,433–23,457
• A recovery above 23,433 is an initial improvement.
• Stronger confirmation comes from reclaiming 23,457 and holding the zone on a retest.
• A higher low can support a countertrend recovery setup.
• Upside reference: 23,557; above that, 23,660 becomes relevant.
• Invalidation: Loss of the recovery swing low.
Trading tip: Treat this as a relief-rally setup until stronger structure develops. Consider reducing exposure at 23,557 rather than assuming a complete trend reversal.
C. Opening Near or Below 23,287
• If support holds, wait for a base, a reclaim and a higher low before considering a recovery.
• A confirmed recovery can bring 23,433–23,457 back into focus.
• If price accepts below 23,287 and fails to reclaim it, the bearish structure remains intact.
• The chart provides no lower marked target; establish fresh intraday references before considering continuation.
• Invalidation belongs beyond the reversal low or failed-retest high, depending on the setup.
Trading tip: Once an opening gap has already reached the downside objective, reset the plan. Do not treat an already-achieved target as remaining opportunity.
Scenario 3: Flat Opening
Working definition: An opening within approximately 30 points of the displayed reference price. Position relative to 23,433–23,457 takes priority.
A. Opening Above 23,457 and Holding the Zone
• Watch whether the first pullback respects 23,433–23,457.
• A higher low followed by a local breakout can support a bullish recovery setup.
• First upside reference: 23,557.
• A successful reclaim of 23,557 can extend the recovery toward 23,660.
• Invalidation: Loss of the setup’s swing low and failure of the support zone.
Trading tip: Because the broader structure is bearish, require evidence of buying strength. Merely opening above 23,457 is not enough.
B. Price Rotates Inside 23,433–23,457
• Treat this as a decision zone with elevated whipsaw risk.
• Avoid repeated entries inside the narrow band.
• Wait for a close outside the zone and a confirming retest.
Trading tip: Repeated wicks through both boundaries indicate uncertainty. Waiting for a cleaner move is a valid trading decision.
C. Breakdown Below 23,433
• Look for a 15-minute close below support.
• A failed retest of 23,433 can confirm the bearish setup.
• Downside reference: 23,287, subject to any fresh intraday support that forms along the way.
• Invalidation: Reclaim of the broken level and the retest swing high.
Trading tip: Skip a breakdown entry if the confirmation candle is already too extended. A good directional view can still produce a poor trade if the entry is late.
D. False Breakdown and Recovery
• If price briefly breaks 23,433 but then reclaims the full 23,433–23,457 zone, watch for trapped sellers.
• A successful retest and higher low can support a recovery toward 23,557.
• Invalidation: A move back below the reversal swing low.
Trading tip: Do not reverse direction on every candle. Require a fresh, complete setup before switching from bearish to bullish.
For openings between roughly 30 and 100 points from the reference, apply the same level-based rules rather than forcing the session into a gap category.
Trading Tips — SENSEX Expiry Context
• Use NIFTY’s own price structure as the primary trigger. SENSEX movement is context, not a substitute for confirmation.
• Watch shared heavyweight participation. A move supported by several constituents is generally more convincing than one driven by a single stock.
• If NIFTY and SENSEX diverge, reduce conviction rather than assuming one must immediately follow the other.
• Use the 15-minute chart for structure; the 5-minute chart may help refine a confirmed entry.
• In this plan, “acceptance” means a close beyond a level followed by a hold or successful retest—not a brief spike.
• Treat the chart’s projected arrows as possible paths, not forecasts or timing guarantees.
• Avoid forcing trades during sudden volatility bursts. Wait for spreads and price structure to stabilise.
Risk Management Tips
• As a conservative educational guideline, limit risk per setup to 0.25%–0.50% of trading capital.
• Consider a daily loss cap of 1%, or stop after two full-stop losses, whichever occurs first.
• Prefer at least 1:2 planned reward-to-risk to a realistic exit after estimated costs. Skip setups that do not offer sufficient room.
• Size positions from the actual stop distance and permitted rupee loss. If the minimum tradable lot exceeds the risk budget, skip the trade.
• Place the stop beyond the structure that invalidates the setup; never widen it simply to avoid booking a loss.
• Do not average into losing positions or increase size to recover earlier losses.
• When using NIFTY options, check that contract’s own expiry. Time decay, implied volatility and gamma depend on the contract, not just on SENSEX’s expiry.
• An index-level stop is not an option-premium stop. Define both the underlying invalidation and a maximum rupee-loss exit.
• Prefer liquid contracts with manageable bid–ask spreads. Stops can suffer slippage, particularly during fast moves.
• Avoid unhedged option selling and account for combined exposure if trading both NIFTY and SENSEX.
• Close intraday positions according to a predefined exit time rather than allowing an unsuccessful trade to become an overnight position.
Quick Session Roadmap
Above 23,557: Monitor recovery toward 23,660.
Above 23,457, with the zone holding: Monitor a recovery attempt toward 23,557.
Inside 23,433–23,457: Wait for confirmation.
Below 23,433 with acceptance: Monitor downside toward 23,287.
Beyond 23,660 or below 23,287: Reassess using fresh structure; no further targets are marked.
Educational analysis only, not personalised investment advice or a guarantee of returns. All levels refer to the NIFTY underlying index and are taken from the supplied chart. Verify live prices, the official close, news and the exchange expiry calendar before trading. Long 
Sensex : Explained Trading Scenarios for 10-Sep-2026 Educational price-action roadmap based on the attached 15-minute chart.
Market Structure & Working Bias
The chart shows a strong declining structure, with lower highs, lower lows and repeated selling pressure. The working bias remains cautious to bearish unless price starts reclaiming resistance and holding it on retests.
The displayed reference price is 74,891.54 . The immediate decision zone is 74,839–75,032 .
• Below 74,839: Downside continuation becomes the primary setup to monitor.
• Between 74,839 and 75,032: Expect two-way movement and possible false breakouts.
• Above 75,032: A recovery toward 75,366–75,425 becomes possible.
• Above 75,425 with acceptance: Reassess the bearish intraday bias rather than automatically selling rallies.
Expiry note: This plan covers the requested 10-Sep-2026 session. Verify the actual SENSEX contract expiry and any exchange calendar changes before applying expiry-specific strategies. All levels below refer to the underlying index, not option premiums.
Key Levels & Trading Tips
1. 75,366–75,425 | Upper Intraday Resistance Zone
This is the major overhead supply zone marked on the chart. A recovery into this area may face selling, but a sustained breakout would weaken the immediate bearish structure.
Trading tip: Do not short simply because price touches resistance. Look for rejection followed by a break of the rejection candle’s low. If price closes above 75,425 and holds the retest, avoid fighting the breakout.
2. 75,032 | Opening Resistance / Recovery Trigger
A sustained move above this level can shift the immediate intraday balance toward a recovery. Failure to hold above it would favour sellers again.
Trading tip: Prefer a 15-minute close above 75,032 followed by a successful retest. A brief wick above the level is not sufficient confirmation.
3. 74,891.54 | Displayed Reference Price
Use this price to classify the opening gap. It is not, by itself, a confirmed support or resistance level.
Trading tip: Measure the gap from the verified previous-session close before the market opens. The calculations in this plan use the chart’s displayed reference price.
4. 74,839 | Immediate Support / Breakdown Pivot
This is the key lower boundary of the opening decision zone. Holding it can keep a recovery attempt alive; losing it can expose the lower support band.
Trading tip: Watch the retest after a breakdown. Failure to reclaim 74,839 offers better confirmation than chasing the first fast red candle.
5. 74,520–74,612 | Lower Intraday Support Zone
This is the next marked demand area below 74,839. It may produce a pause, short covering or a reversal attempt.
Trading tip: Consider reducing bearish exposure as price enters support. Fresh shorts inside the zone can have poor reward-to-risk; a cleaner continuation setup requires a break below 74,520 and a failed reclaim.
6. 74,037 | Deeper Downside Reference
This becomes relevant if 74,520 breaks decisively and downside momentum continues. It is a conditional extension objective, not an assured destination.
Trading tip: Trail profits rather than assuming price must reach this level. After an extended decline, avoid initiating fresh shorts directly into a marked downside objective.
Scenario 1: Gap-Up Opening by 300+ Points
Approximate opening threshold: 75,192 or higher, using 74,891.54 as the reference.
A gap up would place price above 75,032, potentially bringing the upper resistance zone into play early.
A. Gap Up Holds Above 75,032
• Allow the first 15-minute candle to establish an opening range.
• Watch for a pullback that holds 75,032, followed by a higher low.
• A break above the pullback’s local high can confirm a bullish recovery setup.
• Upside reference: 75,366–75,425.
• Invalidation: Loss of the retest swing low and failure to hold the reclaimed level.
Trading tip: If the opening is already close to 75,366, the remaining upside may be too small relative to the stop. Let the setup go rather than chase it.
B. Gap Up Rejects 75,366–75,425
• Watch for a failed breakout or a clear rejection candle.
• A break of the rejection swing low can support a bearish reversal setup.
• Downside references: 75,032, then 74,839 if selling continues.
• Invalidation: A sustained reclaim of the resistance zone, with the stop beyond the rejection swing high.
Trading tip: An upper wick alone is not a reversal. Look for follow-through selling before considering a counter-gap trade.
C. Gap Up Fails Below 75,032
• If price loses 75,032 and fails to reclaim it on a retest, the recovery has weakened.
• First downside reference: 74,839.
• Below 74,839 with acceptance: 74,612–74,520 becomes relevant.
• Invalidation: A reclaim of 75,032 and the failed-retest swing high.
Trading tip: Do not assume every gap must fill. Trade the loss of support, not the gap-fill expectation.
If the opening is above 75,425:
A successful retest of 75,425 would favour continuation rather than an automatic short. The chart provides no higher marked target; use fresh intraday structure and a trailing exit. A return below the zone would signal a possible failed breakout.
Scenario 2: Gap-Down Opening by 300+ Points
Approximate opening threshold: 74,592 or lower, using 74,891.54 as the reference.
A 300-point gap down would open inside the marked 74,520–74,612 support band. A larger gap could open below it, so the first task is to identify whether support is being defended or rejected.
A. Opening Inside 74,520–74,612, Followed by Recovery
• Avoid immediately shorting into the support band.
• Watch for price to reclaim 74,612, hold a retest and form a higher low.
• A bullish setup becomes more credible after a break of the local recovery high.
• Upside references: 74,839, followed by 75,032 if 74,839 is reclaimed.
• Invalidation: Loss of the reversal swing low.
Trading tip: This is a countertrend recovery setup. Keep expectations modest and consider partial profit-taking at 74,839 rather than assuming a full reversal.
B. Opening Below 74,520 with a Failed Reclaim
• Let the initial volatility settle.
• Watch for a rebound toward 74,520–74,612 that fails.
• A rejection followed by a lower low can support downside continuation.
• Deeper chart reference: 74,037, with partial exits at fresh intraday supports.
• Invalidation: A sustained reclaim of the broken support band; place the stop beyond the retest swing high.
Trading tip: Avoid chasing a large opening breakdown. A failed retest usually provides a clearer invalidation point.
C. Breakdown Below 74,520 Quickly Reverses
• A swift recovery above 74,520 and then 74,612 can indicate a failed breakdown.
• Consider the recovery only after the reclaimed zone holds.
• Upside references: 74,839, then 75,032.
• Invalidation: A move back below the reversal swing low.
Trading tip: A reclaim without a hold can become another trap. Wait for the retest rather than reacting to one strong green candle.
If the opening is near or below 74,037:
Do not mechanically use 74,037 as a downside target once it has already been reached. Establish a fresh opening range and reassess whether the level acts as support or resistance.
Scenario 3: Flat Opening
For this plan, “flat” means approximately within 100 points of the displayed reference price. The actual position relative to 74,839 and 75,032 takes priority.
A. Price Remains Between 74,839 and 75,032
• Treat this as a decision range rather than a directional signal.
• Avoid entries in the middle of the range.
• Wait for a confirmed breakout or breakdown and retest.
Trading tip: Repeated movement across both boundaries signals indecision. On an expiry session, standing aside can be better than repeatedly paying for false moves.
B. Breakout Above 75,032
• Look for a 15-minute close above resistance.
• Prefer a retest that holds, followed by renewed buying.
• Upside reference: 75,366–75,425.
• Invalidation: Loss of the retest swing low and failure back inside the opening range.
Trading tip: Skip the trade if the breakout candle is so large that the stop leaves insufficient reward to the next resistance.
C. Breakdown Below 74,839
• Look for a 15-minute close below support.
• A failed retest from underneath can confirm the bearish setup.
• Downside references: 74,612, then 74,520.
• Below 74,520 with a failed reclaim: 74,037 becomes the extension reference.
• Invalidation: Reclaim of 74,839 and the retest swing high.
Trading tip: Treat 74,612–74,520 as a potential reaction zone. Do not hold for the deeper extension unless price confirms a fresh breakdown.
For openings between 100 and 300 points from the reference, use the same level-based rules rather than forcing the session into a gap category.
Trading Tips
• Use the 15-minute chart for structure; a 5-minute chart can refine entries after confirmation.
• Define “acceptance” as a close beyond a level followed by a hold or successful retest—not a momentary spike.
• Use chart arrows as possible paths, not forecasts or timing promises.
• Trade the setup that develops, not the direction you preferred before the open.
• After a failed breakout, wait for a fresh structure before re-entering.
• No clean confirmation or no adequate reward-to-risk means no trade.
Risk Management Tips
• As a conservative educational guideline, risk no more than 0.25%–0.50% of trading capital on one setup.
• Consider stopping for the day after two full-stop losses or a predefined daily loss limit, such as 1%, whichever occurs first.
• Prefer setups offering at least 1:2 planned reward-to-risk to a realistic exit, after estimated costs.
• Place stops beyond the structure that invalidates the trade. Reduce position size if that stop is wider; never widen it simply to avoid taking a loss.
• Calculate position size from the permitted rupee loss and estimated loss per lot, including slippage and charges. If the minimum lot exceeds the risk budget, skip the trade.
• Never average into a losing expiry position or use a martingale approach.
• Expiry options can move sharply because of gamma, time decay and implied-volatility changes. A correct index view does not guarantee an option profit.
• Index-point stops do not translate directly into option-premium stops. Define both the underlying invalidation and a maximum rupee-loss exit before entering.
• Prefer liquid contracts with manageable spreads; avoid unhedged short options.
• Stops may execute worse than expected during fast moves. Keep exposure small enough to tolerate slippage.
Session Summary
Above 75,032: Monitor recovery toward 75,366–75,425.
Between 74,839 and 75,032: Wait for directional confirmation.
Below 74,839: Monitor downside toward 74,612–74,520.
Below 74,520 with acceptance: 74,037 becomes the deeper reference.
Educational analysis only, not a personalised investment recommendation or assurance of returns. Levels are taken from the supplied chart and should be reassessed against live price action, news and the verified exchange calendar.  Long
Long
ATHER ENERGY LTD — 4H Bullish SetupATHER ENERGY 🚀 | Bullish 4H Setup | Pullback to Support + Trend Continuation | 1540 → 1866
Ather Energy is showing a strong higher-high, higher-low structure on the 4H timeframe, supported by a rising moving average. After a sharp bullish move, the stock has entered a healthy consolidation/pullback near an important support zone.
The current structure offers an interesting trend-continuation setup if buyers step in around the marked level.
🎯 Trade Setup
🟢 Entry: ₹1,540
🔴 Stop Loss: ₹1,466
🎯 Target: ₹1,866
📊 Risk : Reward: ~1 : 4.4
🔍 Why I Like This Setup
• Strong underlying 4H bullish trend
• Price maintaining the broader higher-high / higher-low structure
• Pullback after a strong impulsive move
• Price consolidating around a key support/retest zone
• Rising moving average providing dynamic trend support
• Clear invalidation below ₹1,466
• Potential upside toward the previous major resistance/target zone
🚀 Trade Thesis
1540 is the key level to watch.
If the stock successfully holds this area and buyers regain control, a continuation toward ₹1,866 could be on the cards.
The setup is designed with defined downside and asymmetric upside, making risk management particularly important.
Plan the trade. Respect the SL. Let the setup play out.
This is a technical analysis idea, not a guaranteed prediction. Always manage position size according to your individual risk.
 Long
Long
 Long
Long
BSE Ltd: Retest of Demand Zone with 3,660 Upside PotentialThe setup is based on a support-zone retest, with the broader structure offering a favourable risk-to-reward opportunity. A sustained hold above the entry region near ₹3,200 could open the path toward the next major resistance and projected target around ₹3,660.
Trade plan
Entry: ₹3,200
Stop-loss: ₹3,128.50
Target: ₹3,660
Risk: ₹71.50 per share
Potential reward: ₹460 per share
Approximate risk-to-reward ratio: 1:6.4
The trade becomes more attractive if price forms a bullish reversal candle, reclaims the short-term moving average, and sustains above the nearby resistance zone. However, a decisive close below ₹3,128.50 would invalidate the setup and indicate weakness in the demand area.  Long
Long
Short 
XAU/USD 45-Minute Professional Technical Analysis 1. Market Structure
The chart shows a broad bullish recovery structure after the sharp decline toward the 4,340–4,350 area.
The important sequence is:
4,340 → 4,435 → pullback → potential continuation
Recent price action has produced a series of higher lows, keeping the short-term structure constructive.
The latest move shows rejection from approximately 4,430–4,440, followed by a strong bearish candle. This indicates a short-term retracement rather than a confirmed bearish trend reversal.
2. Key Support & Resistance
Major Resistance: 4,430–4,440
This is the immediate supply zone. Price recently rejected this area aggressively.
A decisive 45-minute close above 4,440 would strengthen the bullish continuation setup.
Above 4,440 → next target 4,460.
Immediate Support: 4,380–4,390
This is the first important demand area to monitor.
If buyers defend this zone, the bullish structure remains valid.
Major Support: 4,340–4,350
This is the key structural swing-low area.
A decisive break below this zone would significantly weaken the bullish setup.
3. Market Structure Break
The chart contains several MSB points.
The recent bearish MSB around 4,390–4,400 indicates that short-term momentum temporarily shifted bearish.
However, the subsequent recovery toward 4,430\+ shows that sellers have not yet established full control.
Current structure:
Bullish higher-timeframe structure + short-term bearish retracement.
4. Bullish Scenario
Preferred scenario:
Price retraces toward 4,380–4,390 → buyers defend the zone → bullish reversal → break above 4,430–4,440.
Potential targets:
TP1: 4,420\
TP2: 4,440\
TP3: 4,460\
Extended target: 4,480+
A confirmed 45-minute close above 4,440 would provide stronger bullish confirmation.
5. Bearish Scenario
If price fails to hold 4,380, the correction could extend lower.
Potential downside levels:
4,380 → 4,360 → 4,340
A decisive break below 4,340–4,350 would invalidate the immediate bullish structure and increase the probability of a deeper correction.
6. Trade Bias
Current Bias: Moderately Bullish
I would avoid chasing price around 4,398–4,400 after the rejection from the highs.
The better risk/reward area is around:
BUY ZONE: 4,380–4,390
Look for confirmation such as:
• Bullish rejection candle\
• Bullish engulfing candle\
• Formation of a higher low\
• Bullish MSB\
• Strong momentum expansion
If confirmation appears, the first objective is 4,430–4,440, followed by 4,460.
7. Professional Trade Plan
BUY ZONE: 4,380–4,390\
INVALIDATION: Sustained break below 4,340–4,350\
TP1: 4,420\
TP2: 4,440\
TP3: 4,460
Alternative breakout setup:
BUY after a confirmed 45-minute close above 4,440.
Targets: 4,460 → 4,480
Final Assessment
XAU/USD remains structurally bullish, but the market is currently experiencing a short-term correction after rejection from 4,430–4,440.
The key level is 4,380.
Above 4,380: bullish structure remains intact, with potential targets at 4,440 and 4,460.
Below 4,340: bullish structure becomes invalid and a deeper correction becomes more likely.
Best approach: wait for price to reach a key level and confirm the reaction rather than entering in the middle of the range. Long 
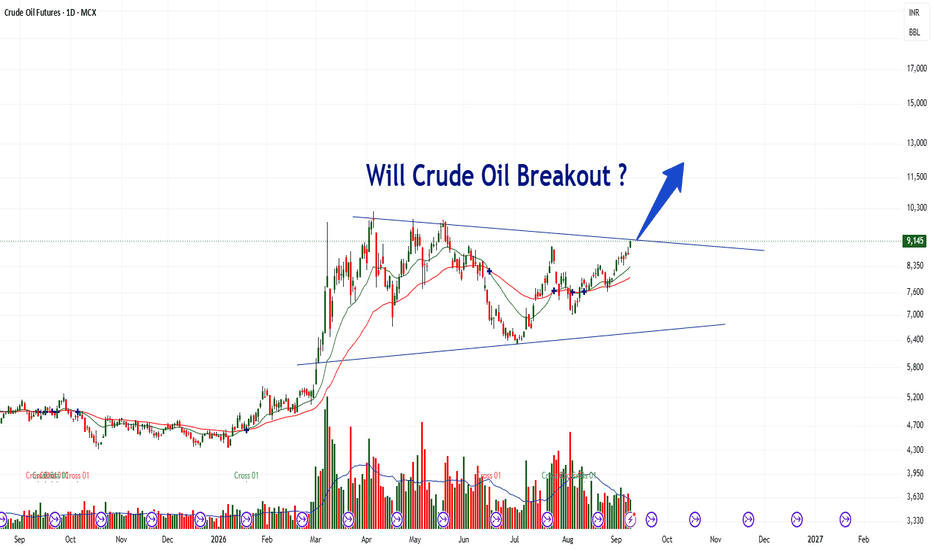
MCX Crude Oil: Will it BREAKOUT ?Crude Oil is currently sitting at a very important technical hurdle, with price approaching the upper boundary of a consolidation pattern that has been developing since the sharp rally seen during March–April 2026.
The interesting part is that this consolidation resembles a Bullish Pennant formation.
📊 What does the chart show?
Crude Oil witnessed a sharp impulsive move higher earlier in 2026, followed by a period of consolidation.
Since the April–June period, price has broadly formed:
🔹 Lower highs — indicating that sellers have been capping rallies.
🔹 Higher lows — indicating that buyers are stepping in at progressively higher levels.
This has resulted in a contracting triangular structure, which is characteristic of a pennant/triangle-type consolidation.
The important question now is:
Will this consolidation resolve on the upside?
🚨 THE BIG HURDLE
The upper trendline has been tested multiple times, particularly around the April–June 2026 highs.
Every previous attempt to move through this zone has encountered selling pressure.
However, the latest price action is different.
Crude has gradually moved higher from the July lows and is now approaching the upper resistance trendline around ₹9,100–₹9,200 on the chart.
The September 9 candle closed around ₹9,129, putting price directly at this crucial zone.
A decisive breakout and daily close above the trendline would therefore be technically significant.
📈 WHAT IF THE BREAKOUT HAPPENS?
If Crude Oil convincingly breaks above the upper trendline with strong price action and volume, it could signal that the multi-month consolidation has ended.
The first indication would be:
₹9,200+ → Breakout confirmation
After that, traders could watch for the previous swing-high zones and potential measured-move targets.
The height of the broader pennant can also be used to estimate a potential breakout objective, although such targets should be treated as projections rather than guaranteed levels.  Long
Long