SUPREMEIND Strong Expansion Above the Descending Trendline🔥 Supreme Industries: Strong Expansion Above the Descending Trendline
📊 MARKET STRUCTURE SNAPSHOT | NSE: SUPREMEIND | DAILY
Closing Price: 3,580.30
Core Trend: Developing Recovery within a Broader Downtrend
Market State: Strong Bullish Expansion / Breakout Attempt
Chart Pattern: Descending Trendline Breakout Attempt
Candlestick Pattern: Strong Bullish Candle
Price Structure: Price has recovered sharply from the lower part of the broader range and has now moved above the long-standing descending trendline visible on the daily chart. The latest session closed at 3,580.30, placing price above the recent 3,500–3,550 region, while the broader chart still contains a series of lower highs from the previous peak.
Technicals: Mixed — short-term bullish momentum within a broader bearish structure
Volume: 469.75K vs 200.05K average — approximately 2.35× average
Moving Average Structure: Full Bearish EMA Stack
CPR & Market Structure: Bullish Zone — Narrow CPR
Next Session CPR: Wide — Pivot 3,502.70 | Top 3,541.50 | Base 3,463.90
Model Reference: 3,580.30
Observation References: 3,895.60 | 4,210.80
Resistance References: 3,657.93 | 3,735.57 | 3,890.83
Support References: 3,425.03 | 3,269.77 | 3,192.13
📚 STWP EDUCATIONAL OBSERVATION
Supreme Industries is showing a strong short-term expansion after recovering from the lower portion of its broader consolidation range. The latest session gained 7.05% and closed at 3,580.30, with volume of approximately 469.75K, around 2.35× the average, indicating substantially higher participation. On the clean daily chart, price has moved above the long-standing descending trendline that has been defining the broader structure, creating an important breakout area for observation. However, the longer-term structure remains mixed because the major EMA sequence is still in a bearish alignment, while the dashboard identifies the broader market structure as ranging and multi-timeframe signals as mixed. RSI around 55.75 has moved into a more positive zone without reaching an extreme reading. The area around 3,657.93–3,735.57 therefore becomes an important reference zone for studying whether the recent expansion develops further, while 3,425.03–3,269.77 remains a useful lower structural reference area.
📚 STWP EDUCATIONAL NOTE
This content is provided strictly for educational and informational purposes only.
The information presented should not be construed as investment advice, research advice, financial advice, a recommendation, solicitation or an offer to buy, sell or hold any security.
Technical analysis and historical price behaviour cannot guarantee or predict future market performance. STWP and the author make no representation or guarantee regarding future price movements, returns, performance or outcomes. Past performance is not indicative of future results.
Kindly consult an appropriately SEBI-registered investment professional.  Long
Long
LGEINDIA Breakout from Descending Triangle with Strong Volume🔥 LG Electronics India: Breakout from Descending Triangle with Strong Volume
📊 MARKET STRUCTURE SNAPSHOT | NSE: LGINDIA | DAILY
Closing Price: 1,696.90
Core Trend: Uptrend
Market State: Bullish Expansion / Breakout
Chart Pattern: Descending Triangle Breakout
Candlestick Pattern: Three Outside Up
Price Structure: Price has moved above the upper boundary of the developing descending-triangle structure and is now trading around 1,696.90, with the breakout accompanied by strong volume. Price remains above VWAP and the complete EMA structure.
Technicals: Bullish
Volume: 1.34M vs 534.53K average — approximately 2.50× average
Moving Average Structure: Full Bullish EMA Stack
CPR & Market Structure: Bullish Zone — Narrow CPR
Next Session CPR: Wide — Pivot 1,687.60 | Top 1,692.20 | Base 1,682.90
Model Reference: 1,696.90
Observation Reference: 1,816.90
Resistance References: 1,708.50 | 1,739.90 | 1,767.10 | 1,799.10
Support References: 1,668.23 | 1,639.57 | 1,620.23
📚 STWP EDUCATIONAL OBSERVATION
LG Electronics India is showing a notable technical expansion after moving above the upper boundary of the descending-triangle structure visible on the daily chart. The latest session closed at 1,696.90, gaining 2.66%, while volume reached approximately 1.34M, around 2.5× the average, providing strong participation during the move. Price is trading above VWAP at 1,687.57 and remains above the 9, 21, 50, 100 and 200-period EMAs, maintaining a full bullish alignment. RSI at 60.76 indicates positive momentum without reaching the extreme zone seen in some of the other recent charts. The Three Outside Up pattern adds further context to the recent price expansion. The immediate area around 1,708.50–1,739.90 is now important for studying whether the breakout structure sustains, while the 1,668.23–1,620.23 region provides the broader reference area for observing subsequent price behaviour.
📚 STWP EDUCATIONAL NOTE
This content is provided strictly for educational and informational purposes only.
The information presented should not be construed as investment advice, research advice, financial advice, a recommendation, solicitation or an offer to buy, sell or hold any security.
Technical analysis and historical price behaviour cannot guarantee or predict future market performance. STWP and the author make no representation or guarantee regarding future price movements, returns, performance or outcomes. Past performance is not indicative of future results.
Kindly consult an appropriately SEBI-registered investment professional.  Long
Long
ATGL: Gas Shortage + Expensive, Long Term View :2-2.5 Year Hold“Gas shortages and Rising prices” Based on Recent Reports from Global Energy Organizations (IEA, OPEC, EIA, Kpler) and market analysts
1. Asian Spot LNG Prices Soar to 45-Month High
Spot LNG (JKM) prices in Northeast Asia have surged to $26.00 per MMBtu, a whopping 150% increase since the start of the year, due to supply disruptions in the Strait of Hormuz and delays in Qatari LNG cargoes
2. European Gas Benchmark (TTF) Soars
Dutch TTF Gas benchmark in the European Union is climbing to €76-€79 per MWh range, the highest since 2023
3.European Gas Storage Worries
The EU's underground gas storage is some 65% to 68% full ahead of the winter, 14 to 16 percentage points less than the five-year historical average of 82%
4. Asian imports at 8-year low
LNG imports by Asia in September are estimated to have dropped to 20.09 million metric tons, the lowest since September 2018, as high prices contained demand
5.Demand impact in India and China
A report by Kpler showed that the imports of China fell to 4.32 million tons and India's imports fell to 1.86 million tons (the lowest since March) in September under pressure of rising spot prices
6. Europe takes cargoes at high premiums Asia is turning away expensive cargoes but Europe increased imports to 7.98 million tons in September but has to buy this gas at very high premiums
7. IEA’s forecast of a significant contraction
The International Energy Agency (IEA), in its September report, has forecasted a net 2.5 million barrels per day (mb/d) contraction in global crude oil demand due to lower consumption caused by high fuel prices
8. OPEC trims growth forecast for fifth time
OPEC has cut its global demand growth forecast for 2026 to just 380,000 barrels per day (0.38 mb/d) in its monthly report
9.Gulf and Saudi production decline
Saudi Arabia’s crude oil production fell to about 6.2 million barrels per day in August from a high of 10 million barrels per day in 2018, the lowest since 1990, due to conflicts along supply routes
10.Economists view on ‘demand destruction’
The high prices of natural gas and diesel are driving up the electricity bill, freight charges and industrial costs, thus leading to a situation of ‘demand destruction’ globally, economists warn
Disclaimer :- I am Not SEBI Register Analyst, All Report Based on My 10 Year Global Market Expireance  Long
Long
GMMPFAUDLR Strong Breakout with Exceptional Volume🔥 GMM Pfaudler: Strong Breakout with Exceptional Volume
📊 MARKET STRUCTURE SNAPSHOT | NSE: GMMPFAUDLR | DAILY
Closing Price: 1,467.00
Core Trend: Uptrend
Market State: Strong Bullish Expansion / Breakout
Chart Pattern: No confirmed chart pattern
Candlestick Pattern: Three Outside Up / Strong Bullish Candle
Price Structure: Price has moved sharply out of the previous consolidation area and is now trading at significantly higher levels. The latest session shows a strong expansion candle with price holding above VWAP and all major EMAs.
Technicals: Strong Bullish
Volume: 1.21M vs 502.63K average — approximately 2.40× average
Moving Average Structure: Full Bullish EMA Stack
CPR & Market Structure: Bullish Zone — Wide CPR
Next Session CPR: Wide — Pivot 1,437.30 | Top 1,452.20 | Base 1,422.50
Model Reference: 1,475.00
Observation References: 1,652.70 | 1,830.40 | 2,008.10
Resistance References: 1,504.67 | 1,542.33 | 1,609.67
Support References: 1,399.67 | 1,332.33 | 1,294.67
📚 STWP EDUCATIONAL OBSERVATION
GMM Pfaudler is showing a pronounced bullish expansion after spending several weeks within a lower consolidation zone. The latest session closed at 1,467, gaining 7.60%, with volume reaching approximately 1.21M, or around 2.40× the average, indicating substantially higher participation during the move. Price is trading above VWAP at 1,437.33 and above the complete EMA structure, with the 9, 21, 50, 100 and 200-period averages maintaining a bullish alignment. Momentum is particularly strong, with RSI at 88.38, CCI at 129.87, Stochastic at 98.28 and ADX at 64.67; these readings demonstrate strong momentum but also place several oscillators in an extended zone that is important to observe. The immediate chart structure is now centred around the 1,467–1,475 area, while the next reference levels are 1,504.67, 1,542.33 and 1,609.67.
📚 STWP EDUCATIONAL NOTE
This content is provided strictly for educational and informational purposes only.
The information presented should not be construed as investment advice, research advice, financial advice, a recommendation, solicitation or an offer to buy, sell or hold any security.
Technical analysis and historical price behaviour cannot guarantee or predict future market performance. STWP and the author make no representation or guarantee regarding future price movements, returns, performance or outcomes. Past performance is not indicative of future results.
Kindly consult an appropriately SEBI-registered investment professional.  Long
Long
AUROPHARMA Bullish Expansion with Short Consolidation Breakout🔥 Aurobindo Pharma: Bullish Expansion with Short Consolidation Breakout
📊 MARKET STRUCTURE SNAPSHOT | NSE: AUROPHARMA | DAILY
Closing Price: 1,734.00
Core Trend: Uptrend
Market State: Bullish Structure / Momentum Expansion
Chart Pattern: Short Consolidation Breakout
Candlestick Pattern: Three Outside Up
Price Structure: Price has maintained a series of higher levels within the broader rising structure and is currently positioned near the upper boundary of the consolidation. The latest session closed at 1,734 with strong momentum and increased volume.
Technicals: Bullish
Volume: 1.21M vs 797.13K average — approximately 1.52× average
Moving Average Structure: Full Bullish EMA Stack
CPR & Market Structure: Bullish Zone — Wide CPR
Next Session CPR: Wide — Pivot 1,714.70 | Top 1,724.40 | Base 1,705.10
Model Reference: 1,734.00
Observation References: 1,847.00 | 1,960.10
Resistance References: 1,753.30 | 1,772.60 | 1,811.20
Support References: 1,695.40 | 1,656.80 | 1,637.50
📚 STWP EDUCATIONAL OBSERVATION
Aurobindo Pharma is displaying a constructive daily structure, with price trading above VWAP and all major EMAs while the 9/21/50/100/200 EMA sequence remains fully bullish. The latest session added 2.60%, taking the closing price to 1,734, while volume reached approximately 1.21M, around 1.52 times the average. Momentum indicators remain supportive, with RSI at 63.24, CCI at 161.31 and Stochastic at 100, although the Stochastic reading also places price in an extended momentum zone that warrants observation. The chart shows a developing symmetrical consolidation structure with price currently near its upper boundary, while the Three Outside Up annotation reflects the recent bullish price behaviour. The immediate technical references around 1,753.30–1,811.20 and the support area around 1,695.40–1,637.50 provide useful zones for studying how the structure develops.
📚 STWP EDUCATIONAL NOTE
This content is provided strictly for educational and informational purposes only.
The information presented should not be construed as investment advice, research advice, financial advice, a recommendation, solicitation or an offer to buy, sell or hold any security.
Technical analysis and historical price behaviour cannot guarantee or predict future market performance. STWP and the author make no representation or guarantee regarding future price movements, returns, performance or outcomes. Past performance is not indicative of future results.
Kindly consult an appropriately SEBI-registered investment professional.  Long
Long
APLAPOLLO Large Symmetrical Triangle + Consolidation 🔥 APL Apollo Tubes: Testing the Upper Boundary of a Long-Term Consolidation
📊 MARKET STRUCTURE SNAPSHOT | NSE: APLAPOLLO | DAILY
Closing Price: 2,270.10
Core Trend: Uptrend
Market State: Bullish Expansion / Upper-Boundary Test
Chart Pattern: Large Symmetrical Triangle / Consolidation
Candlestick Pattern: Strong Bullish Candle
Price Structure: The chart shows a broad higher-low structure developing along the rising lower trendline, while the upper boundary slopes gradually downward from the earlier peak. Price has now advanced back towards this long-term upper boundary around 2,270, making the current zone technically significant.
Technicals: Bullish structure
Volume: 1.12M vs 711.96K average — approximately 1.57× average volume
Moving Average Structure: Full Bullish EMA Stack
CPR & Market Structure: Bullish Zone — Narrow CPR
Next Session CPR: Wide — Pivot 2,228.80 | Top 2,249.50 | Base 2,208.20
Model Reference: 2,270.10
Observation References: 2,502.10 | 2,734.10 | 2,966.00
Resistance References: 2,311.37 | 2,352.63 | 2,435.17
Support References: 2,187.57 | 2,105.03 | 2,063.77
📚 STWP EDUCATIONAL OBSERVATION
APL Apollo Tubes is currently positioned at an important technical area, with price returning to the upper boundary of a large symmetrical consolidation structure visible on the daily chart. The rising lower trendline has continued to support the broader higher-low formation, while the descending upper trendline has acted as the opposing boundary. The latest move has brought price to approximately 2,270, directly around this upper boundary, making the behaviour of price around this zone important from a chart-study perspective. Volume has increased to 1.12M, compared with an average of 711.96K, while price remains above VWAP and the major EMAs. The structure therefore shows improving momentum, but the chart is now at a clearly defined long-term resistance boundary where subsequent price behaviour can provide information about whether the consolidation continues or develops into a confirmed structural expansion.
📚 STWP EDUCATIONAL NOTE
This content is provided strictly for educational and informational purposes only.
The information presented should not be construed as investment advice, research advice, financial advice, a recommendation, solicitation or an offer to buy, sell or hold any security.
Technical analysis and historical price behaviour cannot guarantee or predict future market performance. STWP and the author make no representation or guarantee regarding future price movements, returns, performance or outcomes. Past performance is not indicative of future results. Kindly consult an appropriately SEBI-registered investment professional.  Long
Long
ADANIPORTS Strong Expansion from Consolidation🔥 Adani Ports: Strong Expansion from Consolidation
📊 MARKET STRUCTURE SNAPSHOT | NSE: ADANIPORTS | DAILY
Closing Price: 1,824.00
Core Trend: Uptrend
Market State: Bullish Structure / Strong Price Expansion
Chart Pattern: No confirmed chart pattern
Candlestick Pattern: Bullish Marubozu
Price Structure: Price has moved above the upper boundary of the developing symmetrical triangle, with the dashboard showing Buyers Active, Sellers Weak and Bullish Structure. The session closed at 1,824.00 after a 4.93% rise, with price holding above VWAP and all major EMAs.
Technicals: Bullish
Volume: High Participation — 4.15M vs 2.55M average
Moving Average Structure: Bullish — EMA structure remains positively aligned
CPR & Market Structure: Bullish Zone — NR7 Active
Next Session CPR: Wide — Pivot 1,797.30 | Top 1,810.70 | Base 1,784.00
Model Reference: 1,824.00
Observation References: 2,062.10 | 2,181.20
Resistance References: 1,850.67 | 1,877.33 | 1,930.67
Support References: 1,770.67 | 1,717.33 | 1,690.67
📚 STWP EDUCATIONAL OBSERVATION
Adani Ports is showing a notable technical expansion after moving above the upper boundary of a developing symmetrical triangle, with the breakout accompanied by increased volume participation. The latest session recorded a 4.93% price expansion, while volume of 4.15M was approximately 1.62× the average. Price remains above VWAP and the major EMA levels, with RSI at 64.04 reflecting positive momentum and the dashboard identifying a bullish structure. The 1,824.00 reference area is now close to the immediate resistance zone beginning at 1,850.67, while the projected next-session CPR around 1,784.00–1,810.70 provides an additional reference area for studying subsequent price behaviour. The broader observation references shown on the chart are 2,062.10 and 2,181.20.
📚 STWP EDUCATIONAL NOTE
This content is provided strictly for educational and informational purposes only.
The information presented should not be construed as investment advice, research advice, financial advice, a recommendation, solicitation or an offer to buy, sell or hold any security.
Technical analysis and historical price behaviour cannot guarantee or predict future market performance. STWP and the author make no representation or guarantee regarding future price movements, returns, performance or outcomes. Past performance is not indicative of future results. Kindly consult an appropriately SEBI-registered investment professional. Long 
 Long
Long
Dixon Technologies — Chart Analysis - Rising channel breakdownRising channel breakdown :
Price has broken below the lower boundary of the ascending channel, indicating a change from the previous bullish structure to short-term bearish momentum. The breakdown is accompanied by continued selling pressure.
Current price: ~₹13,005
🔴 Bearish Setup
Sell-on-rise zone: ₹13,400–₹13,700
Stop-loss: ₹14,100
Target 1: ₹12,500
Target 2: ₹11,800
Target 3: ₹11,500
The ₹13,400–₹13,700 area can act as a breakdown/retest zone. A rejection there would strengthen the bearish setup.
🟢 Bullish Scenario
Avoid assuming a reversal just because RSI is near 31. A stronger bullish case would require:
Price to reclaim ₹13,700–₹14,000 and sustain above the broken channel.
Then upside levels can be reassessed.
⚠️ Important
RSI is approaching oversold territory, so a short-term bounce is possible, but oversold alone is not a reversal signal.
Rising channel breakdown :
🔻 Channel Breakdown: Dixon has broken below its rising channel, indicating bearish momentum. Watch ₹13,400–₹13,700 for a possible retest/rejection. Below this zone, ₹12,500 → ₹11,800 → ₹11,500 are key downside levels. A sustained reclaim above ₹14,000 would weaken the bearish setup.
Disclaimer: This is my personal technical analysis for educational purposes, not financial advice. Do your own research, manage risk, and trade according to your plan.  Short
Short
 Long
Long
Nifty Has Fallen for 6 Straight Weeks. Can 23,000 Hold?Six weeks.
Six consecutive weeks of decline for the Nifty 50.
Last week, the index slipped another 0.22% to close at 23,346.
But there is an interesting part of the story.
Despite the continued decline, India VIX fell 7.32% to 11.39%, suggesting that volatility expectations remain relatively contained.
So, what is the market telling us?
The bigger picture
Nifty is still moving inside a broad range.
However, in the short term, sellers have been gaining control, with the index forming lower highs and lower lows.
That leaves us with a few important levels that could decide the next move.
The levels that matter
🔴 23,500 to 23,600 | Immediate resistance
A move back above this zone could support a broader technical rebound.
🔴 24,000 to 24,100 | Strong resistance
This is the next major hurdle on the upside.
🟢 23,300 to 23,200 | Immediate support
This is the first area to watch if selling pressure continues.
🟢 23,000 to 22,900 | Strong support
This is one of the most important zones on the chart right now.
A decisive break below 23,000 could weaken the current structure further.
But the chart is not the only thing to watch
Two developments could influence the market this week.
September Flash PMI Data
PMI data will show how strong India's business activity is. Strong data could support the market, while weak data may keep investors cautious.
Crude Oil Prices
Crude oil remains important amid the West Asia conflict. Higher oil prices could increase inflation, pressure the rupee and raise costs for companies.
So, what should traders watch?
For now, there is no need to guess the direction.
The market has clearly defined levels.
Above 23,500 to 23,600: The rebound story becomes more interesting.
Between the key levels: The range could continue.
Below 23,000: The current structure could weaken further.
Until one of these levels gives way, a measured and stock specific approach may make more sense than taking an aggressive directional position.
The market does not always tell us what comes next.
Sometimes, it simply gives us the levels and asks us to wait.
The question for this week:
Will Nifty finally break its six week losing streak, or will 23,000 be tested first?
 Long
Long
 Long
Long
XAUUSD — 4,500 Is the Real Test XAUUSD — 4,500 Is the Real Test
Gold is trying to recover, but this is not the type of chart where I want to get emotional too early.
After the strong selloff from the late-August high, price broke the clean bullish structure and started building a wider bearish correction. That bigger damage is still there. But now gold is holding around the 4,350 area, and more importantly, price closed back above the 100-day SMA zone near 4,320. That tells me buyers are not fully gone yet.
The macro side also supports this pause. USD is trading more quietly as oil prices and US Treasury yields ease, while RSI on the daily chart is sitting in a more neutral zone. In simple words, sellers still have the bigger structure, but they are not pushing with the same strength right now.
From an SMC view, the current recovery looks like a move from the bullish OB / demand area around 4,250 - 4,290. As long as price holds above 4,320 - 4,330, I think gold can continue climbing toward the internal supply and bearish mitigation block around 4,460 - 4,500.
But here is the trap: a push into 4,480 - 4,500 does not automatically mean gold is bullish again. That area is exactly where sellers may try to reload. It is also close to the previous broken structure, so late buyers can easily get caught if price rejects there.
My main view is short-term bullish recovery while gold holds above 4,320, but I will treat 4,460 - 4,500 as the real decision zone. If buyers reclaim that area cleanly, gold can open a wider recovery toward 4,600 - 4,635. But if price rejects from there, the market may rotate back down toward 4,300 and possibly 4,250 again.
Key Price Zones to Watch
Current reaction area: 4,350 - 4,365
Main support / 100-day SMA area: 4,320 - 4,330
Bullish OB / demand zone: 4,250 - 4,290
Internal supply / bearish mitigation block: 4,460 - 4,500
HTF bearish OB: 4,630 - 4,690
Major downside support: 4,030 - 4,060
Bullish confirmation: clean reclaim above 4,500
Bearish rejection signal: failure around 4,460 - 4,500
Invalidation for recovery: clean break and hold below 4,320
Do you think gold can reclaim 4,500, or is this recovery only setting up another sell reaction from supply?
 Long
Long
Pullback Before Another BSL TestFundamental Analysis
Gold is holding firm after posting its first weekly gain in four weeks, helped by easing oil prices and some reduction in inflation pressure. However, the U.S. dollar remains near a seven-week high, Treasury yields are around 5%, and markets still price roughly a 55% chance of another Fed hike in October.
Technical Analysis
On H1, Gold remains constructive after the recent bullish BOS, but price is now approaching the 4,395–4,410 BSL / major resistance.
The cleaner continuation setup is a controlled pullback into the 4,348–4,368 OB + Fibo zone. If buyers defend this area, the next bullish wave could retest upper liquidity.
Volume Profile also shows an important lower balance area around 4,300–4,318 POC.
Important Key Levels
4,395–4,410 — BSL / Major Resistance
4,348–4,368 — OB + Fibo
4,300–4,318 — POC
4,235–4,250 — SSL / Major Support
Trading Scenario
Buy priority remains on a pullback into 4,348–4,368 followed by bullish H1 confirmation.
Target: 4,395–4,410 BSL.
Invalidation: H1 acceptance below the OB + Fibo zone.
Overall View
The short-term structure remains constructive, but buying directly below BSL offers less attractive positioning. A pullback into support could provide the cleaner continuation setup.
Will Gold retest the OB + Fibo first before breaking 4,400? Long 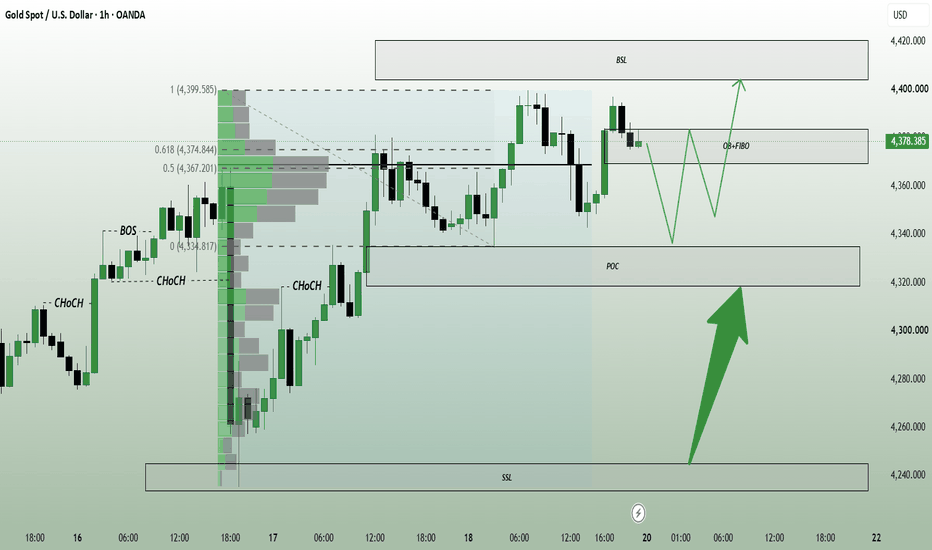
Stage 2 Continuation / High-Level Consolidation Near SupplyGlobal Health is maintaining a strong Stage 2 uptrend after a sustained advance from the ₹950–1,000 region. Price has consistently formed higher highs and higher lows while remaining above the major moving averages. Following the recent advance toward ₹1,520, the stock has entered a relatively tight consolidation near the upper end of the trend.
The current setup is constructive, but price is sitting directly below a significant supply zone around ₹1,490–1,530. A decisive breakout above this zone, preferably accompanied by strong volume, could mark the next momentum expansion and potentially put the stock into fresh price discovery.
Technical Observations
Established Stage 2 Uptrend: Price is trading above the 20 EMA, 50 EMA, 100 EMA and 200 DMA, with the major moving averages trending upward.
Strong Market Structure: The stock continues to form higher highs and higher lows, confirming a healthy bullish trend.
High-Level Consolidation: After the strong advance, price has consolidated near the highs rather than undergoing a deep correction, indicating continued demand.
Tight Price Action: The recent range around ₹1,430–1,490 shows relatively controlled volatility and suggests supply is being absorbed near higher levels.
Relative Strength Leadership: Relative strength remains firmly positive and continues to trend higher, indicating sustained outperformance.
Moving Average Support: The shorter-term moving averages remain positively aligned and the 50/100/200 DMA structure continues to support the broader trend.
Overhead Supply: The ₹1,490–1,530 zone is the immediate resistance area and includes the recent high around ₹1,520.
Breakout Potential: A decisive move above ₹1,530 would clear the major visible supply zone and could trigger a fresh momentum phase.
Key Levels
Immediate Support: ₹1,440–1,460
Major Support: ₹1,360–1,400
Immediate Supply Zone: ₹1,490–1,530
Breakout Trigger: Above ₹1,530 with volume confirmation
Target 1: ₹1,600–1,620
Target 2: ₹1,700
Trade Plan
Aggressive traders may monitor the stock for a decisive breakout above ₹1,530 with strong volume confirmation. Since price is currently trading inside the supply zone, chasing the stock at current levels carries a higher risk of rejection.
A more favourable risk-to-reward entry could emerge after a confirmed breakout above ₹1,530 followed by a controlled retest of the breakout area. Ideally, the retest should occur on lower volume with buyers defending the former resistance.
For an aggressive breakout trade, a stop loss can be considered below ₹1,440–1,460 depending on position size. A wider positional stop below ₹1,360–1,400 would provide the broader trend more room but would require smaller position sizing.
Summary
Global Health continues to display several characteristics of a strong Stage 2 momentum stock: sustained higher highs and higher lows, bullish moving-average alignment, strong relative strength and tight consolidation near the upper end of the trend.
The key decision point is the ₹1,490–1,530 supply zone. A high-volume breakout above ₹1,530 would significantly strengthen the setup and could open the way toward ₹1,600–1,620 and potentially ₹1,700.
Caution: Price is currently sitting directly inside an important supply zone, so the immediate risk is a rejection from ₹1,490–1,530. The latest breakout attempt should ideally be accompanied by stronger volume to confirm that supply is being absorbed. Avoid chasing a sharp move directly into resistance. A sustained breakdown below ₹1,440 would weaken the immediate bullish structure and could lead to a deeper pullback.
Disclaimer: Educational purpose only. Not a recommendation to buy or sell securities. Please manage risk appropriately.  Long
Long
Stage 2 Momentum Continuation / VCP-style Breakout SetupACME Solar Holdings continues to display a strong Stage 2 uptrend with a well-defined sequence of higher highs and higher lows. Following the strong advance from the ₹275–300 region, the stock has undergone a series of progressively smaller pullbacks while remaining above its key moving averages.
The recent price action is particularly interesting because the contractions have reduced from approximately 15% to 9%, then 7%, and most recently around 5–6%. Price is now approaching the previous high around ₹440 and has broken above the latest short-term consolidation with a strong bullish candle and increased volume. A decisive breakout above ₹440 could provide confirmation of the next momentum leg.
Technical Observations
Established Stage 2 Uptrend: Price remains above the major moving averages, with the 20 EMA, 50 EMA and 200 DMA all trending upward and supporting the primary bullish structure.
Strong Prior Expansion: The stock has delivered a substantial advance from the ₹275–300 region, establishing strong momentum and sustained demand.
Progressive Volatility Contraction: Recent pullbacks have become progressively smaller, approximately 15%, 9%, 7% and most recently around 5–6%, indicating declining selling pressure.
Higher Highs and Higher Lows: The broader price structure remains firmly bullish, with buyers consistently defending higher levels.
VCP Characteristics: The progressively smaller contractions near the highs resemble a VCP-style continuation pattern, with volatility compressing before a potential expansion.
Relative Strength: Relative strength remains very strong and is currently near its highest levels on the chart, confirming continued market leadership.
Volume Expansion: The latest bullish move has been accompanied by a significant increase in volume, providing useful confirmation of renewed demand.
Key Resistance: The ₹440–445 region represents the immediate previous high and is the key level that needs to be cleared for the next phase of price expansion.
Key Levels
Immediate Support: ₹410–420
Major Support: ₹395–405
Breakout Level: ₹440–445
Aggressive Entry: Above ₹445 with strong volume
Target 1: ₹475–480
Target 2: ₹510–520
Target 3: ₹550+
Trade Plan
Aggressive momentum traders may consider an entry above ₹445 if price decisively clears the previous high with strong volume. This would confirm the breakout from the latest contraction and potentially trigger the next expansion phase.
A more favourable risk-to-reward opportunity could emerge if the stock briefly pulls back toward ₹420–430 after the breakout and successfully holds the breakout area as support. A low-volume retest followed by renewed buying would provide additional confirmation.
For an aggressive momentum trade, a stop loss below ₹410 can be considered. A wider positional stop below ₹395–405 would provide the broader structure more room but would require smaller position sizing.
Summary
ACME Solar Holdings is showing many characteristics of a strong Stage 2 momentum continuation setup: a well-established uptrend, rising moving averages, strong relative strength, higher highs and higher lows, progressively smaller pullbacks and a recent increase in volume.
The most important level now is ₹440–445. A decisive high-volume breakout above this previous high would confirm the latest VCP-style contraction and could open the way toward ₹475–480, followed by ₹510–520 and potentially higher if the momentum continues.
Caution: The stock is already close to a significant previous high, so a failed breakout remains possible. Avoid chasing a sharp gap-up without volume confirmation. A rejection from ₹440–445 followed by a move below ₹410 would weaken the immediate setup, while a sustained breakdown below ₹395–405 would materially damage the broader Stage 2 structure.
Disclaimer: Educational purpose only. Not a recommendation to buy or sell securities. Please manage risk appropriately.  Long
Long


