 Long
Long
 Long
Long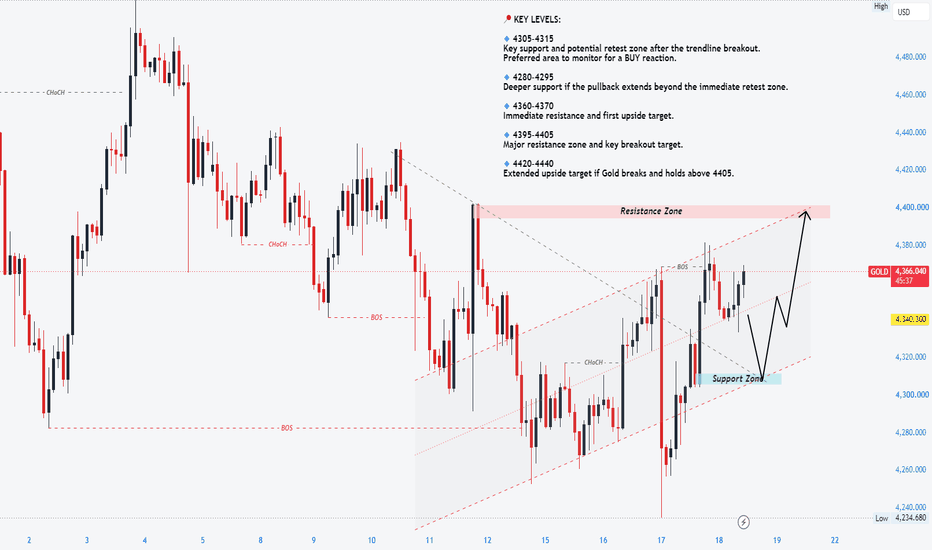
Gold Post-FOMC: Break 4,320 or Sweep 4,260?
Market Overview
• Macro Driver: Spot Gold hovers near $4,313 on Wednesday, September 16, 2026, as global markets brace for today's pivotal FOMC Interest Rate Decision and the release of the updated Summary of Economic Projections (SEP / Dot Plot). While policy rates are widely projected to remain steady at 3.50%–3.75%, institutional desks are hyper-focused on Fed Chair Kevin Warsh's forward guidance regarding persistent underlying inflation and balance sheet velocity.
• Market Condition: Institutional order flow reflects a classic pre-FOMC volatility compression. After absorbing sell-side liquidity at the 4,260 Demand Zone, smart money is coiling price within a tight range between the 4,260 base and 4,320 Resistance Zone, preparing for an aggressive post-announcement directional expansion toward overhead channel resistance.
Technical Context
• Structure: Re-Accumulation within Bearish Descending Channel. On the 1H timeframe, Gold remains bound beneath the multi-week descending trendline from the 4,511.089 Strong High. Following multiple CHoCH and BOS downside sweeps, price printed a double-bottom absorption at the Demand Zone (4,260 – 4,275).
• Liquidity & Imbalance: Price delivery shows immediate rejection at the 4,310–4,320 Resistance Zone (current market price: 4,313.035). The technical roadmap anticipates a shallow corrective retest into the 4,260–4,275 Demand Zone to engineer final buy-side liquidity, followed by an impulsive breakout push piercing through 4,320 to target the Intermediate Supply Block (4,350 – 4,370) and test the descending channel ceiling.
Key Zones
• Macro Structural Ceiling (Strong High): 4,511.08
• Upper Supply Block: 4,420.00 – 4,435.00
• Intermediate Supply Target (Blue Box): 4,350.00 – 4,370.00
• Immediate Overhead Resistance Zone (Grey Box): 4,310.00 – 4,322.00
• Current Market Price: 4,313.03
• Structural Demand Zone Base (Grey Box): 4,260.00 – 4,275.00
Trading Plan (IF–THEN)
• IF price delivers a corrective liquidity tap into the 4,260 – 4,275 Demand Zone AND validates lower-timeframe (M5/M15) bullish displacement/CHoCH -> THEN look to execute Long positions targeting 4,315, expanding through 4,322 directly toward the 4,350.00 – 4,370.00 Intermediate Supply / trendline ceiling.
• IF price confirms a decisive 1H close below 4,250 during the FOMC rate release -> THEN the demand accumulation thesis is invalidated, unlocking a deeper sell-side flush toward 4,220.
MMFLOW View
• Bias: Pre-News Accumulation / Post-FOMC Bullish Expansion. Fading the range midpoint at 4,313 ahead of the Fed rate decision presents poor risk-to-reward; our mathematical edge favors buying verified liquidity defenses at the 4,260–4,275 demand floor to ride the expansion wave into descending channel resistance.
Are you positioning for a post-FOMC breakout toward 4,360, or expecting Kevin Warsh's press conference to push Gold below 4,260? Long 
Nifty Intraday Outlook For 18-09-2026📊 **NIFTY 15-Min: Positive Opening Rejected Near Resistance**
NIFTY opened higher near 23,330 and tested the important 23,360–23,365 resistance zone.
However, sellers appeared immediately near resistance and price has pulled back toward the opening-range support.
That makes the first 15-minute range extremely important for today's next directional move.
---
📌 **Important Levels**
Resistance:
• 23,330
• 23,365
Upside Targets:
• 23,400
• 23,440
• 23,560
Support:
• 23,290
• 23,240
Downside Targets:
• 23,200
• 23,170
• 23,050
---
📉 **Bearish Plan**
If NIFTY rejects again from 23,330–23,365:
• PE after bearish confirmation
• Prefer rejection + lower-high formation
• Targets: 23,290 / 23,250 / 23,200
Below 23,290:
• Opening-range breakdown becomes active
• Prefer breakdown + failed reclaim
• Targets: 23,250 / 23,200 / 23,170
Do not chase PE if price falls directly into the 23,208 demand zone.
---
📈 **Bullish Plan**
CE only after NIFTY breaks and sustains above 23,365.
Targets:
• 23,400
• 23,440
• 23,560
Above 23,440, the recovery structure becomes considerably stronger.
A positive opening alone is not enough — buyers need to absorb the supply near 23,365.
---
🌍 **Market Context**
Indian equities opened positively as crude oil extended its decline from recent highs.
Brent remains above $100, so oil-related inflation and corporate-margin risks remain important for India despite the recent relief.
Global equities have improved and US Treasury yields have eased, but central-bank policy remains tight.
Foreign investors also remain net sellers, while domestic institutions continue to provide buying support.
---
✅ **Final View**
Above 23,365 → bullish continuation
Above 23,440 → recovery strengthens
Reject 23,330–23,365 → sellers retain an edge
Below 23,290 → opening weakness confirmed
Below 23,200 → bearish continuation strengthens
Until the first 15-minute candle closes → WAIT
Educational analysis only. Trade with confirmation and disciplined risk management.

#BANKNIFTY Intraday PE & CE Levels(18/09/2026)Bank Nifty is expected to open flat around the 56050–56100 zone. The index is positioned near an important support area after facing repeated resistance around 56450–56550. With price currently near 56050, today's opening is likely to be important in deciding whether the index attempts another recovery or resumes its downside move.
On the bullish side, the 56050–56100 zone is the immediate level to watch. If Bank Nifty holds this area and starts sustaining higher, recovery can extend toward 56250, 56350 and 56450. However, 56450–56550 remains a significant resistance zone. A sustained breakout above 56550 can strengthen momentum further toward 56750, 56850 and 56950+.
On the bearish side, failure to hold the 56050 area can bring the index back toward 55950. A decisive breakdown below 55950 would indicate renewed weakness, with potential downside levels around 55750, 55650 and 55,550. The 55550–55556 region is the next major support visible on the chart.
For today's session, 55950–56050 is the immediate support zone, while 56450–56550 is the major resistance zone. Since the opening is expected to be flat near support, the initial candles may remain volatile. Waiting for price to sustain above or below these important levels can provide better directional confirmation. XAUUSD — Post-Fed Fibonacci Retest Buy SetupFundamental Analysis
Gold is recovering after the Fed-driven selloff as the U.S. dollar retreats from a seven-week high and oil prices ease, giving XAUUSD room to rebound. The Fed raised rates 25 bp to 3.75%–4.00% and maintained a hawkish stance, with most policymakers still expecting at least one additional hike this year.
The macro backdrop therefore remains mixed: tighter Fed expectations continue to limit upside, but softer energy prices and a weaker dollar are supporting the current recovery.
Technical Analysis
On H1, XAUUSD is trading near 4,326 after the post-Fed liquidation reached 4,235 and triggered a strong recovery.
Price has already reclaimed the 4,300 psychological area and reached 4,335, confirming improving short-term momentum. However, the broader structure is still capped by the descending resistance trendline.
The preferred retracement area is 4,297–4,314, where Fibonacci 0.618–0.786 and the marked H1 buy zone converge.
If buyers defend this area, price could first retest 4,335, then extend toward the descending trendline around 4,350–4,360.
The deeper 4,258–4,273 support zone remains an important structural defense if the first buy area fails.
Important Key Levels
4,350–4,360 — Trendline resistance / main target
4,335 — Immediate resistance
4,297–4,314 — Main buy zone
4,286–4,297 — Short-term pivot
4,258–4,273 — Major support
4,235 — Post-Fed low
Trading Scenario
Main Buy Setup
Entry: 4,297–4,314
Stop Loss: 4,280
Take Profit 1: 4,335
Take Profit 2: 4,350
Take Profit 3: 4,355–4,360
Buy Condition
Wait for a controlled pullback into 4,297–4,314 and bullish confirmation. A liquidity sweep, long lower wick, bullish engulfing candle, or H1 reclaim above 4,314 would strengthen the continuation setup.
A sustained H1 break below 4,280 would invalidate the immediate buy idea and shift attention toward the deeper support zone.
Overall View
The short-term H1 structure is shifting into bullish recovery after the Fed liquidity sweep, but the broader descending trendline has not yet been broken.
The preferred plan is therefore to avoid chasing around 4,325–4,335 and wait for a retracement into 4,297–4,314. If buyers defend this Fibonacci zone, XAUUSD could retest 4,335 before challenging 4,350–4,360.
Will gold hold 4,297–4,314 and retest the H1 resistance trendline? Long 
Nifty50 analysis(18/9/2026).HOPE YOU HAVE A GREAT DAY.
CPR: Narrow + ascending cpr : Trending
FII: -3,208.76 sold
DII: 3,617.75 bought.
Highest OI:
CALL OI: 23500
PUT OI: 23200
Resistance: - 23500
Support : - 23000
conclusion:.
My pov
1.Almost neutral around 23300 , today expected to be trending due to cpr , so market expected to trade between 23500 to 23200.
2. MA line seems slope down, we are in bearish market ,so every bull price will be retest simply sell on rise but the place is important 50ma, 23500.
3.wait for confirmation for bull/bear.
Psychology:
“The secret of business is to know something that nobody else knows.”
― Aristotle
note:
My point of view is fully towards technical not news driven , if global news affects the market my pov can be totally wrong.
8moving average ling is blue colour.
20moving average line is green colour
50moving average line is red colour.
200moving average line is black colour.
cpr is for trend analysis.
MA line is for support and resistance.
Disclaimer:
Iam not Sebi registered so i started this as a hobby, please do your own analysis, any profit/loss you gained is not my concern. I can be wrong please do not take it seriously thank you.+
Solar Industries India – 20%(Down)|Reversal Zone in FocusSolar Industries India has recently witnessed a sharp correction of around 20% from its recent high, bringing the stock back towards an important historical price zone.
Interestingly, the chart shows a similar pattern in the past. After a strong rally of nearly 95%, the stock experienced a correction of more than 30% before finding support around the previous resistance zone and subsequently recovering.
Now, after another strong upward move, the stock has again corrected by approximately 19–20% from its recent high of 22,700.
Key Observation
The 18,000–18,500 zone is an important area to watch because it corresponds closely with the previous resistance area.
If this zone holds, the current correction could potentially develop into a recovery/reversal setup. However, another 2% downside from the current level is possible before the stock finds meaningful buying interest, so price action around this zone needs to be watched carefully.
The key concept highlighted on the chart is:
Previous Resistance → Becomes Support → Price Recovers
A similar reaction from the 18,000–18,500 zone would strengthen the technical setup, while a sustained breakdown below this zone would weaken the view.
Levels to Watch
Current Price: ~18,815
Reversal/Support Zone: 18,000–18,500
Recent High: 22,700
Correction from High: ~19–20%
Possible Additional Downside: ~2% toward the support zone
The key question now:
Will 18,000–18,500 act as support again, just as previous resistance zones have done in the past?
This is an area I would keep on the watchlist for confirmation rather than assuming a bottom.
Disclaimer: This research/analysis is for informational and educational purposes only and should not be construed as investment advice or a recommendation to buy, sell, or hold any security. Past performance and historical patterns are not indicative of future results. Investors should conduct their own research and consider their risk profile before making any investment decision.
SEBI Registered Research Analyst | SEBI Reg. No.: INH000030214
Investment in securities market are subject to market risks. Read all the related documents carefully before investing
 Long
Long
ETHUSDT 4H Double Top Rejection at Range High | Bearish Setup TaDescription:
ETHUSDT is currently trading inside a well-defined 4-hour consolidation range after a strong impulsive rally. Price recently tested the range highs for a second time and faced strong rejection, creating a potential double top formation near the 2,550 resistance zone.
The current structure shows buyers struggling to break above range resistance while price remains vulnerable near the upper boundary. In addition, the recent bounce from support has retested a key Fair Value Gap (FVG) and liquidity area, where sellers appear to be stepping back into the market.
The ascending trendline supporting the recent recovery is approaching a decisive area. A break below this trendline could accelerate bearish momentum and open the door for a move toward the lower end of the range.
Trade Setup
Entry: ~2,445 USDT
Stop Loss: ~2,513 USDT
Target: ~2,284 USDT
Risk-to-Reward: Approximately 1:2.3
Technical Confluences
✅ Double top rejection at resistance
✅ Range high sell zone
✅ Fair Value Gap mitigation
✅ Potential trendline breakdown
✅ Liquidity sweep above previous highs
✅ Favorable risk-to-reward setup
Trading Plan
As long as ETH remains below the 2,500-2,550 resistance area, the bearish outlook remains intact. Confirmation of weakness through a trendline break or lower low formation could provide the trigger for a continuation move toward the range lows around 2,280.
Disclaimer: This analysis is for educational purposes only and should not be considered financial advice. Always use proper risk management and wait for confirmation before entering a trade. Short 
BRIAN XAUUSD – GOLD HOLDS POC BEFORE FED DECISION BRIAN XAUUSD – GOLD HOLDS POC BEFORE FED DECISION
Gold is trading cautiously below 4,350 as the market moves into the Fed decision window.
The current price action is not clean enough to chase aggressively. Buyers have managed to recover from the recent low, but gold is still struggling below the short-term sell zone around 4,353 and the larger Composite VAH resistance near 4,390 - 4,400.
The macro background is mixed. A softer US dollar gives gold some short-term support, but the strong move in US Treasury yields continues to limit bullish momentum. With the Fed expected to raise rates by 25 bps, traders are now focused on the updated economic projections, the dot plot, and comments from Fed Chair Kevin Warsh.
This is why gold is moving carefully around value. The market is waiting for confirmation, not just direction.
Technical structure
On the 45-minute chart, gold is holding above the POC / HVN Value Support around 4,320 - 4,330.
This is the most important intraday support zone. Price has already reacted from this area and is now attempting to build a recovery structure. As long as buyers defend this zone, gold still has room to test higher resistance.
The first short-term resistance is around 4,353 - 4,365. This area is marked as the sell zone and sits near the current rejection line. If gold reaches this zone and fails to break cleanly, sellers may step back in and push price down toward 4,320 again.
Above that, the Composite VAH / Major Resistance around 4,390 - 4,400 is the main upside barrier. A clean break and acceptance above this zone would be the first sign that buyers are taking back stronger control.
If the POC / HVN support fails, the downside levels are clear: 4,292 as the first target, 4,275 as secondary support, and 4,262 as the major downside target.
Important zones
Current price area: 4,340 - 4,350
Gold is holding above short-term value but still below resistance.
POC / HVN Value Support: 4,320 - 4,330
Main buyer defense zone for the current structure.
Sell zone: 4,353 - 4,365
First resistance and seller reaction area.
Composite VAH / Major Resistance: 4,390 - 4,400
Major upside resistance before any stronger bullish continuation.
VAL first downside target: 4,292
First downside target if price loses value support.
LVN secondary support: 4,275
Next support if bearish pressure expands.
Major downside target: 4,262
Deeper downside target if Fed volatility strengthens the US dollar.
Trading scenario
Priority view: buy reaction only if 4,320 - 4,330 holds
Entry:
Look for buy positions only if gold holds the POC / HVN Value Support around 4,320 - 4,330 and shows clear bullish rejection.
Stop Loss:
Below the local sweep low or below the 4,320 support zone.
Take Profit:
TP1: 4,353 - 4,365
TP2: 4,390 - 4,400
TP3: Trail higher only if gold breaks and accepts above the Composite VAH resistance
This setup follows the current value-support reaction. However, confirmation is very important because the Fed decision can create fast and aggressive volatility.
Alternative sell scenario
If gold rejects from 4,353 - 4,365 and fails to reclaim that zone, sellers may regain short-term control.
Entry:
Look for sell positions only if price rejects clearly from the sell zone or breaks below 4,320 and retests it as resistance.
Stop Loss:
Above the rejection high or above the reclaimed resistance zone.
Take Profit:
TP1: 4,292
TP2: 4,275
TP3: 4,262 if downside momentum continues after the Fed decision
Final view
Gold is sitting in a decision area before the Fed announcement.
The short-term structure is trying to recover, but it is not fully bullish yet. Buyers need to defend 4,320 - 4,330 and break above 4,353 to open the way toward 4,390 - 4,400. Until that happens, every move higher can still face seller pressure.
For me, the map is simple:
Hold 4,320 - 4,330 = buyers still have a chance.
Break 4,353 = recovery momentum improves.
Reach 4,390 - 4,400 = major resistance test.
Lose 4,320 = downside opens toward 4,292 and 4,275.
Lose 4,275 = 4,262 becomes the next major target.
Gold is not a chase market right now. It is a confirmation market.
Will buyers defend the POC before the Fed decision, or will sellers use the event to force one more move into lower value?
Long 
One Chart, Multiple Patterns : Are You Seeing the Full StructureA chart rarely contains just one pattern, one trendline, or one important level.
The real skill is learning how these structures interact.
This historical chart begins with a clear Swing Low and Swing High, allowing us to map the larger move using Fibonacci retracement. I am Using Older than 3 Months chart .
Once plotted, an interesting area appears.
The 50%–61.8% retracement region, highlighted in white, creates an important Fibonacci confluence zone. Remember, 61.8% is a Fibonacci ratio, while 50% is conventionally used by traders as a retracement level.
Now look beyond Fibonacci.
The two descending white lines create a falling channel-like structure, capturing the shorter-term price contraction following the larger upward move.
But zoom out conceptually and another structure appears.
The rising red boundary extending from the swing high forms part of a broader expanding structure. This is where chart reading becomes interesting: the same candles can participate in a smaller pattern while simultaneously sitting inside a much larger one.
And notice where the structures begin interacting.
The lower white boundary repeatedly approaches the highlighted 50%–61.8% Fibonacci zone, bringing price structure and Fibonacci retracement into the same area.
That is the real lesson from this chart.
Technical structures don't have to exist independently.
 Long
Long
 Long
Long

FRIDAY’S GOLD MOVE COULD PUNISH ONE SIDE BADLY HERE’S THE SETUPYesterday’s market was extremely interesting, because what we had been discussing finally played out.
After the FOMC move, a lot of traders turned bearish. The common expectation was simple: price would retrace and then continue lower.
And that exact expectation is what trapped a lot of sellers.
Throughout the day, traders kept trying to catch the next sell-off. Every small pullback was treated as another opportunity to sell the continuation. But instead of giving them what they were waiting for, Gold pushed aggressively higher.
So why did this happen after such strong selling pressure?
The first clue was $4300.
I had mentioned several times that $4300 had been acting as an important support for quite some time. When a major support finally breaks after being respected repeatedly, sellers should be able to produce a meaningful result below it.
But that didn’t happen.
The breakdown happened, sellers applied pressure, yet price repeatedly failed to accept lower prices.
That was the first warning.
If sellers are genuinely in control, their effort should produce a result. When you see aggressive selling but very little downside progress, you have to question who actually has control.
The second clue came from the reaction after the FOMC sell-off.
The fall was aggressive enough to force many buyers out of the market. But the important question was not simply, “Did price fall?”
The important question was: What happened after the reaction?
Did sellers produce a meaningful counter move and continue pushing price lower?
No.
Despite all that selling pressure, Gold still couldn’t establish acceptance at lower prices. That failure told us much more than the bearish candles themselves.
And once the market opened on Thursday, buyers immediately started pushing price higher.
That’s exactly why I was focused on buying today, and I also shared that view in my analysis. Anyone who understood the psychology behind the move had a much clearer picture of what was happening.
Now let’s talk about Friday.
Look at today’s 4H structure. The buying has been extremely strong. The recent 4H candles have been consistently bullish, and the latest bullish candle also showed strong momentum.
After everything sellers threw at this market, buyers are still able to respond this aggressively.
Don’t ignore that.
Another important development is the breakout above $4347. Price broke this important area with strength, which is another positive sign for buyers.
We also saw price break one of the recent lower highs for the first time.
Yes, price is struggling to sustain above the high right now, but this late-session chop makes sense psychologically.
Think about the traders who became bearish after FOMC. Some of them are probably looking to re-enter shorts around these higher prices. At the same time, late buyers who entered after today’s rally are now sitting at uncomfortable prices.
So this choppy price action can create pressure on both sides: frustrate late buyers while attracting fresh sellers.
For Friday, I wouldn’t be surprised to see some initial downside movement after the market opens. Price could pull back into the $4352–$4341 area.
But my main focus remains on the upside.
The key level I’m watching is $4379.
If Gold breaks $4379 with proper confirmation and buyers continue showing acceptance above it, I’ll be looking toward $4400.
Around $4400, some rejection or profit-taking would be completely normal. But if buyers maintain control, I believe the move can extend toward the $4420–$4424 area.
That area becomes much more interesting.
If you look back toward the first week of September, the broader $4450 region has repeatedly created resistance. After such a strong bullish day, I don’t automatically expect Friday to deliver another uninterrupted one-sided rally.
So if Gold reaches the $4420–$4424 region, I’ll pay very close attention to the reaction.
If buyers start losing momentum and sellers finally show meaningful control, we could see a deeper move back toward the $4400 region into the later part of the session.
So the Friday plan is simple:
My primary focus remains BUYING while the bullish structure and price behavior remain intact.
I’m watching $4379 for the next important breakout, then $4400, with $4420–$4424 as the larger upside area.
But remember, levels alone don’t make a trade.
Watch the reaction. Watch acceptance and rejection. Watch whether effort is actually producing a result.
That is where market psychology becomes more useful than simply looking at red and green candles.
Trade with confirmation, manage your risk properly, and don’t chase price just because you have a directional bias.
Good luck for Friday.
And now I want to know your view: Are you expecting Gold to break $4400 and continue toward $4420+, or do you think sellers regain control first?
XAUUSD: 4,353 Holds the Recovery Door Open XAUUSD: 4,353 Holds the Recovery Door Open
Market Context
Gold is trying to recover after trading near the lowest area in more than one month, while traders remain cautious ahead of the key FOMC policy meeting.
The downside pressure has slowed, but the market is not fully bullish yet. Higher Fed rate expectations and uncertainty around the policy outlook are still limiting aggressive buying. That means every recovery move needs confirmation, especially while gold remains below the main bearish mitigation zone.
For now, gold is trading around 4,342. The short-term bounce is active, but the next test is clear: buyers must reclaim and hold above 4,353 to prove that this recovery has strength.
Technical Structure
Gold has reacted from the lower support area and is now pushing back toward the intraday decision level.
The key level on this chart is 4,353. If price can hold above this level, the recovery may extend toward 4,385 - 4,400. This zone is the main bearish mitigation area and also the nearest sell reaction zone.
That is where the real test begins. If gold reaches 4,385 - 4,400 and gets rejected, sellers may regain control and push price back toward the lower support area.
Below current price, 4,320 - 4,330 is the nearest intraday support. Losing this area may weaken the recovery and bring price back toward the Bullish OB at 4,280 - 4,300.
The deeper structure still shows bearish pressure above, so buyers need more than a small bounce. They need acceptance above 4,353 first, then a clean break through 4,385 - 4,400 to shift the short-term story.
Key Levels
Current Price: 4,342
Intraday Decision Level: 4,353
Nearest Support: 4,320 - 4,330
Bullish OB / Key Support: 4,280 - 4,300
Main Resistance / Sell Reaction Zone: 4,385 - 4,400
HTF Bearish OB / Major Premium POI: 4,410 - 4,435
Bullish Recovery Confirmation: Above 4,353
Bearish Continuation: Below 4,280
Trading Plan
Primary Buy Recovery Scenario
Entry: Above 4,353 after breakout and retest
SL: Below 4,320
TP: 4,385 / 4,400 / 4,410
Condition: Buyers must hold above 4,353 with clear bullish momentum. If price accepts above this level, gold may continue its recovery toward the bearish mitigation zone.
Primary Sell Scenario
Entry: 4,385 - 4,400 after bearish confirmation
SL: Above 4,425
TP: 4,353 / 4,330 / 4,300
Condition: Price rebounds into the main resistance zone but fails to continue higher. A rejection here would show that sellers are still defending the structure.
Buy Reaction Scenario
Entry: 4,280 - 4,300 after strong bullish confirmation
SL: Below 4,255
TP: 4,330 / 4,353 / 4,385
Condition: Gold must show a strong reaction from the Bullish OB. This is only a support reaction setup, not a full bullish reversal unless price reclaims 4,400 with strength.
Breakdown Sell Scenario
Entry: Below 4,280 after breakdown and retest
SL: Above 4,310
TP: 4,255 / 4,220 / 4,200
Condition: Gold loses the Bullish OB and fails to reclaim it. This would expose lower liquidity and confirm that downside pressure is extending again.
Overall Bias
Gold is recovering, but the recovery is still not confirmed as a full bullish reversal.
The market is now testing an important intraday area. If buyers hold above 4,353, gold can push toward 4,385 - 4,400. But if price rejects from that resistance, sellers may use the bounce as another opportunity to continue the bearish structure.
The most important support remains 4,280 - 4,300. Holding this zone keeps the recovery alive. Losing it would open the door for a deeper downside move.
Best approach: do not chase the middle before FOMC. Wait for a clean hold above 4,353, a rejection from 4,385 - 4,400, or a strong reaction from 4,280 - 4,300.
Will gold reclaim 4,353 and extend the recovery, or will sellers defend 4,400 and push price lower again?
Short 
S&P 500: Fed Speaks, Chart Hits 0.618The Fed just blinked hawkish — and the market moved almost exactly where the chart said it might.
On September 16, the US Fed raised rates by 25 bps — the first hike in three years. The move itself was already priced in (92% odds going in). What actually shook the market was two words from Fed Chair Kevin Warsh: he said policy needs to support a "timelier return" to the 2% inflation goal. Markets read that as "more hikes are coming, and soon" — and that's what sent the Dow down 630+ points and dragged the S&P 500 lower with it.
Here's where it gets interesting for chart readers: the S&P didn't just fall — it fell and stopped almost exactly at the 0.618 Fibonacci retracement (7,505.98) of the entire rally from the May low. 0.618 is called the "Golden Ratio" for a reason — it shows up everywhere in nature, and in markets it's the most-watched retracement level of all. So many traders have orders sitting near it that it often becomes a self-fulfilling floor or ceiling. That's exactly what played out here.
The wave count on the chart
Zooming out, here's the structure I'm tracking:
Wave (I) → (II) : The May–August move up (I) got corrected by an a-b-c "Running Flat." . Two tells confirm this: wave (b) made a slightly higher high than wave (I), and wave (c) barely dipped below wave (a)'s low before buyers stepped back in. A shallow, reluctant wave (c) is a classic sign the bigger trend is still up — running flats usually show up right before a strong wave 3.
Wave (1) → (2) : After (II) bottomed near 7,313.92, price rallied to 7,816.70 (wave 1), then pulled back — and that pullback is exactly the move the Fed news triggered, landing right on the 0.618 line at 7,505.98.
Why this level matters
7,313.92 (the wave II low) is the line in the sand. As long as price holds above it, this bullish count stays valid. A daily close below it would mean this labeling needs a rethink.
If the count holds
Using the wave (II)-low-to-wave (2)-low as the base of a trend channel, and projecting a simple 1x extension of wave (1) from the wave (2) low, the first target zone lines up around 8,010. Third waves often run further than 1x — so if this move has real strength, a stretch target near 8,300 (1.618x) isn't out of the question either. These are reference zones to watch, not predictions of exact outcomes — wave 3 needs to actually break above 7,816.70 with strong, clean structure before this becomes more than a scenario.
Bottom line
Macro (hawkish Fed) and technicals (Golden Ratio holding, running flat completing) lined up perfectly this week. The structure stays bullish above 7,313.92. Above 7,816.70 with strength would be the next confirmation to watch for.
Disclaimer:
I am not a SEBI registered research analyst. This post is shared only for education and learning purposes, based on my personal reading of the chart. It is not a buy or sell recommendation. Please do your own research or speak to a registered advisor before taking any trading decision.  Long
Long


