GLAND has explosively broken out of a multi-year macro base1. The Macro Perspective: The Deep Washout and Multi-Year Accumulation
I am taking a LONG bias on Gland Pharma Limited (GLAND) on the weekly (1W) timeframe.
When analyzing pure market structure, the most powerful and sustainable secular trends are born from grueling, exhaustive accumulation phases. Look at the massive structural development spanning this entire chart. After a massive historical markdown phase, the stock spent over two years locked in a brutal macro accumulation base. This prolon
Correlation Coefficient (CC)
AVALONhas explosively broken out of a massive ascending triangle1. The Macro Perspective: The Institutional Staircase
I am taking a LONG bias on Avalon Technologies Limited (AVALON) on the weekly (1W) timeframe.
When analyzing pure market structure, the most powerful and sustainable breakouts occur in alignment with an established macro trend. Look at the massive structural development on this chart. The defining feature is the steep, unbroken ascending trendline (the lower solid black line). Every single time the stock experienced a pullback, institutional
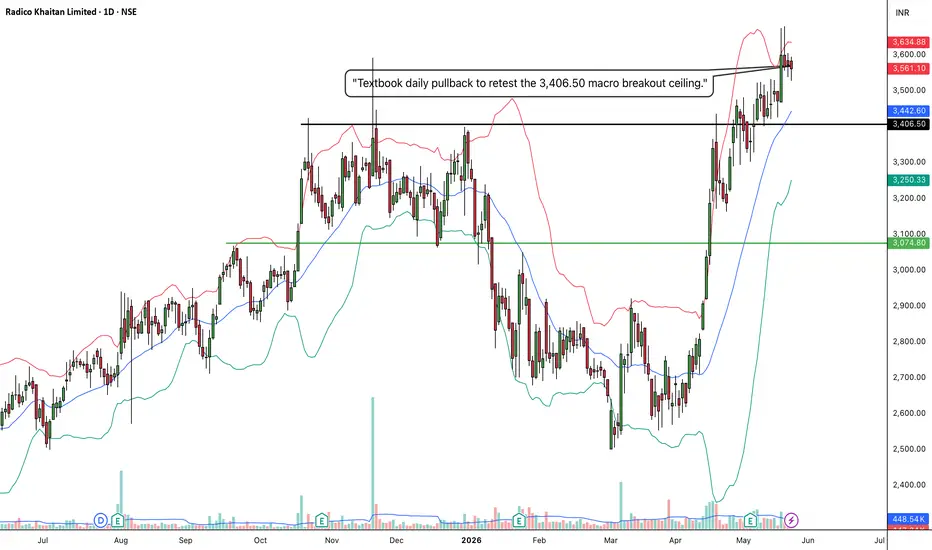
RADICO: Daily Break & Retest1. The Macro Perspective: The Massive Accumulation Cup
I am taking a LONG bias on Radico Khaitan Limited (RADICO) on the daily (1D) timeframe.
When analyzing pure market structure, sustainable long-term trends do not move in a straight line; they breathe through cycles of expansion and compression. Look at the extensive structural development displayed across Screenshot 2026-05-23 at 17.07.29.jpg. After a major markup phase that topped out in late 2025, the stock underwent an extensive correctiv
SHILPAMED: Monthly Macro Base Breakout1. The Macro Perspective: The Multi-Year Consolidation Base
I am taking a LONG bias on Shilpa Medicare Limited (SHILPAMED) on the absolute macro monthly (1M) timeframe.
When analyzing pure market structure on a monthly chart, we are looking at the footprint of long-term institutional accumulation. Look at the staggering structural development displayed across Screenshot 2026-05-26 at 14.44.51.jpg. After a major rally through mid-2024, the stock entered a broad, multi-year horizontal range. This
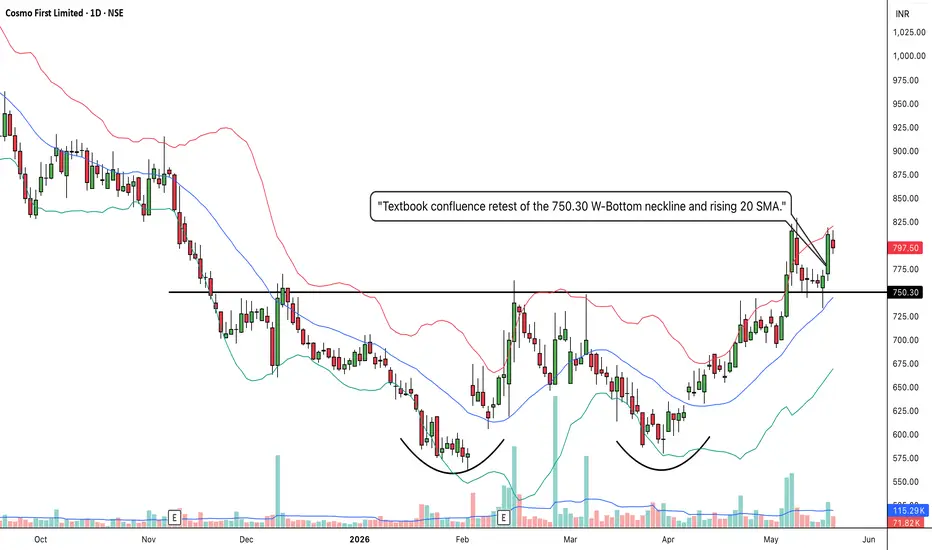
COSMOFIRST: Massive W-Bottom Base and Textbook Confluence Retest1. The Macro Perspective: The Washout and the W-Bottom
I am taking a LONG bias on Cosmo First Limited (COSMOFIRST) on the daily (1D) timeframe.
When analyzing pure market structure, the most reliable reversals are born from deep, agonizing accumulation phases. Look at the structural development on the lower half of this chart. After suffering a brutal markdown phase that dragged the price into the 500s and completely washed out weak hands, heavy institutional capital stepped in. I have explicitl
PFC: The Ultimate Bear Trap, Box Breakout, and Textbook Retest1. The Macro Perspective: The Digestion Box
I am taking a LONG bias on Power Finance Corporation Limited (PFC) on the weekly (1W) timeframe.
When analyzing pure market structure, massive momentum runs require massive digestion phases. Look at the structural development on the left side of this chart. After a historical parabolic run-up, the stock naturally exhausted itself. But instead of entering a multi-year bear market, institutional buyers established a massive horizontal consolidation zone
RPRX: Explosive Macro Breakout and Multi-Year ReversalThe Setup (Bias): I am taking a LONG bias on Royalty Pharma plc (RPRX) on the macro monthly (1M) timeframe.
The "Why" (Technical Reasons): 1. Historic Structural Reversal: Zooming out to the monthly timeframe reveals the true magnitude of this turnaround. After a prolonged downtrend into a clearly defined accumulation box at the lows, the price has mounted a massive V-shaped/rounding recovery. It has now forcefully broken out, cleanly slicing through the heavy macro resistance ceiling at 46.71.
ANGELONE: Daily Box Breakout1. The Macro Perspective: The High-Level Accumulation Box
I am taking a LONG bias on Angel One Limited (ANGELONE) on the daily (1D) timeframe.
When analyzing pure market structure, explosive vertical moves must eventually be digested. Look at the extensive structural development displayed on this chart. Following a massive, nearly vertical markup phase that initiated in late March, the stock naturally became overextended and needed to breathe. Instead of collapsing and surrendering those gains,
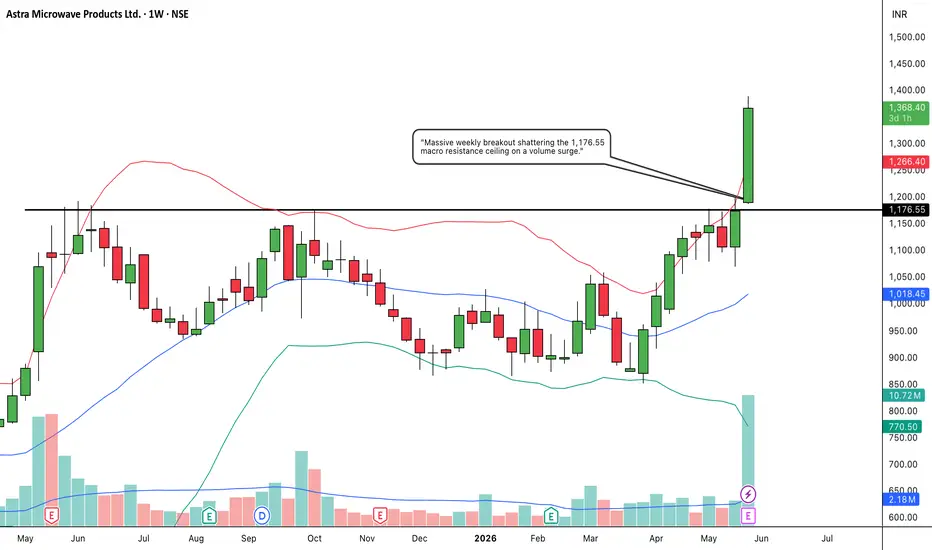
ASTRAMICRO: Weekly Macro Base Breakout1. The Macro Perspective: The Multi-Year Accumulation Phase
I am taking a LONG bias on Astra Microwave Products Limited (ASTRAMICRO) on the weekly (1W) timeframe.
When analyzing pure market structure, the most powerful and sustainable trends are born from prolonged high-level consolidation patterns. Looking at the structural development in Screenshot 2026-05-26 at 14.35.15.jpg, the stock has spent roughly a year building a massive macro base. After a previous secular markup phase that topped ou
GRANULES: Weekly Macro Cup Breakout1. The Macro Perspective: The Deep Washout and Rounding Base
I am taking a LONG bias on Granules India Limited (GRANULES) on the weekly (1W) timeframe.
When analyzing pure market structure on a macro level, the most powerful and sustainable trends emerge from deep, well-rounded accumulation structures. Look at the comprehensive development displayed in Screenshot 2026-05-23 at 17.10.58.jpg. After hitting a major structural peak in mid-2024, the stock entered a long, grueling digestion cycle that
JBCHEPHARM: Weekly ATH Breakout1. The Macro Perspective: The High-Level Accumulation Base
I am taking a LONG bias on JB Chemicals & Pharmaceuticals Limited (JBCHEPHARM) on the weekly (1W) timeframe.
When analyzing pure market structure, the strongest macro setups occur when a stock undergoes a healthy, multi-month consolidation right beneath its lifetime highs. Look at the comprehensive structural development displayed in edited-image.png. After carving out a major top in mid-2024, the stock underwent an extensive corrective
JLong
SANSERA: The Perfect Ascending Channel and Confluence Bounce1. The Macro Perspective: The Institutional Staircase
I am taking a LONG bias on Sansera Engineering Limited (SANSERA) on the daily (1D) timeframe.
When analyzing pure market structure, the most sustainable and lucrative trends do not go straight up vertically; they move in structured waves. Look at the massive structural development spanning this chart. I have highlighted a textbook "Ascending Channel." This pattern is the ultimate footprint of methodical, long-term institutional accumulation.
PRECOT has explosively broken out of a massive multi-year macro 1. The Macro Perspective: The Multi-Year Secular Base
I am taking a LONG bias on Precot Limited (PRECOT) on the absolute macro monthly (1M) timeframe.
When analyzing pure market structure on a monthly chart, we are observing the true footprints of heavy institutional capital. Look at the staggering structural development spanning this entire chart. After a dormant decade of accumulation, the stock initiated a violent markup phase in 2021-2022. However, parabolic runs require deep digestion. Over
CANBK: Multi-Year Rounding Bottom and Textbook Macro Retest1. The Macro Perspective: The Decade-Long Washout and Recovery
I am taking a LONG bias on Canara Bank (CANBK) on the absolute macro monthly (1M) timeframe.
When analyzing pure market structure on a monthly chart, we are looking at cycles that take years to play out. Look at the massive structural development spanning the entire chart. The stock suffered a brutal, agonizing markdown phase that lasted for years, dragging the price all the way down to a concrete floor near the 10-20 zone. This dee
BIOCON: Ascending Triangle Breakout1. The Macro Perspective: The Secular Trendline Defense
I am taking a LONG bias on Biocon Limited (BIOCON) on the weekly (1W) timeframe.
When analyzing pure market structure, the most powerful and sustainable breakouts occur in alignment with an established macro trend. Look at the massive structural development on this chart. The defining feature is the steep, unbroken ascending trendline originating from the bottom left. Every single time the stock experienced a deep, agonizing pullback, inst
Market Correlations & Intermarket Analysis1. Market Correlations: Definition and Importance
Market correlation refers to the statistical relationship between the price movements of two or more assets. Correlation is measured on a scale from -1 to +1:
+1 correlation: The assets move perfectly in the same direction. If one rises 1%, the other rises 1%.
-1 correlation: The assets move perfectly in opposite directions. If one rises 1%, the other falls 1%.
0 correlation: No discernible relationship exists; movements are independent.
Why
DRREDDY – Triangle Breakout in Play📊 DRREDDY – Technical & Educational Snapshot
Ticker: NSE: DRREDDY | Sector: 💊 Pharma
CMP: ₹1,276.60 ▲ (+2.51% | 22 Aug 2025)
Rating (for learning purpose): ⭐⭐⭐⭐ (Moderately Bullish)
Pattern Observed: 📈 Triangle Breakout with Volume Confirmation
📰 Sentiment Analysis
👉 Overall Sentiment: Positive ✅
• Bullish Drivers: Breakout from triangle formation, Morning Star on daily, bullish PinBar on monthly, strong Q1 results with revenue & profit growth, and renewed interest in pharma sector due to healt
PCJEWELLER: BB Squeeze Again!PCJEWELLER is again in narrow Bollinger Band squeeze which happens repeatedly with this stock (red arrows) and then it breaks out explosively up. RSI and volumes show nothing significant as of now. BB squeeze can lead to massive up or down break. Waiting if it will breakout again this time.
Triveni Engineering & Industries LTD - Multiple Indicators 📊 Script: TRIVENI (TRIVENI ENGINEERING & INDUSTRIES LIMITED)
📊 Nifty50 Stock: NO
📊 Sectoral Index: NIFTY500nif
📊 Sector: Fast Moving Consumer Goods
📊 Industry: Sugar / Agricultural Food & other Products
DAILY TIMEFRAME W PATTERN BREAKOUT
WEEKLY TIMEFRAME MACD CROSSOVER AND DOUBLE MOVING AVERAGE CROSSOVER SOON
Key highlights: 💡⚡
This stock pick is according to my study. I have use few indicator that is
BOLLINGER BAND
MACD
RSI
DOUBLE MOVING AVERAGE
VOLUME
📈 Script is trading at
Why am I bearish on IndusTowerHey, check out the trade setup for Industower
All 3 parameters are matched for a short trade.
Trade setup in Futures
Short : 193.10
Stoploss : 201
Target : 170 and 163
Options Trade
Bear Spread
Buy 29Sep2022 195PE
Sell 29Sep2022 190PE
Max. Profit: ₹ +7,280
Max. Loss: ₹ -6,720