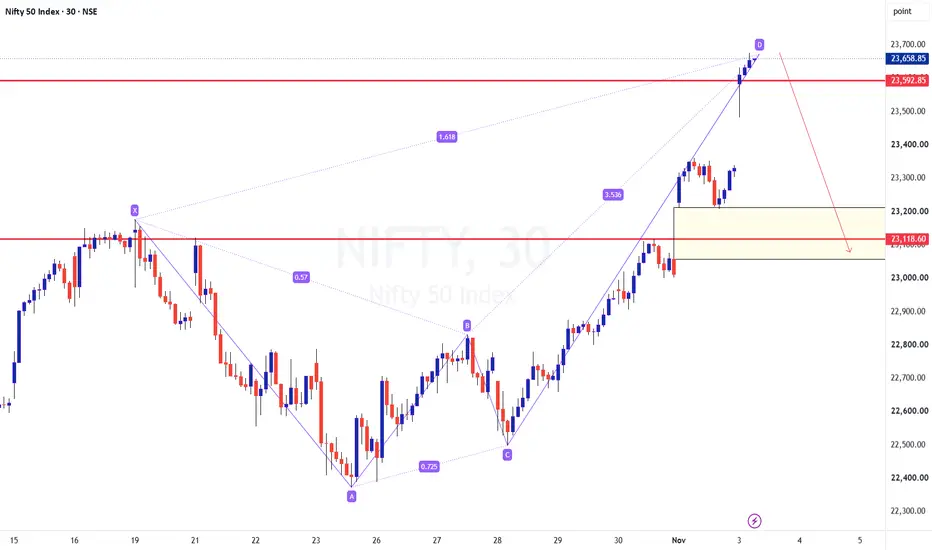
NIFTY at Harmonic CRAB PRZ (23670) - Moving towards 23100?CMP: 23650
TF: 30 minutes
The pattern suggests completion of Harmonic Crab pattern.
Expecting a pullback of 50% (CD leg) towards 23100 odd levels.
Waiting for a confirmation though, lower high or a a bearish engulfing candle
Disclaimer: I am not a SEBI registered Analyst and this is not a trading advise. Views are personal and for educational purpose only. Please consult your Financial Advisor for any investment decisions. Please consider my views only to get a different perspective (FOR o
Crab
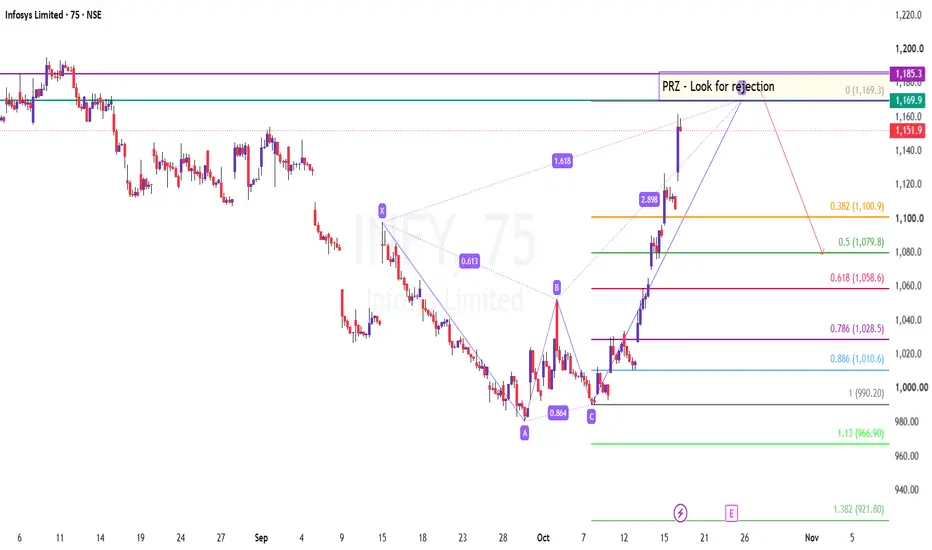
INFY - Bearish Harmonic CRAB PRZ is at 1170-1185CMP: 1156
TF: 75 minutes
As you can see, the price action suggests that a bearish Crab pattern is in play.
The Potential reversal zone as per this pattern is between 1170 and 1185.
If we see a rejection at this zone, we are looking at 1080 or lower.. Dont be aggressively long at this price point.
Disclaimer: I am not a SEBI registered Analyst and this is not a trading advise. Views are personal and for educational purpose only. Please consult your Financial Advisor for any investment decis
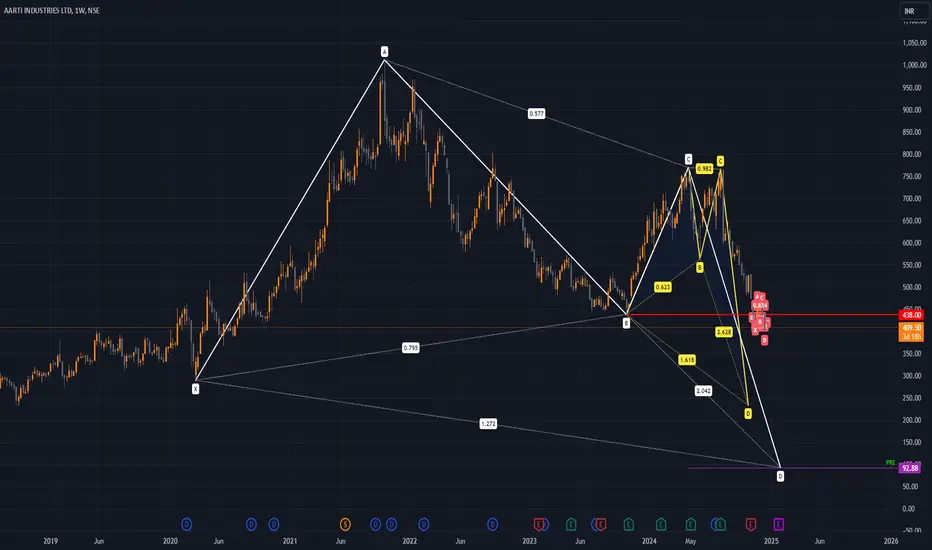
NMDCNMDC in Daily time frame formed crab harmonic pattern
Disclaimer
Information provided is for informational purposes only and should not be construed as investment advice or an offer to buy or sell securities. Investors are advised to carefully review all materials and consult with a financial advisor considering their own financial situation and risk tolerance before making investment decisions. The disclaimer also often includes statements about no guarantees or warranties regarding the
Aditya Birla Capital: Technical Analysis and Investment PerspectCrab Pattern Formation: Aditya Birla Capital has formed a Crab pattern, which is typically seen as a bullish reversal signal, indicating potential upward price movement.
Key Support Level: The stock is currently positioned at a strong support level of approximately ₹167, which could act as a crucial point for a price recovery.
Significant Decline from All-Time High: The stock has experienced a decline of about 30% from its all-time high, suggesting it may be undervalued and presenting an attract
Sterlite Technologies: Technical Analysis and Long-TermBat Pattern Formation: Sterlite Technologies has established a Bat pattern, which is often interpreted as a bullish reversal signal, indicating potential for future price increases.
Recent Decline: The stock has declined approximately 18% from its most recent high, suggesting it may be undervalued and offering a potential buying opportunity.
Long-Term Investment Potential: Given the technical indicators and recent price action, Sterlite Technologies presents a promising option for long-term inve
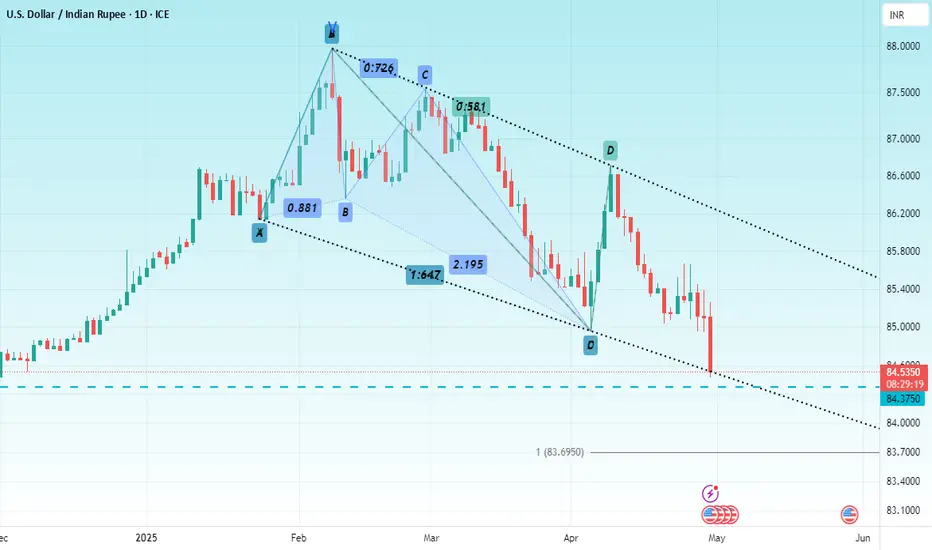
USD INRHello & welcome to this analysis
USDINR topped out on 10th Feb @ 88 to see a sharp reversal all the way till 4th April when it formed a bullish Harmonic Deep Crab pattern @ 85 that too lead to a more sharper bounce back till 9th April when it formed a bearish Harmonic Reciprocal ABCD pattern near the top end of the slanting channel.
From there we have witnessed yet another steep downward move which is currently resting at the lower end of the slanting channel. Failure to hold 84.45 - 84.35 cou
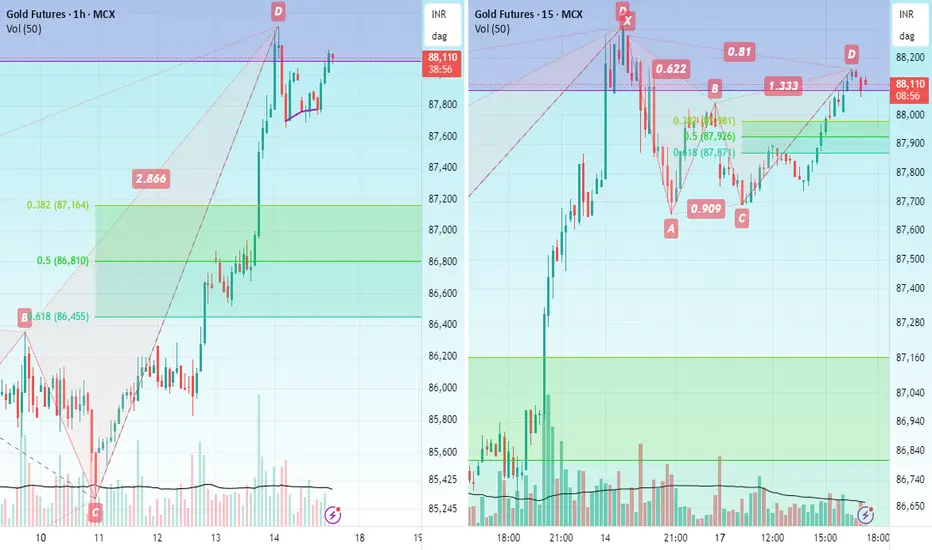
GOLDHello & welcome to this analysis
A bearish Harmonic Deep Crab formation took place in the 60m time frame, after an initial dip which formed bullish hidden RSI divergence in 60m time frame the pullback has now formed a bearish Harmonic Gartley in 15m time frame.
Sustaining below 88000 opens for 87500 and 86500.
Good risk reward set up for a bearish trade.
All the best
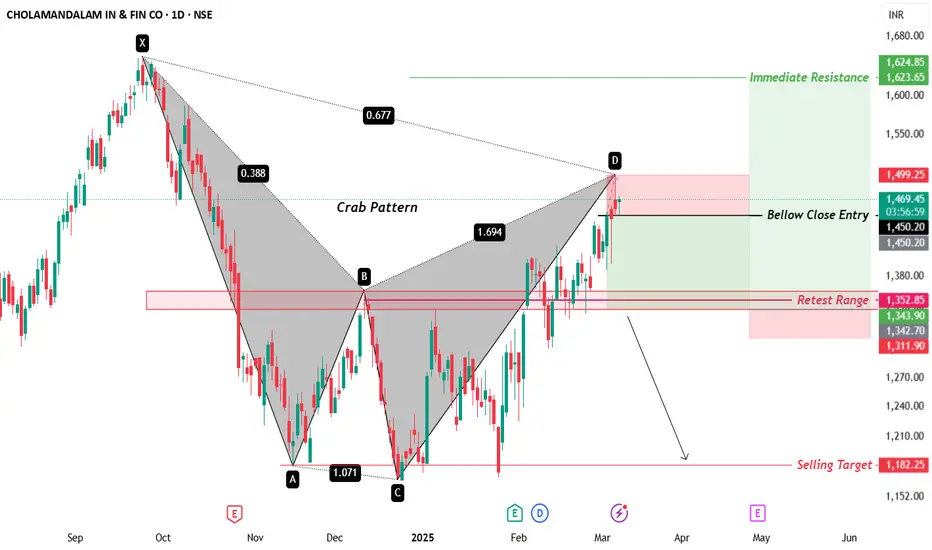
Cholamandalam Finance Cholamandalam Finance Trade Setup - Bearish Pattern Alert! 📉🔥
Stock: Cholamandalam Investment & Finance Co (NSE)
Timeframe: 1D Chart
🔍 Key Observations:
Crap Pattern Formation identified
Bellow Close Entry Trigger near ₹1,450.20
📉 Bearish Targets:
Retest Range: ₹1,352.85 - ₹1,311.90
Final Selling Target: ₹1,182.25
🚀 Resistance Zone:
Immediate Resistance: ₹1,623.65 - ₹1,624.85
📌 Breakdown Below ₹1,450 = Bearish Momentum Expected!
All detail for chat. good entry at mark price only. and must
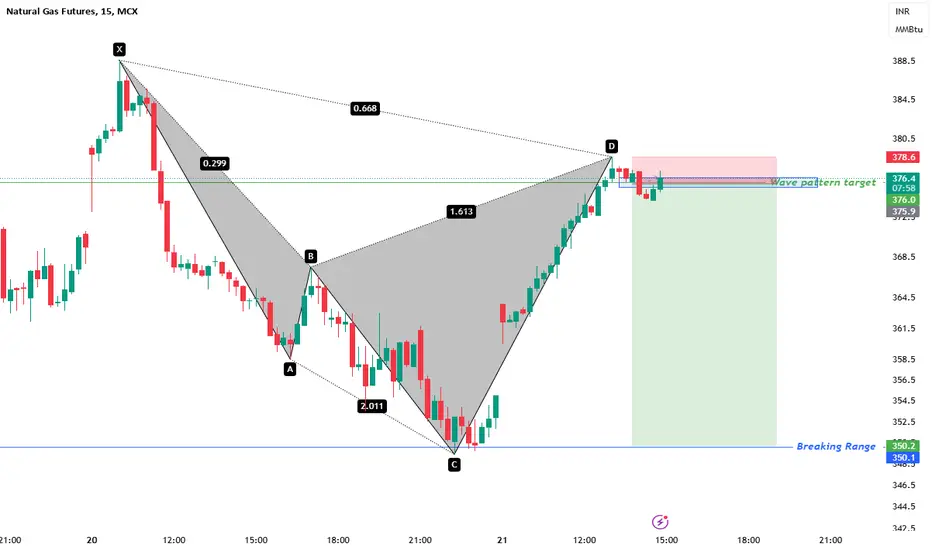
NG Next Move SL 1Hr candle close only, Target Trigger Price
All detail for chat. good entry at mark price only. and must stoploss minimum risk and good profit. risk ratio 1:1 to manage modified SL. This is not call, Just my idea. Please understand your risk and take full responsibility of your actions
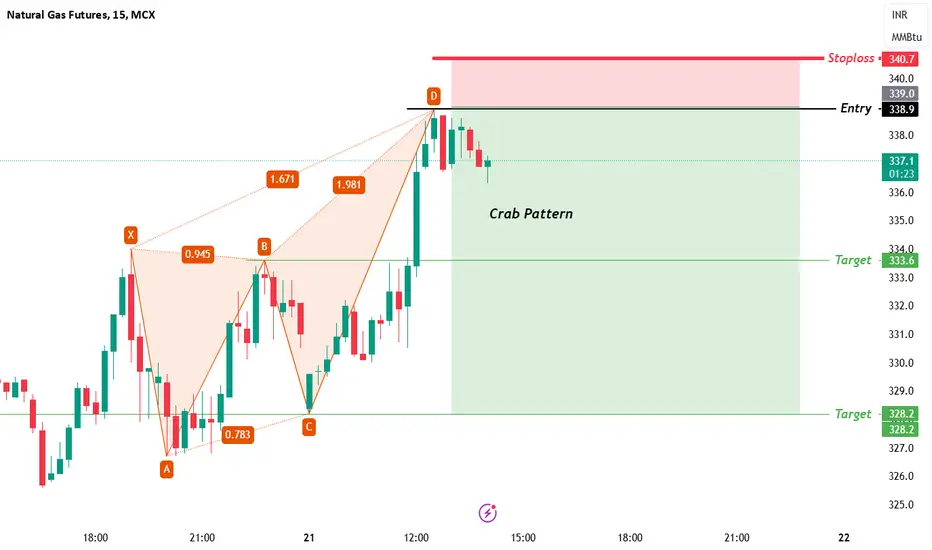
Naturalgas Next move SL 1Hr candle close only, Target Trigger Price
All detail for chat. good entry at mark price only. and must stoploss minimum risk and good profit. risk ratio 1:1 to manage modified SL. This is not call, Just my idea. Please understand your risk and take full responsibility of your actions
Natural gas Next Move SL 1Hr candle close only, Target Trigger Price
All detail for chat. good entry at mark price only. and must stoploss minimum risk and good profit. risk ratio 1:1 to manage modified SL. This is not call, Just my idea. Please understand your risk and take full responsibility of your actions
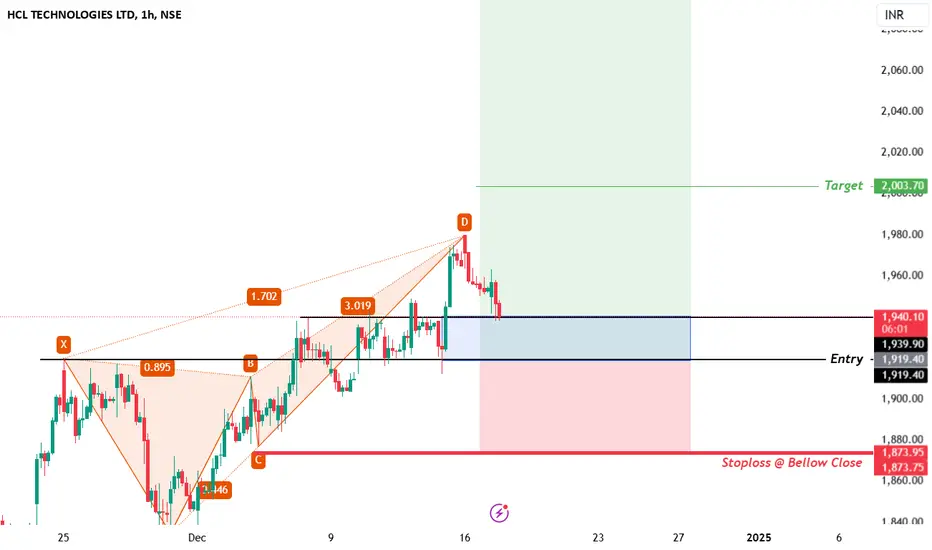
HCL Deep Crab SL day candle close only, Target Trigger Price
All detail for chat. good entry at mark price only. and must stoploss minimum risk and good profit. risk ratio 1:1 to manage modified SL. This is not call, Just my idea. Please understand your risk and take full responsibility of your actions
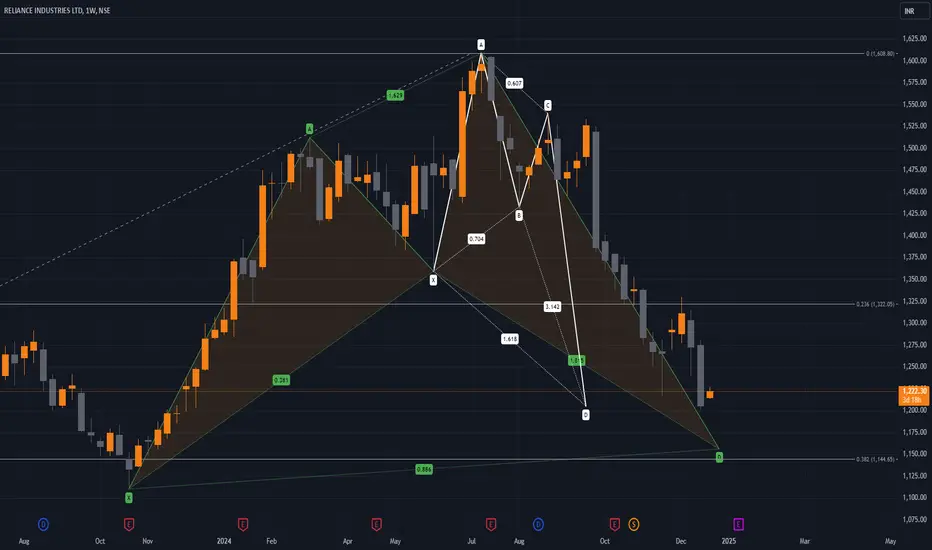
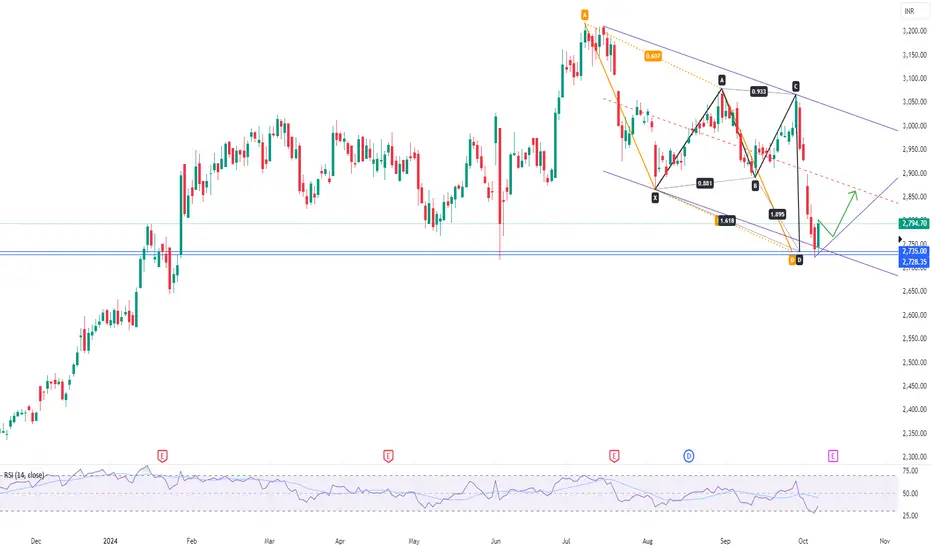
Reliance Industries - Double Bottom & Channel SetupReliance Industries reversing from double bottom & channel levels which confluences with AB=CD & Deep Crab harmonic reversal zones
Entry after retraces to 2760 levels with target near mid trendline of channel. Exit if price settles below 2720 levels.