Cup And Handle
SAIL - Monthly AnalysisIn the Monthly Chart of SAIL ,
we can see that; after very big Cup & Handle breakout and failure, it took Support of 110 levels.
It has shown a W shape recovery from 110 levels.
Let it retest or create a Halt candle and then enter with SL and Targets.
Expected momentum is shown in chart.
Will APEUSDT's Cup and Handle Propel It to New Heights?Yello Paradisers! Are you prepared to capitalize on the next big move in APEUSDT? Let’s break down the current setup and what it could mean for traders.
💎APEUSDT has recently taken the liquidity from the Fair Value Gap (FVG) and is now forming a textbook Cup & Handle pattern on a key support zone. This development significantly increases the probability of a bullish breakout.
💎If APEUSDT breaks out and closes a candle above the resistance zone, this will validate the Cup & Handle pattern, furt
LAURUSLABS - Cup-and-handle - BO - wklyLAURUSLABS
This chart depicts **Laurus Labs Ltd.** and showcases a **cup-and-handle** breakout pattern.
### Observations:
1. **Cup-and-Handle Pattern**:
- The stock formed a rounded "cup" with a resistance around ₹516.70.
- A brief consolidation (the "handle") followed, leading to a breakout above ₹516.70.
2. **Breakout Confirmation**:
- The price closed at ₹567.15 (+10.64%), indicating a strong breakout.
- The breakout is supported by high volume, confirming buying interest.
3.
DCM Shriram End of Bottom formationDCM Shriram posted fantastic Q2FY25 YoY with 95% profit. Debtor days reduced. Reduction in equity dilution. Q1 & Q2 posted improved YoY numbers with respect to sales & profit. Operating profit improved. Expecting margins and ROCE to improve. Price is just crossed above 50 Day moving average. Technical looks good. Could expect breakout soon.
Disclaimer: Not holding. Educational purpose
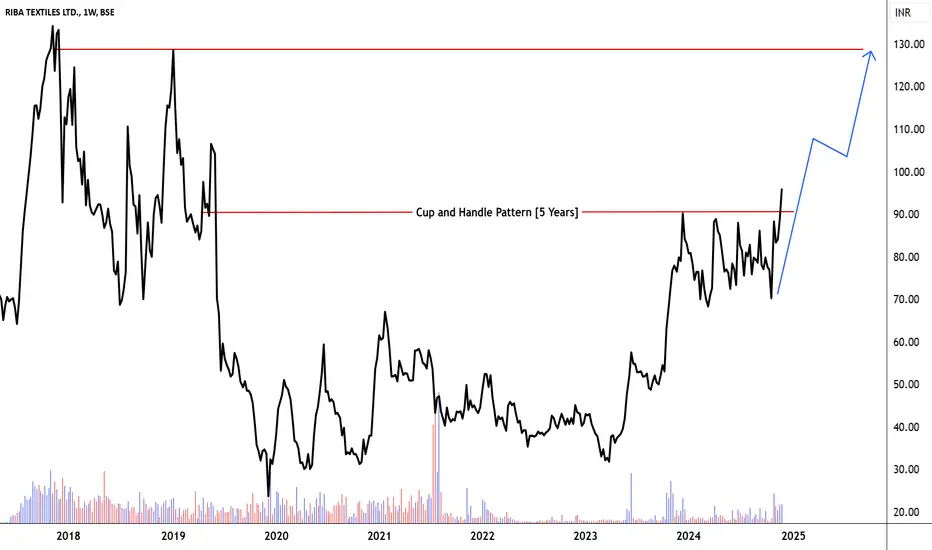
Riba Textiles Ltd. 95.81 [RIBATEX] – Cup and Handle Pattern (5 Y1. Pattern Overview
- Formation Details:
- The stock has developed a 5-year cup and handle pattern, a strong continuation formation indicating the potential for a bullish breakout.
- The cup portion reflects a gradual decline and recovery, showcasing accumulation over time.
- The handle portion is a short consolidation phase near the resistance, preparing for a breakout.
- The key resistance level is identified at ₹95, which aligns with the top of the pattern.
- Significance:
- This l
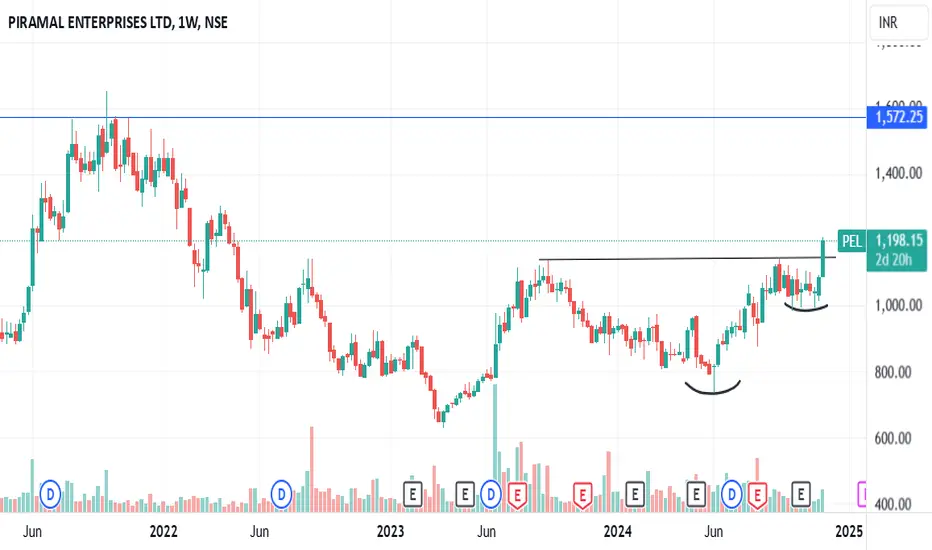
PEL C&H BREAKOUT WEEKLYPEL breaking c&h pattern weekly
good volume building up
trading above 20ema
#target 1570 after breaking 1300
sl 1020
NO BUY/SELL RECOMENDATION
PLong
cup handle in SIEMENS LTDAs of 30th Sep, 2024, the promoter held 75.0% of the stake in Siemens shares, out of which 6.67% was pledged. On the same date, foreign institutional investors' (FII) holdings of Siemens stocks was 8.69% as compared to 8.59% in Jun 2024 with increase of 0.1%. The domestic institutional investors (DII) holdings on 30th Sep, 2024 was 6.83% as compared to 6.99% in Jun 2024 with decrease of 0.16%. Out of the total DII holdings in Siemens shares 3.41% was held by mutual funds. The rest including publ
Nagreeka Capital & Infrastructure Ltd. Based on Cup and Handle P
1. Pattern Analysis
- Cup and Handle Pattern:
- Timeframe: 5 Years
- Description: The chart exhibits a classic cup and handle pattern, a bullish continuation pattern indicating potential for further upside. The resistance at ₹28 has been breached with a strong breakout, confirming the pattern.
- The extended timeframe of this pattern enhances its reliability and suggests a strong underlying bullish momentum.
2. Volume Analysis
- Volume Behavior:
- Volume remained low during the
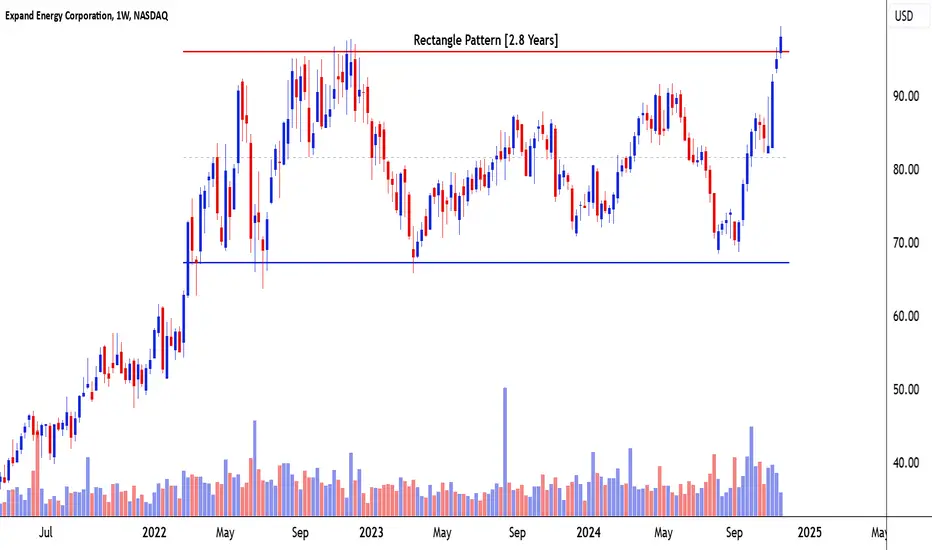
Expand Energy Corporation Based on Rectangle Pattern
1. Pattern Analysis
- Pattern: Rectangle Pattern
- Timeframe: 2.8 Years
- Description: Expand Energy Corporation has been trading within a well-defined Rectangle pattern, with horizontal resistance at $98 and support at $68. This prolonged consolidation phase represents a balance between buyers and sellers, with neither side dominating. The recent breakout above $98 signifies a potential end to this consolidation and the start of a new bullish trend.
2. Volume Analysis
- During the
EQT Corporation Based on Cup and Handle Pattern 1. Pattern Analysis
- Pattern: Cup and Handle Pattern
- Timeframe: 11 Years
- Description: EQT Corporation has formed a long-term Cup and Handle pattern on the weekly chart. The "cup" is characterized by a rounded bottom spanning several years, reflecting a gradual recovery from a significant downtrend. The "handle" represents a consolidation phase near the resistance level at $48, where price volatility decreases as buyers and sellers contest this critical level.
2. Volume Analysis
-
Has DOGSUSDT Finally Set the Stage for a Bullish Breakout?Yello, Paradisers! DOGSUSDT is showing some exciting signs of a potential bullish reversal, catching the attention of seasoned traders. But is it ready to deliver a strong move, or are we still waiting for more confirmation? Let’s dive in.
💎DOGSUSDT has broken out of a key resistance trendline, displayed a bullish Change of Character (CHoCH), and formed the classic cup-and-handle pattern—a combination that significantly increases the odds of an upward move.
💎A breakout and candle close above
Essarshipping - C&H Breakout - Retest- Buy above 37Essar Shipping - made cup and handle break out on 3rd June with great volumes at 34 Rs. There after the stock went up to to 69 and now it retraced to its previous breakout point ie. 34. The current Results are excellent and makes perfect entry above 37 for targets of 50/70, with Stop loss of 33.50
Views valid only above 37.
Essar Shipping quarterly results ending 30-Sep-2024 -
Revenue at 247.97Cr vs 11.76Cr
PBT at 639.12Cr vs -36.75Cr
PAT at 642.14Cr vs -35.92Cr
EBITDA at -6.48Cr vs -20.81