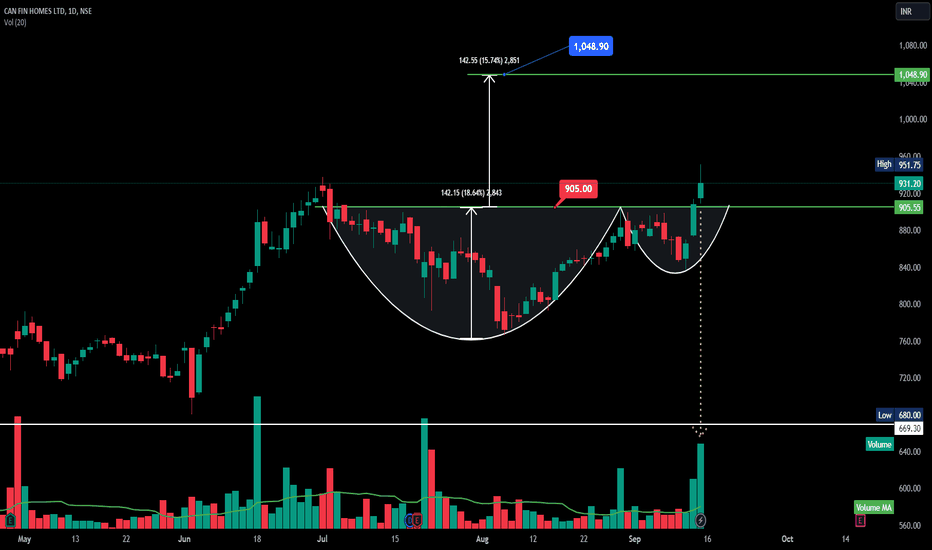
Long
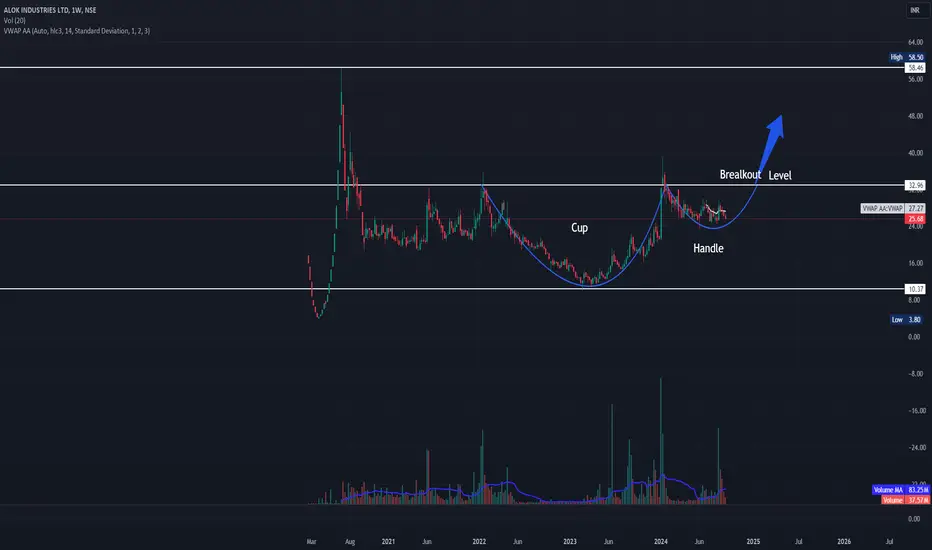
Long
Graphite INDIA- EV Boom - Buy Above 592Graphite India - leading manufacturers of graphite electrodes, which are essential for electric arc furnace (EAF) steelmaking.
Graphite India Limited is one of India's leading manufacturers of graphite electrodes, which are essential for electric arc furnace (EAF) steelmaking. Founded in 1974, the company also produces graphite-related products for industrial applications, such as high-temperature and corrosion-resistant materials. Its headquarters are in Kolkata, India, with manufacturing facilities spread across the country.
Financials:
Graphite India has experienced fluctuations in its financial performance due to the cyclical nature of the steel industry. In recent years, the company's revenue and profitability were affected by the downturn in global steel demand and rising input costs. However, the company has remained financially stable due to its low debt levels and significant cash reserves. Graphite electrodes are a key driver of the company’s revenue, and price changes in the global market impact its profitability.
Growth in the EV Sector:
With the rise of electric vehicles (EVs), demand for batteries and associated components has grown. Graphite India stands to benefit indirectly from this growth. Graphite is a crucial material in lithium-ion batteries, which power most EVs. While the company’s primary focus is on electrodes for steel production, it is exploring opportunities in the EV supply chain. This diversification could open new revenue streams and reduce dependence on steel industry cycles.
Future Revenue & Sales Opportunities:
The future growth of Graphite India is tied to global trends in steel production, EV battery materials, and graphite-based products. With increasing investments in renewable energy and EV adoption, the company has the potential to tap into the graphite market for energy storage solutions. Expanding its presence in battery-grade graphite could provide long-term growth opportunities. Additionally, technological advancements and a focus on sustainability may allow Graphite India to strengthen its market position.
Chart Details :
The stock has gvien double bottom breakout. and one can enter above - 592. for targets of 700/800 and above that open sky.
Stop Loss - 500.
Above 700. Stock will form Cup and Handle.
Disclaimer : Educational Content. Please do your own research.  Long
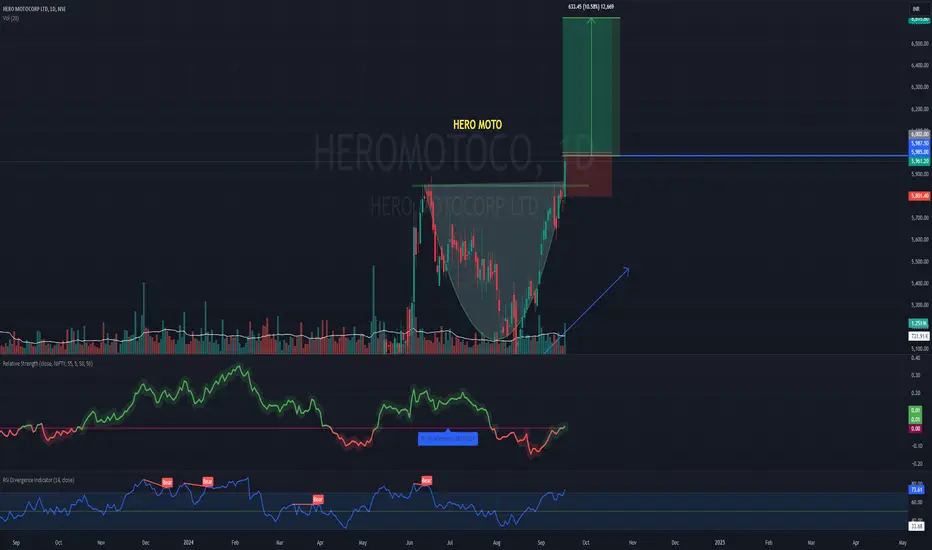
Long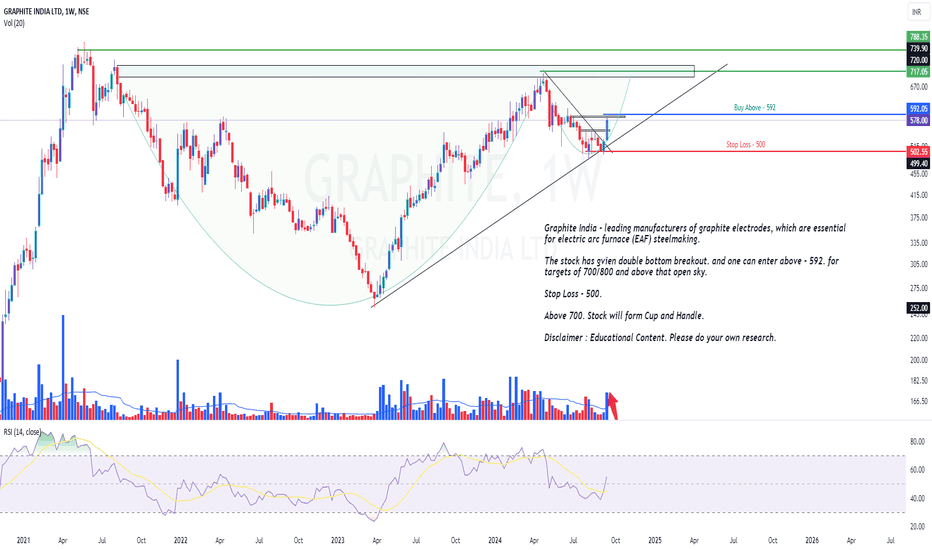
CENTURYPLY - Breakout Cup patternCENTURYPLY has shown a strong bullish breakout from a cup and handle pattern, which suggests a potential continuation of the uptrend. The increase in volume during the breakout supports this bullish sentiment.
Key Observations
Cup and Handle Formation: The chart appears to be forming a "Cup and Handle" pattern, which can often signal a bullish continuation after a period of consolidation.
Breakout: The stock has recently broken above the handle of the cup, indicating a potential bullish breakout.
Volume: The volume has increased during the breakout, supporting the bullish momentum.
Disclaimer: This analysis is for educational purposes only and does not constitute financial advice. The author is neither a registered stockbroker nor a registered advisor and does not give investment advice. His comments are an expression of opinion only and should not be construed in any manner whatsoever as recommendations to buy or sell a stock, option, future, bond, commodity, index, or any other financial instrument at any time.
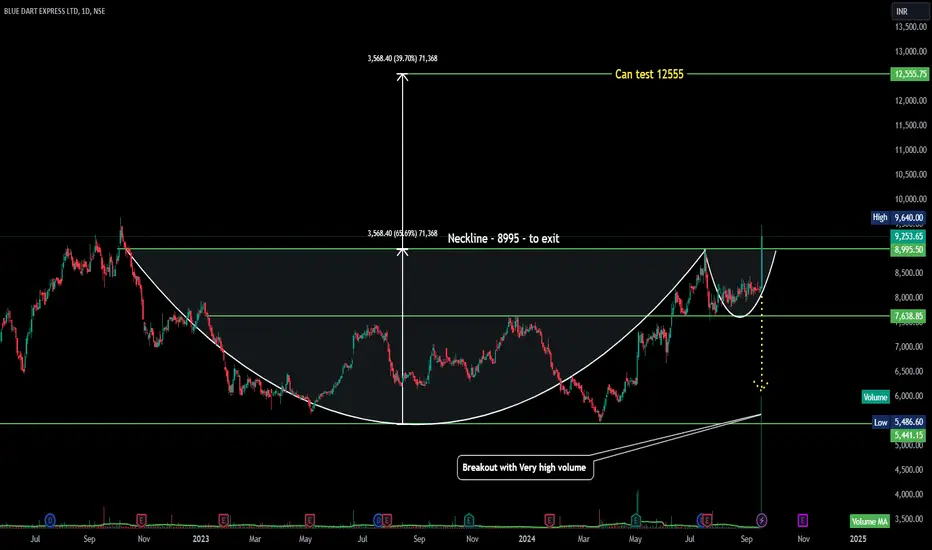
 Long
Long
CENTURYPLY: Bullish Breakout from Cup and Handle FormationCENTURYPLY has shown a strong bullish breakout from a cup and handle pattern, which suggests a potential continuation of the uptrend. The increase in volume during the breakout supports this bullish sentiment.
Key Observations
Cup and Handle Formation: The chart appears to be forming a "Cup and Handle" pattern, which can often signal a bullish continuation after a period of consolidation.
Breakout: The stock has recently broken above the handle of the cup, indicating a potential bullish breakout.
Volume: The volume has increased during the breakout, supporting the bullish momentum.
Disclaimer: This analysis is for educational purposes only and does not constitute financial advice. The author is neither a registered stockbroker nor a registered advisor and does not give investment advice. His comments are an expression of opinion only and should not be construed in any manner whatsoever as recommendations to buy or sell a stock, option, future, bond, commodity, index, or any other financial instrument at any time.
Long 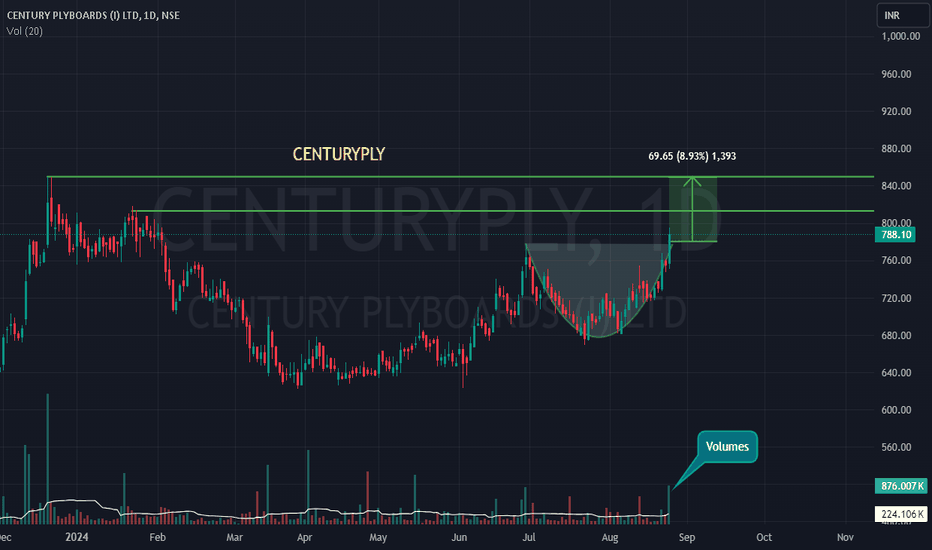
 Long
Long
 Long
Long
ICICI Bank Ltd - Cup and Handle -DailyThe chart you've shared appears to represent a daily price chart of **ICICI Bank Ltd.**, with several technical patterns and annotations, primarily focusing on a **Cup and Handle** formation.
Here’s a breakdown of key components and analysis:
### **Cup and Handle Pattern**:
- This is a bullish continuation pattern, indicating the potential for further upward movement.
- The "cup" part is formed when the price dips and then recovers, creating a "U" shape. The "handle" forms as a small consolidation after the cup, before a breakout to the upside.
### **Support and Resistance Levels**:
- **Neckline (1249 INR)**: This level is marked as the breakout point of the Cup and Handle pattern. The price has broken above this neckline, confirming the bullish pattern.
- **High (1272.25 INR)**: This is the most recent high at which the price is trading.
- **Potential Target (1342 INR)**: The chart suggests that the price can test this level based on the measured move from the height of the Cup and Handle pattern.
- **Volume**: The volume bars at the bottom of the chart show that there was an increase in volume as the price broke above the neckline, supporting the breakout.
Trend Channels:
- The yellow parallel trendlines show an ascending price channel, indicating that the stock has been in a bullish trend for a while. The price appears to be respecting these lines as dynamic support and resistance.
### **Measured Move**:
- There are vertical lines drawn from the neckline to the top of the cup, showing a measured move of **94.20 INR**, or an 8.17% gain, which projects a target of 1342 INR.
### **Volume Analysis**:
- The chart shows a spike in volume recently, which is crucial in confirming the breakout from the Cup and Handle pattern. Strong volume usually accompanies valid breakouts.
### **Summary**:
- The chart is bullish overall, with the price breaking out from the Cup and Handle pattern.
- The measured move suggests a price target of **1342 INR**.
- The breakout is confirmed by volume, and the ascending channel suggests the continuation of an uptrend.
- As long as the stock stays above the neckline and within the upward channel, the bullish outlook remains intact.
This could be a good opportunity for bullish traders if the price sustains its position above the neckline level of 1249 INR.  Long
Long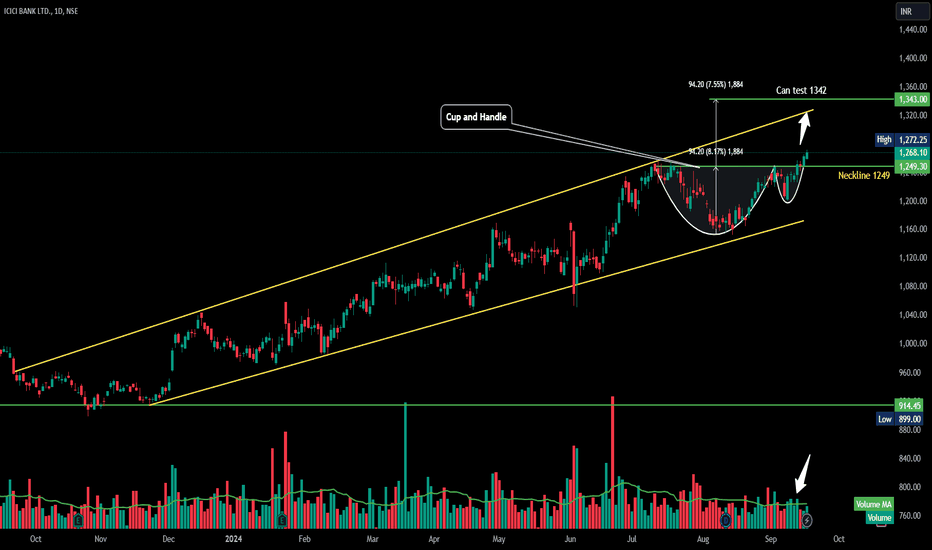
 Long
Long
 Long
Long
Long 
 Long
Long
 Long
Long
 Long
Long
Long 
 Long
Long
MOREPENLAB - Multiyear Breakout -Cup and Handle - MonthlyMOREPENLAB - Cup and Handle pattern, which is a bullish continuation pattern indicating a potential upward trend. Here are some key points from the chart:
Cup and Handle Pattern: This pattern suggests that after a period of consolidation (the “cup”), there is a slight dip (the “handle”) before a potential breakout to higher prices.
Neckline: The neckline is marked at 74 will also act as stoploss.
Target Price: The potential target price is around 146, if the pattern completes successfully.
Volume: There is a significant increase in trading volume, highlighted by a large green bar. This often indicates strong buying interest and can support the bullish breakout.
Overall, the chart suggests a positive outlook if the price breaks above the neckline with strong volume support.
A multiyear breakout occurs when a stock or asset breaks out of a long-standing trading range, typically lasting several years. This breakout is significant because it often signals a major shift in market sentiment and can lead to substantial price movements. Here are some key points:
Long-Term Resistance: The asset breaks above a resistance level that has held for several years.
Volume: A multiyear breakout is often accompanied by a significant increase in trading volume, indicating strong investor interest.
Technical Indicators: Various technical indicators, such as moving averages, RSI, and MACD, can help confirm the breakout.
“21 yrs Multiyear breakout with good volume” suggests that the asset has broken out of a trading range that lasted for 21 years, supported by strong trading volume. This is a bullish signal indicating potential for further price appreciation.
Fundamental Factors: Sometimes, fundamental changes in the company’s business, industry, or broader economy can drive a multiyear breakout.
 Long
Long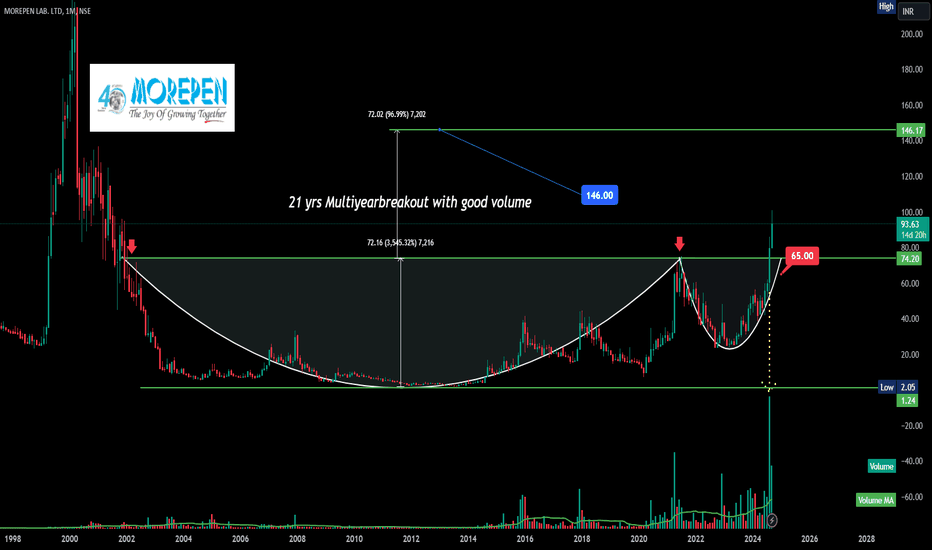
 Long
Long
NAZARA - Cup and Handle breakout - WklyName - NAZARA
Pattern - Cup and Handle breakout
Timeframe - Daily and Weekly
Volume - Very Good
Cmp - 1049
Can test - 1390
SL - 989
Cup and Handle pattern, which is a bullish continuation pattern indicating a potential upward trend. Here are some key points from the chart:
Cup and Handle Pattern: This pattern suggests that after a period of consolidation (the “cup”), there is a slight dip (the “handle”) before a potential breakout to higher prices.
Neckline: The neckline is marked at 989. This is a critical resistance level. Price breaks above this level, it has confirm the pattern and lead to further gains.
Target Price: The potential target price is around 1390 if the pattern completes successfully.
Volume: There is a significant increase in trading volume, highlighted by a large green bar. This often indicates strong buying interest and can support the bullish breakout.
Overall, the chart suggests a positive outlook if the price breaks above the neckline with strong volume support.
Price in range from 475 to 989 for 2.6 yr, Friday price closed abv that.
Nazara Technologies reported its Q1 FY24 results, showcasing a strong performance. Here are the key highlights:
Revenue: ₹250 crores, a slight dip from ₹254.4 crores in the same quarter last year1.
Net Profit: ₹23.6 crores, marking a 12.9% increase from ₹20.9 crores in the previous year2.
EBITDA: ₹24.9 crores, a 24.7% decrease year-on-year2.
The growth in net profit was driven by a strong performance in the esports vertical, despite lower profits in the gaming segment and losses in adtech2.  Long
Long
INDUSINDBK - Cup and Handle breakout - DailyName - INDUSINDBK
Pattern - Cup and Handle breakout
Timeframe - Daily
Volume - Avg
Cmp - 1464
Can test - 1570
SL - 1450
Q1 FY 2023-24 Key Highlights Consolidated financial results
o Net Interest Income (NII) grew by 18% YoY to ₹4,867 crores from ₹4,125 crores
o NIM improved to 4.29% as at Q1 FY24 as compared to 4.21% as at Q1 FY23 and 4.28% as at Q4 FY23
o Quarterly Net Profit grew by 30% YoY to ₹2,124 crores from ₹1,631 crores
o Deposits grew by 15% YoY to ₹3,47,047 crores from ₹3,02,719 crores
o Gross NPA and Net NPA ratios improved to 1.94% and 0.58% from 2.35% and 0.67% YoY respectively
and PCR at 71% as at June 30, 2023
o CRAR as on June 30, 2023 at 18.40% as compared to 18.14% on June 30, 2022
Always welcome for any comments with your feedback or give it a like if you find it useful.
==========================================================================
Disclaimer: This analysis is for informational purposes and not financial advice. The author is not a registered financial advisor. Individuals should conduct their research and seek professional advice before making investment decisions  Long
Long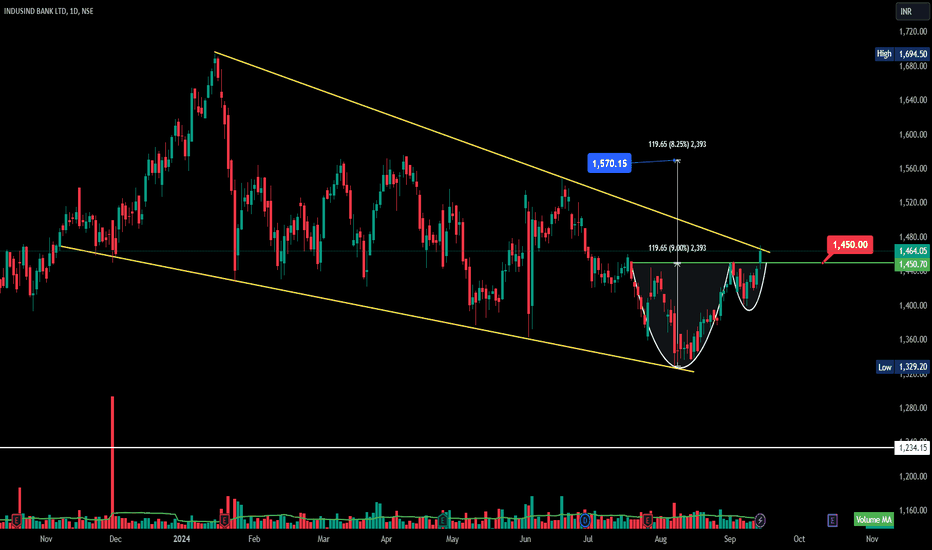
 Long
Long
 Long
Long