BSOFT for short-midterm HoldingLooks good for mid-long term investment. I am looking at targets of 540, 605, 720, 950Longby AneelKaushik2
HEROMOTOCORP BULLISHBreakout in rounding bottom in weekly charts. Looking bullish with breakout of all time high prices. Minimum 1000 Rupee run from here and target of 9100 by Dec 2026 Be patient its a good companyLongby MoneyMentors0
HCL TECH BULLISHHCLtech is showing a good formation in the weekly timeframe. Its already forming a rounding bottom breakoout above 1725. Already a trendline breakout is seen here on weekly closing basis. Looks bullish for a target of 2075 in 4-6 weeks.by MoneyMentors1
Sensex - Expiry day analysis Dec 4The price fall in the morning session, found support at the 84800 zone and moved up, which created a rounding bottom pattern. The nearby support zones are 84800, 84500. The nearby resistance zone is at 85500. If the price opens gap down and finds support or shows bullish strength at the 84800 or 84500 zone, we can buy. If the price opens flat and shows bullish strength above 85000, buy above 85140 with the stop loss of 85000 for the targets 85280, 85420, 85600, 85720 and 85860. If the price facby vanathiUpdated 539
VARUN BEVERAGES :Likely FLAG Pattern BreakOutVBL:Trading at around 485 range.20DEMA Golden cross over above 50/100/200 DEMA in daily chart.Has been consolidating between 480-485 and has formed a flag patten,break above 490 its neckline breakout resistance on closing basis likely to test 515+ as per the pattern(For educational purpose only)Longby CSB6855
ADANIPORTS : Almost Cup and Handle Breakout Adaniports is near its cup and handle Breakout phase and also Near ATH as market... let's see how its perform from here.. All data is available in public domain.. CMP : 1516 SL : Below Daily 21 EMA Stock's selection based on 5 Point Analysis: 1: Idea : Cup and Handle Breakout. 2: Support : Volume, Delivery . 3: Technical : 21/55/200-EMA, Super trend up, RS>0 RSI. 4: Fundamental : PE, PAT, Industry & peer PE and sector performance. 5: Timing : Entry Timing on Daily chart. Disclaimer Longby SthitaprajnaYogi3
HDFC Bank: Massive Multi-Year Cup-and-Handle BreakoutHDFC Bank is showing a very bullish multi-year Cup-and-Handle breakout. Price has finally broken above the long-term horizontal resistance zone and is now retesting it as support. This stock is also in majority of mutual fund's top holdings, so this makes it a safer bet.Longby anuragAnand3214
FLUENCE ENERGYFLUENCE ENERGY MADE DOUBLE BOTTOM with DIVERGENCE in monthly chart and also in process of forming CUP & HANDLE FORMATION, and it is at resistence level at $24, if it breaksout resistance at $24 we can expect to reach $30 & $44. Chart analysis done on best of my knowledge, it may reach or may not reach targets :-) Longby satyagajula3
NIfty50 Analysis: Is it start of new bull run or a bull trap?Nifty50 Has given a cup& handle breakout and has already retested this breakout. Currently, it is hovering near ATH and already looks ready for a breakout. If this breakout sustains, we might see a good rally coming till budget(Feb'26) and levels to watch according to fib are 27500, 28150 & 29000. However, December is a favourite season for FIIs to offload money and a correction is historically seen during Christmas season. So, there is a high probability of a bull trap formation as well. 253by chartistamey0
TATA STEEL- cup and handleTATA STEEL cup and handle formation in the making. Breach of 185 levels leading to targetsLongby Pravesh100
BPCL - CUP AND HANDLE FORMATIONBPCL cup and handle formation. possible breakout from level should lead to next levelLongby Pravesh101
RELIANCE INDUSTRIES- CUP AND HANDLERELIANCE INDUSTURED POISED FOR A RUN BASED ON 1) SWING STRUCTURE 2) FIBO LEVELS 3) CUP AND HANDLE PATTERN Any dip should be considered as buying opportunity.Longby Pravesh100
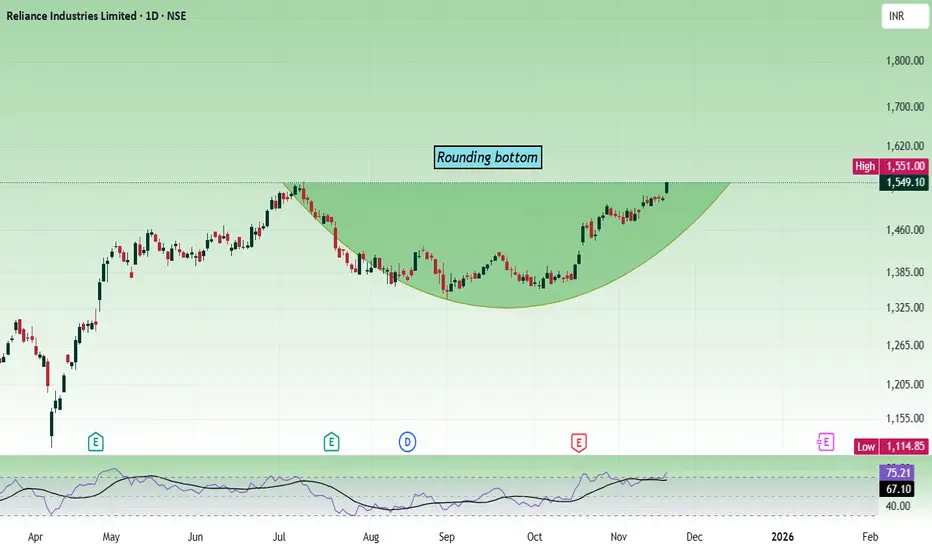
Reliance - Multi time frame analysis...We are going to see the daily and weekly charts. It's beautiful to see how the patterns are aligning. The daily chart shows, the price has formed a rounding bottom, and right now it is testing the rounding bottom resistance/high. The weekly chart shows, the price is nearing the cup and handle pattern resistance, which is around the zone 1600. Support is at 1350. Any dip can be used as a buying opportunity as long as the price is above 1350. As per the daily chart, we can enter above 1520 with tLongby vanathiUpdated 21
Cup n handle & head n shoulders 1HTVC:NI225 1H shows negative pattern and price action. ready for break down please do your own research before taking any trade. i am not financial advisor risk is real stay practical please feel free to ask any questions Shortby Jatin1093
Something is cooking big than patternNSE:NIFTY Nifty make continuously cup pattern smaller than previous cup . this is good sign for uptrend. but here also some negative points like all time resistance, negative pattern at all time resistance also another trend line resistance. global uncertainty here is big role. these are negative point. you think i make confusion right but only half. every analysis has two side 1. if analysis will right than we are ready for plan of action. 2. if analysis will wrong than we also ready for plaLongby Jatin1092
RELIANCE INDUSTRIES LTD:Likely Cup&Saucer Break OutRELIANCE: Trading at 1530-1540. Trading above all its Critical moving averages even in weekly chart . Moreover DEMA has given a golden cross over of 20DEMA in weekly chart shows the strength in the stock. Reliance has for med a Cup& Handle pattern in weekly chart and RIL holding above 1540-1550 on closing basis likely to test 1650+(For educational purpose only)Longby CSB6813
RELIANCE | Perfect cup & handle setup - Looks very strong 30%RELIANCE | Perfect cup & handle setup - Looks very strong for 30% short term Last time the flag breakout disappointed, but this time Cup & handle will restore the faith i believe Looks like 2026 is going to be a large cap year ! KOTAKBANK RELIANCE TCS INFY index heavy weights are super bullishLongby srikartiram9
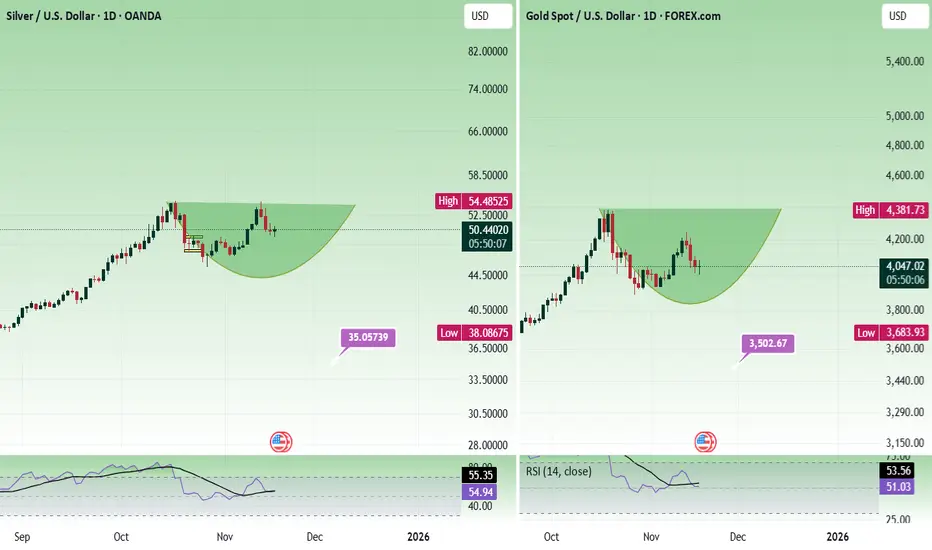
Trader's Queries - Gold & Silver - A reviewI rarely publish ideas about gold, and this is the first time I am writing about silver. This is not about where to buy or sell. Idea is about the structure of the price action. Both gold and silver is forming a rounding bottom pattern. If it gives a breakout right away, then sustaining above these levels are crucial. For gold, 4378 - 4382 and for silver, 55.45 - 55.55. Rounding bottom low is at 3886 for gold, and even if there is a big fall, it should not go below 3876 - 3884 to be bullish. Forby vanathi428
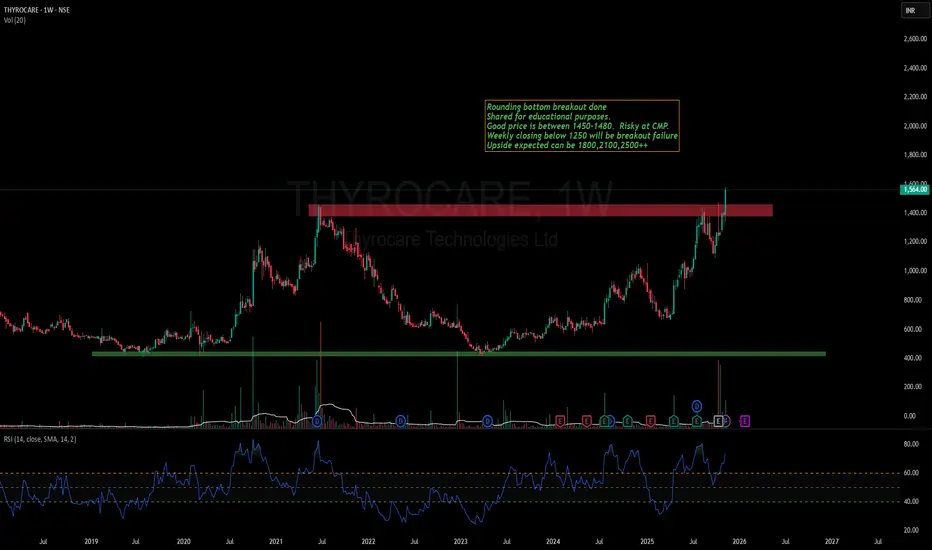
Thyrocare - Cup & Handle Breakout on Weekly Time FrameThyrocare has given a Cup & Handle Breakout on weekly time frame. Factors which will lead to 40%-200% return: 1. Cup & Handle breakout pattern 2. ATH Breakout 3. Volumes has picked up at Breakout 4. Fundamentally, super results in Q2 and best sales ever Stock looks super fundamentally and technically. Must in your portfolio. Keep following @Cleaneasycharts as we provide Right Stocks at Right Time at Right Price. Cheers!!! Longby Cleaneasycharts515
Thyrocare Technologies – Weekly Chart Breakout AnalysisCup & Handle pattern breakout visible on higher timeframe (1W). Price has retested the breakout zone around ₹1325 and given a strong bounce with volume. Key Points: 🔹 Multi-year Cup & Handle formation 🔹 Breakout + successful retest 🔹 Strong momentum candles after retest 🔹 Next potential zone: ₹1650 – ₹1750 (if momentum continues) Support : ₹1325 Short-term trend : Bullish Structure : Higher highs – Higher lows Not a recommendation. Just sharing my chart study.Longby ProfitPrism2
Latent View Analytics Ltd (Latentview) CnH Trendline BreakoutLatent View Analytics Limited (Nse: latentview) share is ready for a trendline breakout. The technical pattern appears to be a cup and handle. The stock is already closed outside the line. #latentview #breakoutLongby BreakoutStocks2
Money moves the market - Bank NiftyTraders say price moves the market. Bulls or bears move the market etc... But the fact is, money moves the market. You cannot ignore Bank Nifty when analyzing Nifty. When bank sector is supporting, Nifty gives a trending move. Public sector bank stocks are on the move, while private sector bank stocks are not. We can see that Bank Nifty was facing resistance around the 57500 zone for a long time, and now it is sustaining above it. The rounding bottom pattern looks promising in Bank Nifty. Let uby vanathi1033
BankofIndia - Short to Long Term Investment BuyBank of India - Technical Analysis Current Price: 129.77 Timeframe: Monthly Chart Key Technical Observations 1. Currently, PSU banks are exhibiting bullish characteristics with positive sector support influencing the stock positively. 2. Cup and Handle Formation - The stock is displaying a gradually developing cup and handle pattern, a classic bullish continuation setup that suggests potential upside momentum. 3. Rising Channel Support - Bank of India is actively trading within and supported Longby earnwhileulearnUpdated 11
Thyrocare-A beautiful breakout is done!Thyrocare has given a good closing today above its previous ATH. Stock has formed a beautiful rounding bottom pattern. Volumes buildup before breakout is decent as well. Previously, i had covered Policybazar & Zomato with such patterns and they have given amazing returns. Keep this stock in watchlist. This can give similar move as well. Entering at ATH levels is tricky but these stocks come with excellent reward opportunity. I am NISM certified RA and not SEBI registered. This is not a recommeLongby chartistamey14
 LongLong
 Long
Long

 Long
Long Long
Long Long
Long Long
Long
 Long
Long Long
Long LongLong
 ShortLongLongLong
 LongLong
 Long
Long

 LongLong