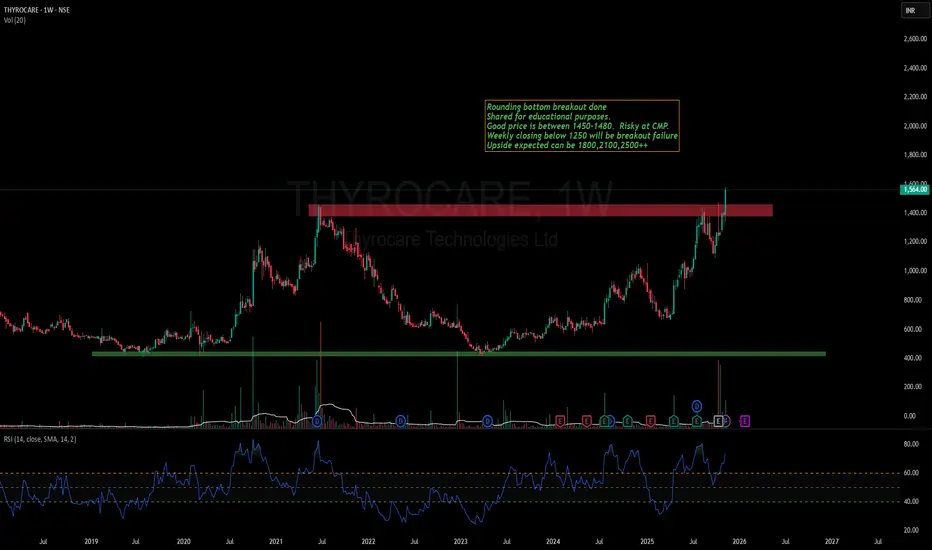
Thyrocare-A beautiful breakout is done!Thyrocare has given a good closing today above its previous ATH.
Stock has formed a beautiful rounding bottom pattern. Volumes buildup before breakout is decent as well.
Previously, i had covered Policybazar & Zomato with such patterns and they have given amazing returns.
Keep this stock in watchlist. This can give similar move as well.
Entering at ATH levels is tricky but these stocks come with excellent reward opportunity.
I am NISM certified RA and not SEBI registered.
This is not a recomme
Cup And Handle
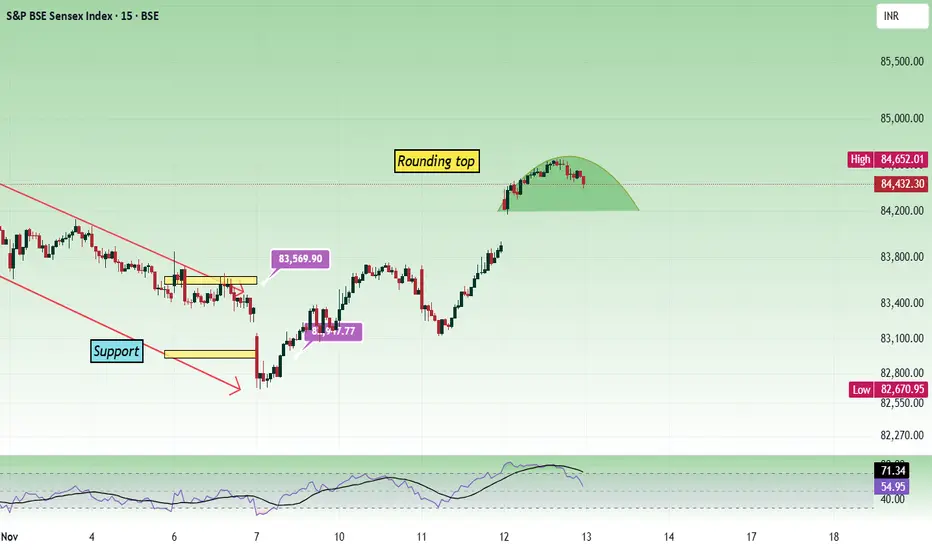
Sensex - Expiry day analysis Nov 13We had a gap-up opening today, and the price moved up in the morning session and momentum reduced, resulting in a small pullback in the afternoon session. If the price opens flat tomorrow and the same trend continues, then we will get a rounding top pattern. If price gains bearish strength, then the gap formed today will get filled.
Support zones are 84200 and 83950 - 84k. Nearby resistance is at the 84750 - 84850 zone.
When support, resistance zones are nearby, it sometimes gives a choppy move.
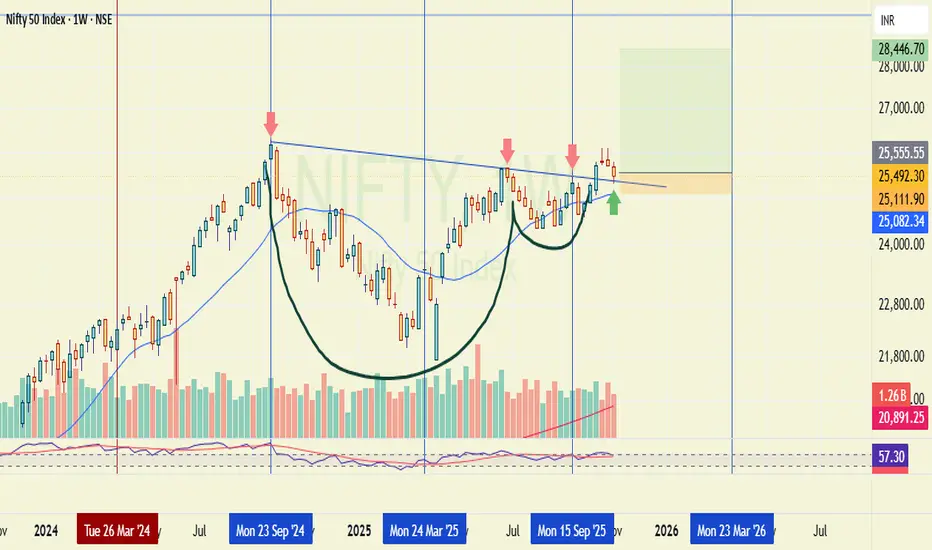
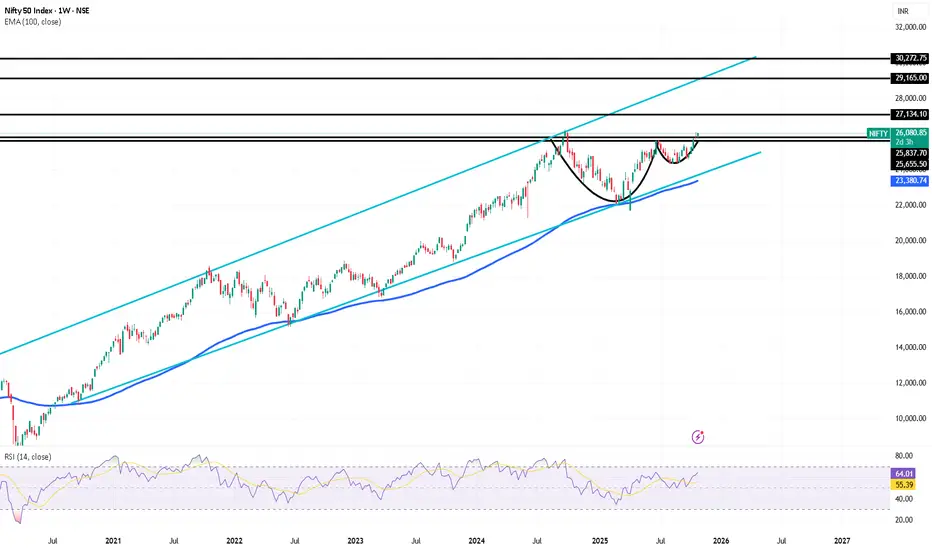
Possible Nifty Resistance to supportMultiple bullish confluences in Nifty at current level is seen.
1. There is good resistance to support possible in Nifty nr ATH.
2. Good cup and handle pattern.
3. There is support nr weelky 20sma.
If nifty closes above Friday's high than it will trigger buy which can take nifty to 29000+ levels.
We need to wait for next week close. Target and SL marked on chart.
Technical Analysis: M & B Engineering Ltd (NSE: MBEL)🧩 Chart Pattern
The stock has formed a Cup and handle pattern—a bullish continuation structure.
The cup depth is around 23% (from ₹588 to ₹476). T -588
Handle breakout occurred with strong volume, confirming institutional buying.
✅ Pattern Confirmation:
Breakout candle closed above ₹476 zone, validating the pattern.
CANBK | Cup and Handle | Wkly📆 Multi-Year Weekly Chart
🔹 Pattern: Cup & Handle (2010–2025)
🔹 Breakout Zone: ₹124–126 ✅
🔹 Current Price: ₹132.9
🔹 Target: ₹235 (~+88%)
🔹 Stop-loss: ₹118
🔹 Support: ₹115–118
🔹 Resistance: ₹164
Trend Strength:
✅ Price > EMA50 / EMA100 / EMA200
✅ Rising volume on breakout
✅ Bullish PSU bank momentum
Fundamentals (Jun’25):
💰 EPS ₹5.5 | P/E 6.5 | P/BV 1.1
🏦 MCap ₹1.2L Cr | Sector: Major Banks
⚙️ Cup depth projection → 235 zone
✳️ Long-term breakout after 15 years of consolidation
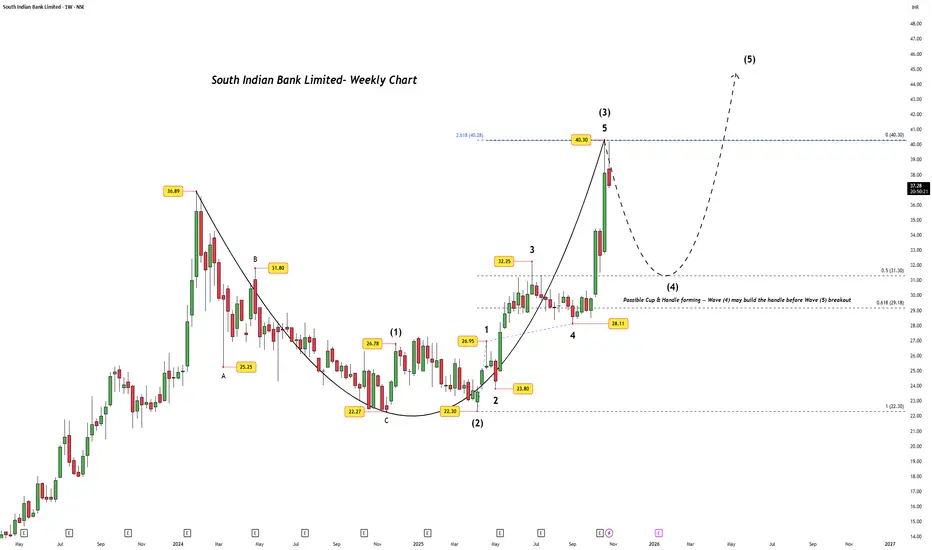
South Indian Bank Ltd — Going South Before It Heads North?After a stellar impulsive rise, South Indian Bank seems to be taking a short trip south — just to refuel for its next northern journey.
The weekly chart unfolds a beautiful Elliott Wave sequence, where Wave 5 of (3) topped precisely at ₹40.30 , aligning exactly with the 2.618 Fibonacci extension of Wave 1 (₹22.30–₹26.95) projected from Wave 4 (₹28.11).
Such precision often signals wave exhaustion — and that’s what we’re seeing now, as prices cool off from the climax of Wave (3). The retra
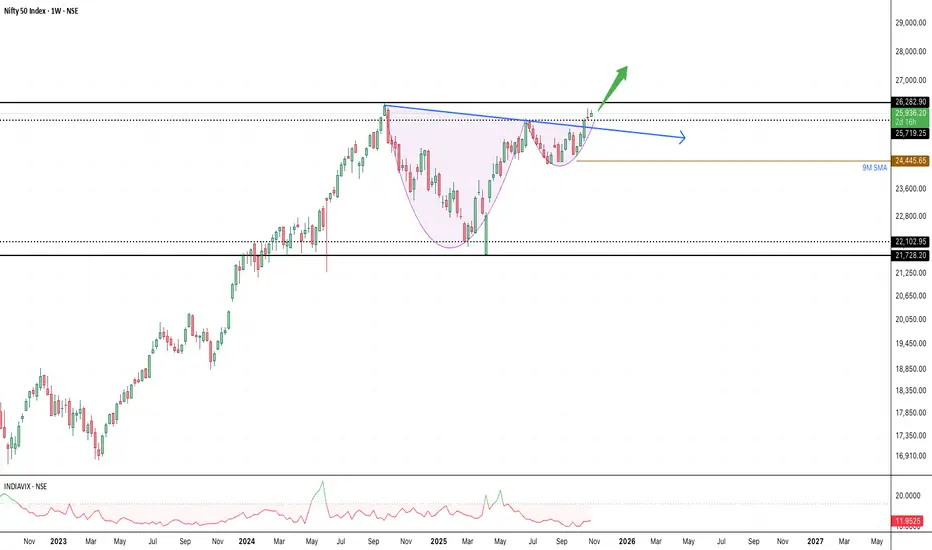
NIfty Positional on the verge of Breakout PatternHello everyone,
Nifty weekly forming Cup & handle pattern and about to break along with lifetime high with Good RSI strength is 64. Nifty corrected 16% from preivous high of 26270 falls continue for almost 6 month and in next 6 month recovered fully....possible trading in channel above 26600-700 there is 27500 and the 30000 is the targets.
CHOLAFIN| ! Cup and Handle pattern | DailyThe chart displays a confirmed Cup and Handle pattern, which is a highly bullish continuation pattern.
Pattern: Cup and Handle (Daily Chart).Breakout: The price has successfully broken out above the pattern's resistance level (the lip of the cup) at approximately $₹1,656.60. This move is typically followed by a strong upward rally.
Target: The measured move target for this pattern is projected at $₹2,149.
Recommendation: Strongly Bullish on a daily timeframe. Maintain the breakout level ₹1,65
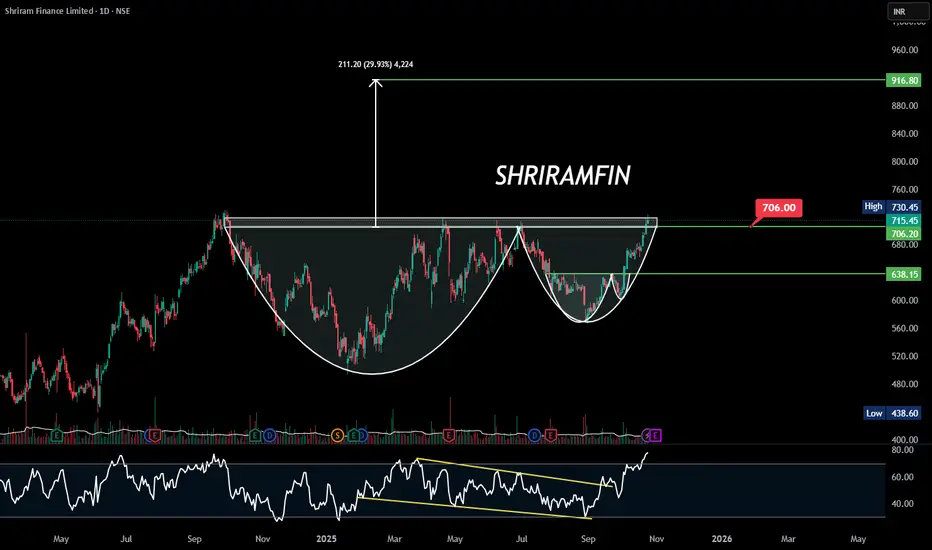
SHRIRAMFIN | Cup and Handle Breakout | Target ₹950–₹1020**SHRIRAMFIN | Cup & Handle Breakout 🚀**
Shriram Finance has broken out of a **large Cup and Handle** pattern on the daily chart, confirming strong bullish momentum.
RSI breakout and rising volume support the move.
* **Breakout zone:** ₹715–₹730
* **Support:** ₹706 / ₹638
* **Targets:** ₹916
* **Stop-loss:** ₹706
*Bias: Bullish | Timeframe: Medium-term*
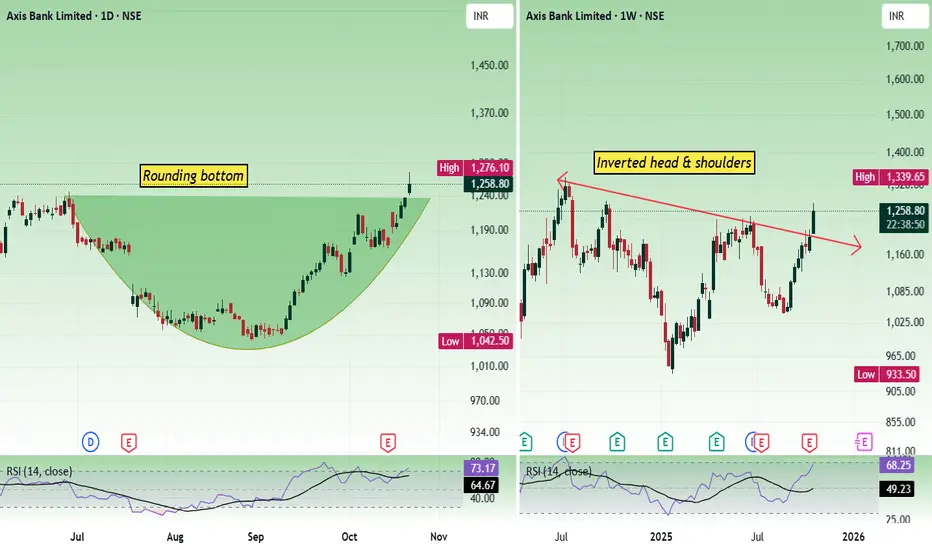
Axis bank - Multi time frame analysisIn the daily time frame, the price has formed a rounding bottom pattern. In the weekly time frame, the price has formed an inverted head and shoulders pattern. Both are bullish patterns.
As long as the price is sustained above 1200, bulls have the chance to move the price up.
Price can bounce from the level 1230 - 1245.
If price shows bearish strength from the current levels and falls down, buy above 1240 with the stop loss of 1222 for the targets 1258, 1276, 1294 and 1312.
If the price opens fl
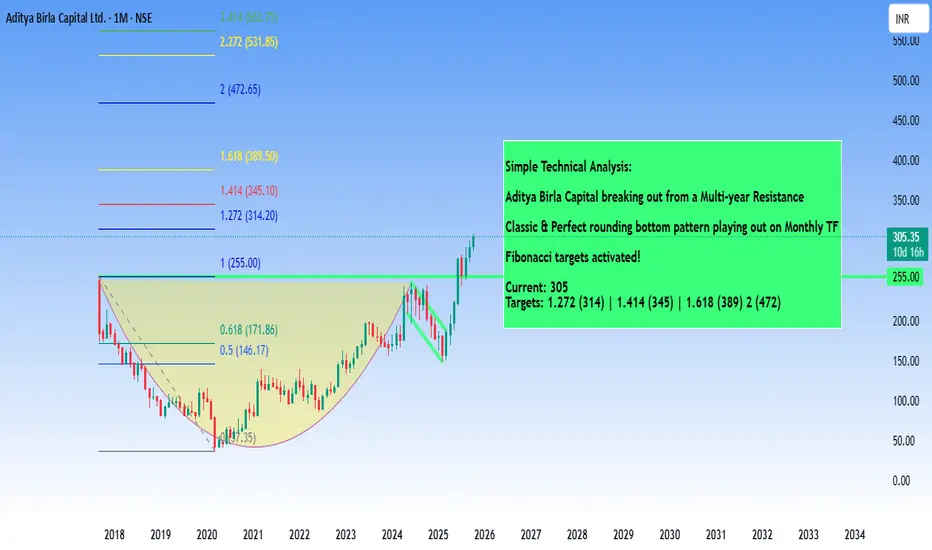
AdityaBirlaCapital - Investment IdeasAditya Birla Capital Ltd - Technical Analysis
Simple Technical Analysis Summary
Aditya Birla Capital is breaking out from a multi-year resistance zone with a classic and perfect rounding bottom pattern playing out on the monthly timeframe.
Fibonacci targets have been activated!
Key Technical Observations
1. Multi-Year Rounding Bottom Pattern
The stock has completed a textbook rounding bottom formation spanning multiple years. This is one of the most reliable bullish reversal patterns in techn
Long Term Buy #GMRCurrent market Price: ₹153.35
Key Technical Analysis Points
"Major Breakout Achievement"
The stock has successfully broken out of a 16-year resistance level around ₹101.73, which had been a significant barrier since the 2009 highs.
Previous ATH : ₹111.17
- Target 1: ₹125.86
- Target 2: ₹153.35
Key support : ₹101.73 (former resistance, now support)
**Long-term Pattern**: The chart shows a classic long-term consolidation pattern from 2009-2023, followed by a strong breakout and retracement
Sammaan Capital Ltd. Current Price is : 138In this chart you see the "SAMMAANCAP" candlestick chart where we this see that it looks something like a Cup & Handle Pattern.
We may see a big upside move once it breaks the trend line. ( Right Side )
I believe maybe in upcoming 3 months this price can cross 400.
This is no financial advice please do your own research before investing.
Also do comment If you like funny charts #funtrading#TradingView#September#SAMMAANCAP
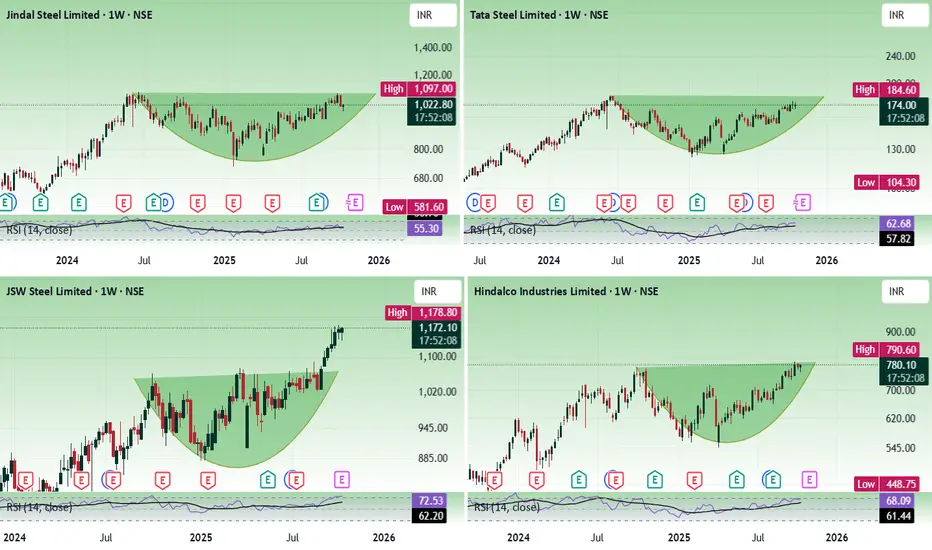
Metals - Ready to shine?As Nifty is gaining bullish strength, I took the metal sector stocks to do an analysis and found a similar pattern formation. The pattern I found is a rounding bottom, which is a bullish pattern.
Among the stocks, tatasteel, JSW steel, Jindal steel and Hindalco, JSW steel is showing more strength as it has already broken the rounding bottom resistance and is moving up.
JSW steel - has support at 1120 zone and resistance at 1200 - 1220 zone.
Tatasteel support is at 160 and resistance is at the 1
Cup and Handle & Inverse Head and Shoulder in Adani Ports.The Stock Had Formed Cup And Handle & Inverse Head and Shoulder. It seems to breaks out of the Neckline, it may hit the IHNS target of 1662 approximately. And than Target of Cup & Handle. Lets see how it unfolds .Rest targets will be updated as chart unfolds. All Targets mention are Approximate. Good luck. TY .
ITS JUST PURELY FOR LEARNING AND EDUCATIONAL PURPOSE. Please Consult your financial advisor before trading or investing. I am not responsible for any kinds of your profits and your losse
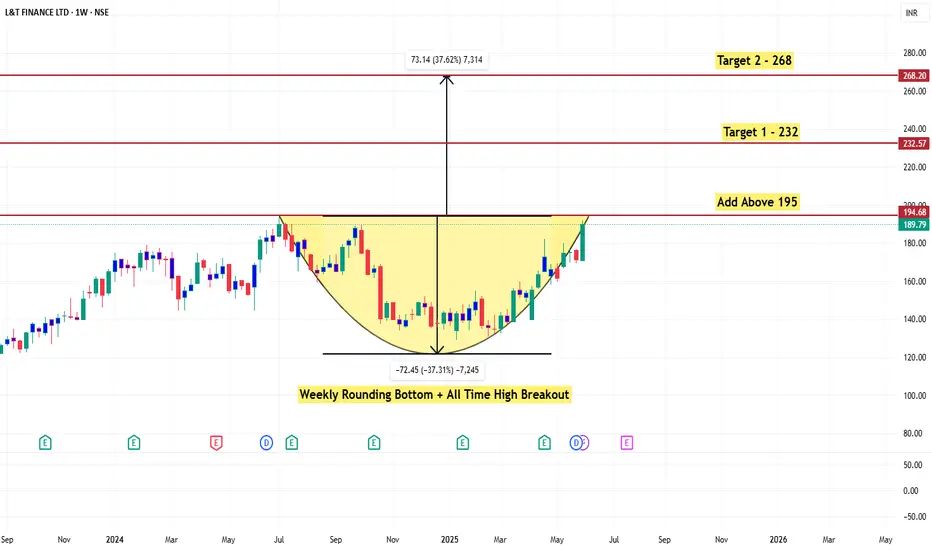
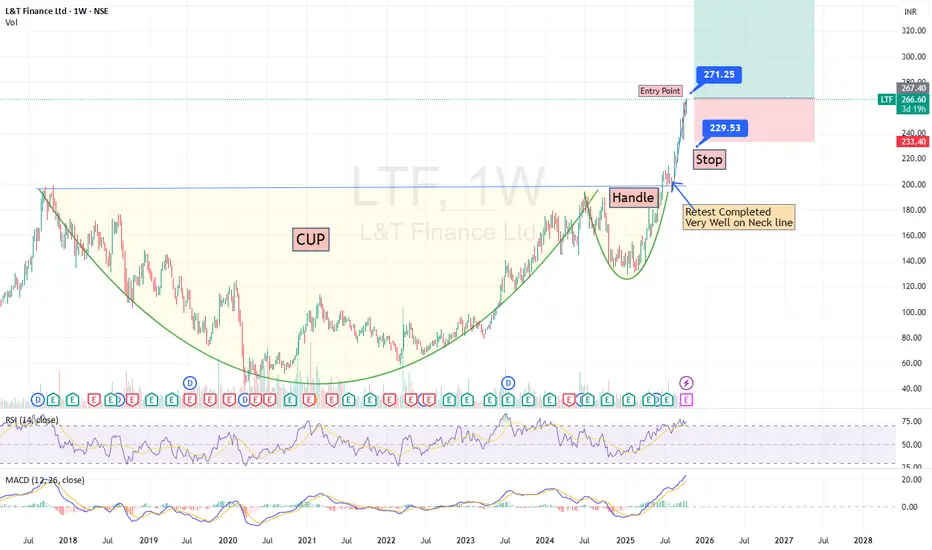
Beautiful Cup & Handle Trade in L&T Finance in Weekly Time FrameL&T Finance has started its next leg Movement on already completed Cup & Handle breakout.
As you can see from the charts, the price has consolidated for around 8 years under this beautiful cup and Handle formation. Having this pattern in a weekly time frame and having already completed the neckline break out, with excellent retest and pullback, the stock is well poised for a zooming move in further days.
Adding fuel to the move is that its results is expeced on 15th October, which is expected
Nifty - Expiry Day Analysis Oct 7Today, the price moved along with the upper trend line of the channel and is sustaining above 25000. Now price has to break 25100 with bullish strength to move towards 25400.
The hourly chart shows the formation of a rounding bottom.
Buy above 25120 with the stop loss of 25070 for the targets 25160, 25200, 25260 and 25300.
Sell below 24960 with the stop loss of 25010 for the targets 24920, 24880, 24820 and 24780.
Expected expiry day range is 24900 to 24250.
Always do your analysis before taking
Sequent Scientific - 2 CUP & HANDLE PatternsSequent Scientific is heading for a 60% to 200% upside. Following are the factors:
Technical Factors:
1. 2 Cup & Handle Patterns waiting for a breakout
2. Small Cup & Handle - giving a potential upside of 60%
3. Large Cup & Handle - giving a potential upside of 200%+
4. Price respecting 20EMA
Technical Factors:
1. India's largest animal healthcare company and world's top 20 companies
2. Merger with Viyash - on the verge of completion
3. Post merger - Big Topline and Big Profits
Do keep this